An official website of the United States government
An official website of the United States government
The .gov means it's official.
Federal government websites often end in .gov or .mil. Before sharing sensitive information,
make sure you're on a federal government site.
The site is secure.
The
https:// ensures that you are connecting to the official website and that any
information you provide is encrypted and transmitted securely.
20-709-ATL
Wednesday, April 29, 2020
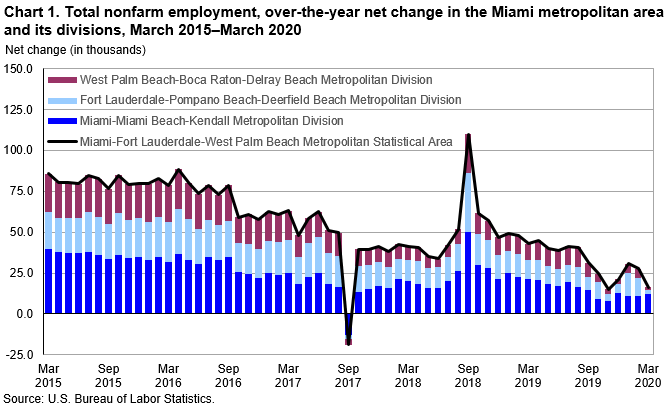
Total nonfarm employment for the Miami-Fort Lauderdale-West Palm Beach, FL Metropolitan Statistical Area stood at 2,741,500 in March 2020, up 16,400, or 0.6 percent, over the year, the U.S. Bureau of Labor Statistics reported today. During the same period, the national rate of job growth increased 1.0 percent. Regional Commissioner Janet S. Rankin noted that Miami’s over-the-year employment gain in March was less than the 27,500 jobs gained in February. (See chart 1 and table 1; the Technical Note at the end of this release contains metropolitan area definitions. All data in this release are not seasonally adjusted; accordingly, over-the-year analysis is used throughout.)
The Miami area is made up of three metropolitan divisions—separately identifiable employment centers within the larger metropolitan area. All three divisions gained jobs over the year. Miami-Miami Beach-Kendall, the largest of the three divisions with 45 percent of the area’s employment, added 12,300 jobs from March a year ago. The Fort Lauderdale-Pompano Beach-Deerfield Beach Division, which accounted for 32 percent of Miami area’s workforce, gained 2,500 jobs, while the West Palm Beach-Boca Raton-Delray Beach Division added 1,600 jobs over the 12-month period.
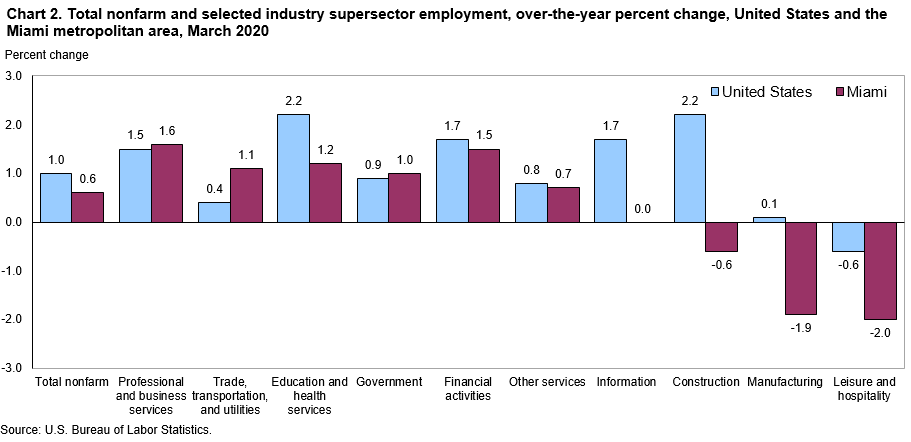
Industry employmentMiami’s professional and business services sector had the largest over-the-year increase in March 2020, adding 7,100 jobs, a 1.6-percent rate of job growth. Two of the three divisions gained jobs in this sector since March 2019, with the largest gain in the Fort Lauderdale metropolitan division (+4,900). Nationally, employment in professional and business services was up 1.5 percent over the year. (See chart 2.)
The trade, transportation, and utilities sector in the Miami area added 6,700 jobs, a 1.1-percent increase over the year. The Fort Lauderdale (+4,500) and Miami (+4,400) metropolitan divisions added jobs in this sector. Nationally, employment in trade, transportation, and utilities was up 0.4 percent since March 2019.
Miami’s education and health services sector added 5,100 jobs, a 1.2-percent gain over the 12-month period. Job growth in this sector was primarily in the Miami metropolitan division (+5,500). Nationally, the rate of job growth in education and health services was up 2.2 percent over the year.
Miami’s leisure and hospitality sector had the largest over-the-year decrease, losing 6,900 jobs, down 2.0 percent from March 2019. Job loss in this sector was focused in the Fort Lauderdale metropolitan division (-8,500). Nationally, employment in leisure and hospitality was down 0.6 percent.
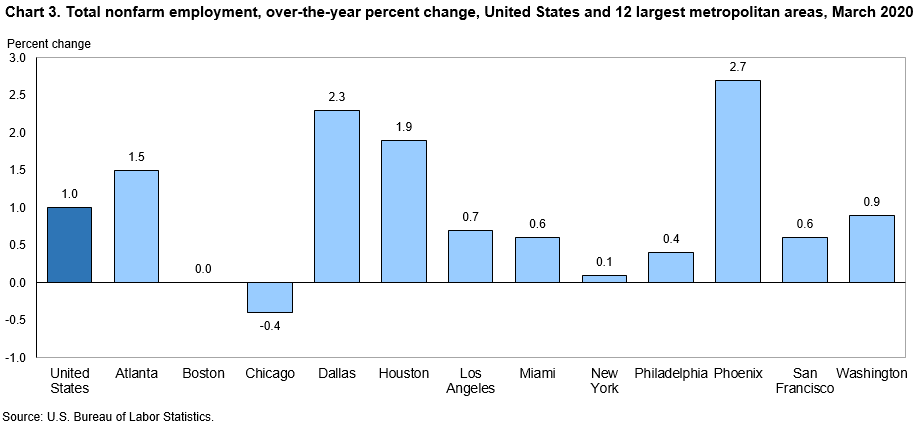
Employment in the 12 largest metropolitan areasMiami-Fort Lauderdale-West Palm Beach was 1 of the nation’s 12 largest metropolitan statistical areas in March 2020. Four areas had rates of job growth that exceeded the national rate of 1.0 percent. Phoenix-Mesa-Scottsdale had the fastest rate of job growth (+2.7 percent), followed by Dallas-Fort Worth-Arlington (+2.3 percent). Chicago-Naperville-Elgin had an over-the-year decline in total employment, down 0.4 percent. (See chart 3 and table 2.)
Among the 12 areas, Dallas added the largest number of jobs (+86,200) from March 2019 to March 2020, followed by Houston-The Woodlands-Sugar Land (+59,000) and Phoenix (+58,100). Seven metropolitan areas had job gains ranging from 44,900 in Los Angeles-Long Beach-Anaheim to 11,300 in New York-Newark-Jersey City. Chicago was the only metropolitan area that lost jobs over the past year (-20,600).
Over the year, education and health services added the most jobs in six areas: Atlanta-Sandy Springs-Roswell, Chicago, Los Angeles, New York, Philadelphia-Camden-Wilmington, and Phoenix. Professional and business services added the most jobs in the remaining six areas: Boston-Cambridge-Nashua, Dallas, Houston, Miami, San Francisco-Oakland-Hayward, and Washington-Arlington-Alexandria.
Leisure and hospitality lost the most jobs in eight areas: Boston, Chicago, Los Angeles, Miami, New York, Philadelphia, San Francisco, and Washington. Atlanta and Phoenix had no job losses in any supersectors from March 2019 to March 2020.
Metropolitan area employment data for April 2020 are scheduled to be released on Friday, May 22, 2020.
This release presents nonfarm payroll employment estimates from the Current Employment Statistics (CES) program. The CES survey is a Federal-State cooperative endeavor between State employment security agencies and the Bureau of Labor Statistics.
Definitions. Employment data refer to persons on establishment payrolls who receive pay for any part of the pay period which includes the 12th of the month. Persons are counted at their place of work rather than at their place of residence; those appearing on more than one payroll are counted on each payroll. Industries are classified on the basis of their principal activity in accordance with the 2017 version of the North American Industry Classification System.
Method of estimation. CES State and Area employment data are produced using several estimation procedures. Where possible these data are produced using a "weighted link relative" estimation technique in which a ratio of current-month weighted employment to that of the previous-month weighted employment is computed from a sample of establishments reporting for both months. The estimates of employment for the current month are then obtained by multiplying these ratios by the previous month's employment estimates. The weighted link relative technique is utilized for data series where the sample size meets certain statistical criteria.
For some employment series, the sample of establishments is very small or highly variable. In these cases, a model-based approach is used in estimation. These models use the direct sample estimates (described above), combined with forecasts of historical (benchmarked) data to decrease volatility in estimation. Two different models (Fay-Herriot Model and Small Domain Model) are used depending on the industry level being estimated. For more detailed information about each model, refer to the BLS Handbook of Methods.
Annual revisions. Employment estimates are adjusted annually to a complete count of jobs, called benchmarks, derived principally from tax reports which are submitted by employers who are covered under state unemployment insurance (UI) laws. The benchmark information is used to adjust the monthly estimates between the new benchmark and the preceding one and also to establish the level of employment for the new benchmark month. Thus, the benchmarking process establishes the level of employment, and the sample is used to measure the month-to-month changes in the level for the subsequent months.
Reliability of the estimates. The estimates presented in this release are based on sample surveys, administrative data, and modeling and, thus, are subject to sampling and other types of errors. Sampling error is a measure of sampling variability—that is, variation that occurs by chance because a sample rather than the entire population is surveyed. Survey data are also subject to nonsampling errors, such as those which can be introduced into the data collection and processing operations. Estimates not directly derived from sample surveys are subject to additional errors resulting from the special estimation processes used. The sums of individual items may not always equal the totals shown in the same tables because of rounding.
Employment estimates. Measures of sampling error for the total nonfarm employment series are available for metropolitan areas and metropolitan divisions at www.bls.gov/sae/additional-resources/reliability-of-state-and-area-estimates.htm. Measures of sampling error for more detailed series at the area and division level are available upon request. Measures of sampling error for states at the supersector level and for the private service-providing, goods-producing, total private and total nonfarm levels are available on the BLS website at www.bls.gov/sae/additional-resources/reliability-of-state-and-area-estimates.htm. Information on recent benchmark revisions is available online at www.bls.gov/sae/publications/benchmark-article/annual-benchmark-article.pdf.
Area definitions. The substate area data published in this release reflect the delineations issued by the U.S. Office of Management and Budget on April 10, 2018. A detailed list of the geographic definitions is available at www.bls.gov/lau/lausmsa.htm.
The Miami-Fort Lauderdale-West Palm Beach, FL Metropolitan Statistical Area includes the counties of Broward, Miami-Dade, and Palm Beach in Florida.
Additional information
More complete information on the technical procedures used to develop these estimates and additional data appear in Employment and Earnings, which is available online at www.bls.gov/opub/ee/home.htm. Industry employment data for states and metropolitan areas from the Current Employment Statistics program are also available in the above mentioned news releases and from the Internet at www.bls.gov/sae/.
Information in this release will be made available to sensory impaired individuals upon request. Voice phone: (202) 691-5200; Federal Relay Service: (800) 877-8339.
| Area and Industry | Mar 2019 | Jan 2020 | Feb 2020 | Mar 2020(p) | Mar 2019 to Mar 2020(p) | |
|---|---|---|---|---|---|---|
| Net change | Percent change | |||||
United States | ||||||
Total nonfarm | 149,359 | 150,153 | 151,055 | 150,804 | 1,445 | 1.0 |
Mining and logging | 731 | 701 | 700 | 697 | -34 | -4.7 |
Construction | 7,170 | 7,240 | 7,271 | 7,331 | 161 | 2.2 |
Manufacturing | 12,774 | 12,766 | 12,796 | 12,783 | 9 | 0.1 |
Trade, transportation, and utilities | 27,358 | 27,734 | 27,479 | 27,460 | 102 | 0.4 |
Information | 2,838 | 2,857 | 2,881 | 2,885 | 47 | 1.7 |
Financial activities | 8,658 | 8,762 | 8,804 | 8,803 | 145 | 1.7 |
Professional and business services | 20,908 | 21,139 | 21,250 | 21,229 | 321 | 1.5 |
Education and health services | 24,113 | 24,403 | 24,716 | 24,645 | 532 | 2.2 |
Leisure and hospitality | 16,090 | 16,092 | 16,245 | 15,988 | -102 | -0.6 |
Other services | 5,833 | 5,862 | 5,890 | 5,882 | 49 | 0.8 |
Government | 22,886 | 22,597 | 23,023 | 23,101 | 215 | 0.9 |
Miami-Fort Lauderdale-West Palm Beach, FL Metropolitan Statistical Area | ||||||
Total nonfarm | 2,725.1 | 2,733.0 | 2,749.2 | 2,741.5 | 16.4 | 0.6 |
Mining and logging | 0.7 | 0.8 | 0.8 | 0.8 | 0.1 | 14.3 |
Construction | 141.6 | 141.9 | 141.5 | 140.7 | -0.9 | -0.6 |
Manufacturing | 91.4 | 90.2 | 90.4 | 89.7 | -1.7 | -1.9 |
Trade, transportation, and utilities | 611.7 | 620.8 | 618.0 | 618.4 | 6.7 | 1.1 |
Information | 50.9 | 50.6 | 51.1 | 50.9 | 0.0 | 0.0 |
Financial activities | 188.0 | 188.7 | 190.3 | 190.8 | 2.8 | 1.5 |
Professional and business services | 446.7 | 450.7 | 455.3 | 453.8 | 7.1 | 1.6 |
Education and health services | 409.8 | 408.9 | 412.7 | 414.9 | 5.1 | 1.2 |
Leisure and hospitality | 341.8 | 337.4 | 344.8 | 334.9 | -6.9 | -2.0 |
Other services | 121.2 | 121.1 | 122.3 | 122.1 | 0.9 | 0.7 |
Government | 321.3 | 321.9 | 322.0 | 324.5 | 3.2 | 1.0 |
Miami-Miami Beach-Kendall, FL Metropolitan Division | ||||||
Total nonfarm | 1,218.6 | 1,219.2 | 1,227.4 | 1,230.9 | 12.3 | 1.0 |
Mining and logging | 0.5 | 0.6 | 0.6 | 0.6 | 0.1 | 20.0 |
Construction | 53.9 | 53.0 | 52.8 | 52.6 | -1.3 | -2.4 |
Manufacturing | 42.1 | 41.0 | 40.8 | 40.7 | -1.4 | -3.3 |
Trade, transportation, and utilities | 301.1 | 305.0 | 304.4 | 305.5 | 4.4 | 1.5 |
Information | 20.3 | 20.9 | 21.1 | 21.1 | 0.8 | 3.9 |
Financial activities | 81.7 | 80.9 | 81.6 | 81.7 | 0.0 | 0.0 |
Professional and business services | 180.5 | 180.6 | 183.1 | 183.4 | 2.9 | 1.6 |
Education and health services | 192.8 | 193.3 | 196.0 | 198.3 | 5.5 | 2.9 |
Leisure and hospitality | 148.1 | 147.1 | 150.1 | 148.1 | 0.0 | 0.0 |
Other services | 50.5 | 50.1 | 50.8 | 50.8 | 0.3 | 0.6 |
Government | 147.1 | 146.7 | 146.1 | 148.1 | 1.0 | 0.7 |
Fort Lauderdale-Pompano Beach-Deerfield Beach, FL Metropolitan Division | ||||||
Total nonfarm | 862.0 | 869.4 | 873.0 | 864.5 | 2.5 | 0.3 |
Construction | 49.1 | 49.4 | 48.8 | 48.3 | -0.8 | -1.6 |
Manufacturing | 28.8 | 28.5 | 28.7 | 28.2 | -0.6 | -2.1 |
Trade, transportation, and utilities | 193.8 | 200.2 | 198.5 | 198.3 | 4.5 | 2.3 |
Information | 20.1 | 19.7 | 19.9 | 19.7 | -0.4 | -2.0 |
Financial activities | 63.9 | 64.9 | 66.0 | 66.1 | 2.2 | 3.4 |
Professional and business services | 150.8 | 155.0 | 157.3 | 155.7 | 4.9 | 3.2 |
Education and health services | 111.3 | 110.9 | 110.7 | 111.8 | 0.5 | 0.4 |
Leisure and hospitality | 99.2 | 96.0 | 97.6 | 90.7 | -8.5 | -8.6 |
Other services | 37.6 | 37.7 | 37.9 | 37.9 | 0.3 | 0.8 |
Government | 107.3 | 107.0 | 107.5 | 107.7 | 0.4 | 0.4 |
West Palm Beach-Boca Raton-Delray Beach, FL Metropolitan Division | ||||||
Total nonfarm | 644.5 | 644.4 | 648.8 | 646.1 | 1.6 | 0.2 |
Construction | 38.6 | 39.5 | 39.9 | 39.8 | 1.2 | 3.1 |
Manufacturing | 20.5 | 20.7 | 20.9 | 20.8 | 0.3 | 1.5 |
Trade, transportation, and utilities | 116.8 | 115.6 | 115.1 | 114.6 | -2.2 | -1.9 |
Information | 10.5 | 10.0 | 10.1 | 10.1 | -0.4 | -3.8 |
Financial activities | 42.4 | 42.9 | 42.7 | 43.0 | 0.6 | 1.4 |
Professional and business services | 115.4 | 115.1 | 114.9 | 114.7 | -0.7 | -0.6 |
Education and health services | 105.7 | 104.7 | 106.0 | 104.8 | -0.9 | -0.9 |
Leisure and hospitality | 94.5 | 94.3 | 97.1 | 96.1 | 1.6 | 1.7 |
Other services | 33.1 | 33.3 | 33.6 | 33.4 | 0.3 | 0.9 |
Government | 66.9 | 68.2 | 68.4 | 68.7 | 1.8 | 2.7 |
| Area and Industry | Mar 2019 | Jan 2020 | Feb 2020 | Mar 2020(p) | Mar 2019 to Mar 2020(p) | |
|---|---|---|---|---|---|---|
| Net change | Percent change | |||||
Atlanta-Sandy Springs-Roswell, GA | ||||||
Total nonfarm | 2,828.3 | 2,862.6 | 2,866.1 | 2,871.7 | 43.4 | 1.5 |
Mining and logging | 1.5 | 1.5 | 1.5 | 1.6 | 0.1 | 6.7 |
Construction | 129.0 | 127.7 | 129.7 | 129.9 | 0.9 | 0.7 |
Manufacturing | 170.7 | 172.1 | 172.1 | 171.7 | 1.0 | 0.6 |
Trade, transportation, and utilities | 596.9 | 611.0 | 604.3 | 607.3 | 10.4 | 1.7 |
Information | 101.8 | 100.4 | 101.3 | 101.8 | 0.0 | 0.0 |
Financial activities | 175.3 | 177.6 | 178.6 | 178.2 | 2.9 | 1.7 |
Professional and business services | 543.9 | 546.9 | 548.6 | 549.0 | 5.1 | 0.9 |
Education and health services | 369.1 | 382.9 | 384.9 | 386.1 | 17.0 | 4.6 |
Leisure and hospitality | 300.7 | 300.5 | 302.1 | 301.7 | 1.0 | 0.3 |
Other services | 102.9 | 104.8 | 104.3 | 105.0 | 2.1 | 2.0 |
Government | 336.5 | 337.2 | 338.7 | 339.4 | 2.9 | 0.9 |
Boston-Cambridge-Nashua, MA-NH | ||||||
Total nonfarm | 2,772.1 | 2,768.8 | 2,781.8 | 2,772.7 | 0.6 | 0.0 |
Mining, logging, and construction | 114.2 | 114.7 | 113.6 | 113.9 | -0.3 | -0.3 |
Manufacturing | 187.7 | 185.8 | 186.6 | 186.9 | -0.8 | -0.4 |
Trade, transportation, and utilities | 418.7 | 427.4 | 420.2 | 417.7 | -1.0 | -0.2 |
Information | 79.5 | 82.9 | 82.9 | 82.9 | 3.4 | 4.3 |
Financial activities | 184.4 | 186.7 | 186.9 | 187.6 | 3.2 | 1.7 |
Professional and business services | 504.1 | 506.8 | 509.2 | 510.3 | 6.2 | 1.2 |
Education and health services | 596.2 | 588.7 | 598.8 | 596.3 | 0.1 | 0.0 |
Leisure and hospitality | 266.3 | 261.6 | 263.5 | 257.0 | -9.3 | -3.5 |
Other services | 102.8 | 102.0 | 101.1 | 101.0 | -1.8 | -1.8 |
Government | 318.2 | 312.2 | 319.0 | 319.1 | 0.9 | 0.3 |
Chicago-Naperville-Elgin, IL-IN-WI | ||||||
Total nonfarm | 4,694.5 | 4,686.3 | 4,691.6 | 4,673.9 | -20.6 | -0.4 |
Mining and logging | 1.7 | 1.6 | 1.6 | 1.8 | 0.1 | 5.9 |
Construction | 167.1 | 161.6 | 161.0 | 165.1 | -2.0 | -1.2 |
Manufacturing | 420.7 | 410.8 | 413.3 | 412.9 | -7.8 | -1.9 |
Trade, transportation, and utilities | 934.7 | 946.1 | 934.8 | 929.7 | -5.0 | -0.5 |
Information | 78.8 | 79.0 | 79.3 | 79.2 | 0.4 | 0.5 |
Financial activities | 314.2 | 317.6 | 317.8 | 316.4 | 2.2 | 0.7 |
Professional and business services | 815.0 | 811.8 | 815.3 | 803.5 | -11.5 | -1.4 |
Education and health services | 738.6 | 747.7 | 754.6 | 750.3 | 11.7 | 1.6 |
Leisure and hospitality | 474.9 | 469.9 | 466.7 | 463.2 | -11.7 | -2.5 |
Other services | 199.0 | 198.8 | 197.7 | 200.7 | 1.7 | 0.9 |
Government | 549.8 | 541.4 | 549.5 | 551.1 | 1.3 | 0.2 |
Dallas-Fort Worth-Arlington, TX | ||||||
Total nonfarm | 3,730.1 | 3,818.6 | 3,845.1 | 3,816.3 | 86.2 | 2.3 |
Mining, logging, and construction | 223.0 | 232.3 | 235.7 | 233.4 | 10.4 | 4.7 |
Manufacturing | 287.0 | 288.1 | 288.7 | 287.8 | 0.8 | 0.3 |
Trade, transportation, and utilities | 779.0 | 803.1 | 796.5 | 795.7 | 16.7 | 2.1 |
Information | 81.3 | 83.7 | 83.1 | 82.7 | 1.4 | 1.7 |
Financial activities | 313.7 | 323.8 | 326.6 | 326.4 | 12.7 | 4.0 |
Professional and business services | 624.4 | 644.3 | 653.1 | 650.6 | 26.2 | 4.2 |
Education and health services | 459.1 | 471.8 | 475.6 | 466.4 | 7.3 | 1.6 |
Leisure and hospitality | 389.5 | 397.8 | 402.1 | 391.0 | 1.5 | 0.4 |
Other services | 125.9 | 127.2 | 129.7 | 125.5 | -0.4 | -0.3 |
Government | 447.2 | 446.5 | 454.0 | 456.8 | 9.6 | 2.1 |
Houston-The Woodlands-Sugar Land, TX | ||||||
Total nonfarm | 3,136.7 | 3,165.0 | 3,203.9 | 3,195.7 | 59.0 | 1.9 |
Mining and logging | 80.5 | 76.5 | 75.2 | 76.1 | -4.4 | -5.5 |
Construction | 234.2 | 238.2 | 244.2 | 239.1 | 4.9 | 2.1 |
Manufacturing | 236.2 | 230.0 | 232.0 | 227.4 | -8.8 | -3.7 |
Trade, transportation, and utilities | 623.6 | 635.9 | 635.5 | 635.0 | 11.4 | 1.8 |
Information | 32.2 | 32.5 | 32.7 | 32.6 | 0.4 | 1.2 |
Financial activities | 164.3 | 168.1 | 167.5 | 167.2 | 2.9 | 1.8 |
Professional and business services | 499.7 | 509.5 | 514.9 | 515.8 | 16.1 | 3.2 |
Education and health services | 400.5 | 411.1 | 416.8 | 415.0 | 14.5 | 3.6 |
Leisure and hospitality | 330.9 | 329.7 | 339.6 | 337.3 | 6.4 | 1.9 |
Other services | 114.5 | 117.5 | 119.3 | 122.6 | 8.1 | 7.1 |
Government | 420.1 | 416.0 | 426.2 | 427.6 | 7.5 | 1.8 |
Los Angeles-Long Beach-Anaheim, CA | ||||||
Total nonfarm | 6,216.9 | 6,259.8 | 6,310.2 | 6,261.8 | 44.9 | 0.7 |
Mining and logging | 2.4 | 2.3 | 2.3 | 2.4 | 0.0 | 0.0 |
Construction | 251.9 | 256.0 | 258.0 | 252.3 | 0.4 | 0.2 |
Manufacturing | 500.6 | 494.4 | 495.3 | 492.7 | -7.9 | -1.6 |
Trade, transportation, and utilities | 1,099.6 | 1,118.6 | 1,110.8 | 1,101.9 | 2.3 | 0.2 |
Information | 251.7 | 253.2 | 266.8 | 264.4 | 12.7 | 5.0 |
Financial activities | 338.4 | 342.8 | 345.8 | 347.5 | 9.1 | 2.7 |
Professional and business services | 963.6 | 966.6 | 974.0 | 965.7 | 2.1 | 0.2 |
Education and health services | 1,070.6 | 1,090.5 | 1,100.2 | 1,102.9 | 32.3 | 3.0 |
Leisure and hospitality | 763.3 | 763.0 | 771.2 | 748.2 | -15.1 | -2.0 |
Other services | 208.1 | 209.0 | 210.9 | 204.4 | -3.7 | -1.8 |
Government | 766.7 | 763.4 | 774.9 | 779.4 | 12.7 | 1.7 |
Miami-Fort Lauderdale-West Palm Beach, FL | ||||||
Total nonfarm | 2,725.1 | 2,733.0 | 2,749.2 | 2,741.5 | 16.4 | 0.6 |
Mining and logging | 0.7 | 0.8 | 0.8 | 0.8 | 0.1 | 14.3 |
Construction | 141.6 | 141.9 | 141.5 | 140.7 | -0.9 | -0.6 |
Manufacturing | 91.4 | 90.2 | 90.4 | 89.7 | -1.7 | -1.9 |
Trade, transportation, and utilities | 611.7 | 620.8 | 618.0 | 618.4 | 6.7 | 1.1 |
Information | 50.9 | 50.6 | 51.1 | 50.9 | 0.0 | 0.0 |
Financial activities | 188.0 | 188.7 | 190.3 | 190.8 | 2.8 | 1.5 |
Professional and business services | 446.7 | 450.7 | 455.3 | 453.8 | 7.1 | 1.6 |
Education and health services | 409.8 | 408.9 | 412.7 | 414.9 | 5.1 | 1.2 |
Leisure and hospitality | 341.8 | 337.4 | 344.8 | 334.9 | -6.9 | -2.0 |
Other services | 121.2 | 121.1 | 122.3 | 122.1 | 0.9 | 0.7 |
Government | 321.3 | 321.9 | 322.0 | 324.5 | 3.2 | 1.0 |
New York-Newark-Jersey City, NY-NJ-PA | ||||||
Total nonfarm | 9,873.0 | 9,855.2 | 9,910.0 | 9,884.3 | 11.3 | 0.1 |
Mining, logging, and construction | 405.0 | 392.1 | 395.3 | 406.0 | 1.0 | 0.2 |
Manufacturing | 360.5 | 356.4 | 358.7 | 359.1 | -1.4 | -0.4 |
Trade, transportation, and utilities | 1,716.3 | 1,734.3 | 1,707.1 | 1,700.2 | -16.1 | -0.9 |
Information | 292.6 | 285.8 | 290.6 | 289.8 | -2.8 | -1.0 |
Financial activities | 782.6 | 780.0 | 783.5 | 776.0 | -6.6 | -0.8 |
Professional and business services | 1,580.2 | 1,588.1 | 1,598.3 | 1,595.9 | 15.7 | 1.0 |
Education and health services | 2,073.0 | 2,081.4 | 2,109.2 | 2,106.2 | 33.2 | 1.6 |
Leisure and hospitality | 906.2 | 894.5 | 898.1 | 887.7 | -18.5 | -2.0 |
Other services | 422.7 | 426.1 | 430.8 | 428.9 | 6.2 | 1.5 |
Government | 1,333.9 | 1,316.5 | 1,338.4 | 1,334.5 | 0.6 | 0.0 |
Philadelphia-Camden-Wilmington, PA-NJ-DE-MD | ||||||
Total nonfarm | 2,951.4 | 2,948.0 | 2,968.1 | 2,964.2 | 12.8 | 0.4 |
Mining, logging, and construction | 115.1 | 113.6 | 112.5 | 111.4 | -3.7 | -3.2 |
Manufacturing | 183.4 | 182.8 | 182.7 | 182.4 | -1.0 | -0.5 |
Trade, transportation, and utilities | 521.4 | 525.9 | 520.4 | 519.7 | -1.7 | -0.3 |
Information | 48.5 | 49.4 | 49.4 | 49.4 | 0.9 | 1.9 |
Financial activities | 216.3 | 216.6 | 217.6 | 217.5 | 1.2 | 0.6 |
Professional and business services | 462.5 | 468.4 | 470.5 | 471.2 | 8.7 | 1.9 |
Education and health services | 672.4 | 667.8 | 682.4 | 682.4 | 10.0 | 1.5 |
Leisure and hospitality | 267.8 | 264.0 | 265.9 | 262.3 | -5.5 | -2.1 |
Other services | 121.2 | 120.6 | 121.5 | 121.6 | 0.4 | 0.3 |
Government | 342.8 | 338.9 | 345.2 | 346.3 | 3.5 | 1.0 |
Phoenix-Mesa-Scottsdale, AZ | ||||||
Total nonfarm | 2,166.8 | 2,215.5 | 2,231.4 | 2,224.9 | 58.1 | 2.7 |
Mining and logging | 3.5 | 3.6 | 3.6 | 3.6 | 0.1 | 2.9 |
Construction | 131.5 | 135.2 | 137.6 | 136.4 | 4.9 | 3.7 |
Manufacturing | 131.5 | 133.9 | 133.9 | 134.8 | 3.3 | 2.5 |
Trade, transportation, and utilities | 404.3 | 417.3 | 416.5 | 418.1 | 13.8 | 3.4 |
Information | 40.0 | 40.7 | 40.8 | 40.4 | 0.4 | 1.0 |
Financial activities | 199.9 | 204.7 | 204.8 | 204.2 | 4.3 | 2.2 |
Professional and business services | 362.9 | 372.1 | 371.3 | 370.4 | 7.5 | 2.1 |
Education and health services | 334.9 | 349.2 | 353.3 | 352.0 | 17.1 | 5.1 |
Leisure and hospitality | 238.1 | 235.1 | 242.2 | 238.3 | 0.2 | 0.1 |
Other services | 70.3 | 70.5 | 70.3 | 71.4 | 1.1 | 1.6 |
Government | 249.9 | 253.2 | 257.1 | 255.3 | 5.4 | 2.2 |
San Francisco-Oakland-Hayward, CA | ||||||
Total nonfarm | 2,459.2 | 2,477.8 | 2,489.1 | 2,474.7 | 15.5 | 0.6 |
Mining and logging | 0.3 | 0.3 | 0.3 | 0.3 | 0.0 | 0.0 |
Construction | 123.7 | 123.2 | 123.6 | 123.6 | -0.1 | -0.1 |
Manufacturing | 145.3 | 144.2 | 143.6 | 144.1 | -1.2 | -0.8 |
Trade, transportation, and utilities | 370.3 | 373.7 | 369.5 | 366.6 | -3.7 | -1.0 |
Information | 124.2 | 129.8 | 130.4 | 129.9 | 5.7 | 4.6 |
Financial activities | 145.1 | 147.7 | 147.6 | 148.5 | 3.4 | 2.3 |
Professional and business services | 492.1 | 504.5 | 508.3 | 501.9 | 9.8 | 2.0 |
Education and health services | 364.5 | 366.4 | 371.6 | 372.4 | 7.9 | 2.2 |
Leisure and hospitality | 280.7 | 278.0 | 281.2 | 273.3 | -7.4 | -2.6 |
Other services | 87.7 | 87.8 | 88.1 | 86.9 | -0.8 | -0.9 |
Government | 325.3 | 322.2 | 324.9 | 327.2 | 1.9 | 0.6 |
Washington-Arlington-Alexandria, DC-VA-MD-WV | ||||||
Total nonfarm | 3,322.6 | 3,338.7 | 3,361.1 | 3,354.1 | 31.5 | 0.9 |
Mining, logging, and construction | 161.5 | 161.6 | 163.6 | 163.9 | 2.4 | 1.5 |
Manufacturing | 56.2 | 57.6 | 58.7 | 57.3 | 1.1 | 2.0 |
Trade, transportation, and utilities | 401.8 | 406.7 | 403.7 | 403.8 | 2.0 | 0.5 |
Information | 75.9 | 77.3 | 78.1 | 77.9 | 2.0 | 2.6 |
Financial activities | 159.1 | 162.8 | 162.3 | 162.5 | 3.4 | 2.1 |
Professional and business services | 766.8 | 780.1 | 784.3 | 781.9 | 15.1 | 2.0 |
Education and health services | 452.7 | 447.5 | 452.7 | 450.3 | -2.4 | -0.5 |
Leisure and hospitality | 329.4 | 326.4 | 330.3 | 326.5 | -2.9 | -0.9 |
Other services | 208.9 | 212.5 | 211.0 | 211.9 | 3.0 | 1.4 |
Government | 710.3 | 706.2 | 716.4 | 718.1 | 7.8 | 1.1 |
Last Modified Date: Wednesday, April 29, 2020