An official website of the United States government
An official website of the United States government
The .gov means it's official.
Federal government websites often end in .gov or .mil. Before sharing sensitive information,
make sure you're on a federal government site.
The site is secure.
The
https:// ensures that you are connecting to the official website and that any
information you provide is encrypted and transmitted securely.
20-259-ATL
Tuesday, February 25, 2020
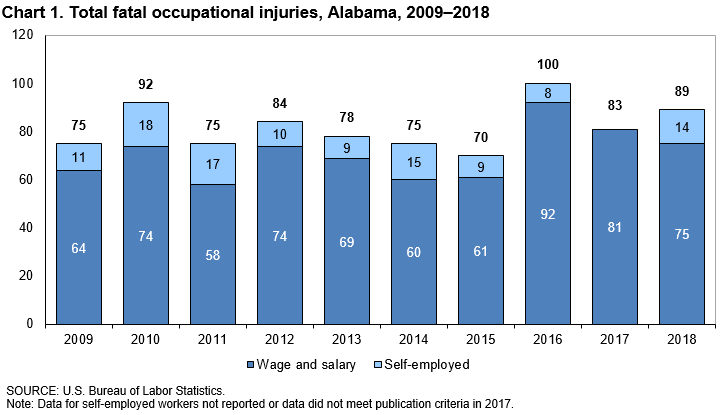
Fatal work injuries totaled 89 in 2018 for Alabama, the U.S. Bureau of Labor Statistics reported today. Regional Commissioner Janet S. Rankin noted that the number of work-related fatalities in Alabama was up from the previous year. Fatal occupational injuries in the state have ranged from a high of 155 in 1996 to a low of 70 in 2015. (See chart 1.)
Nationwide, a total of 5,250 fatal work injuries were recorded in 2018, up from the 5,147 fatal injuries in 2017, according to the results from the Census of Fatal Occupational Injuries (CFOI) program.
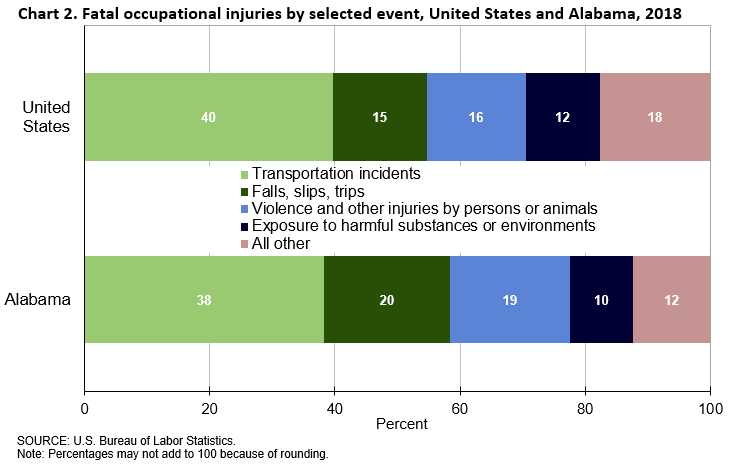
Type of incidentIn Alabama, transportation incidents resulted in 34 fatal work injuries, and falls, slips, and trips accounted for 18 fatalities. These two major categories accounted for 58 percent of all workplace fatalities in the state. (See table 1.) Worker deaths from transportation incidents were similar over the year and worker fatalities due to falls, slips, and trips were up from 13.
Violence and other injuries by persons or animals was the third-most frequent fatal work event with 17 fatalities, up from 5 in the prior year. Exposure to harmful substances or environments resulted in nine work-related deaths compared to seven in 2017.
Nationally, transportation incidents were the most frequent fatal workplace event in 2018, accounting for 40 percent of fatal work injuries. (See chart 2.) Violence and other injuries by persons or animals was the second-most common fatal event (16 percent), followed by falls, slips, and trips (15 percent) and contact with objects and equipment (15 percent).
IndustryThe private construction industry had the highest number of fatalities in Alabama with 22, up from 18 in the previous year. (See table 2.) Falls, slips, and trips resulted in 9 of the 22 fatalities in the industry. The specialty trade contractors sector accounted for 11 of the 22 workplace fatalities in the construction industry.
The private transportation and warehousing industry had 16 workplace fatalities, down from 19 in the previous year. The general freight trucking sector accounted for eight, or half of the fatal injuries in this industry.
OccupationThe transportation and material moving occupational group had the highest number of workplace fatalities with 29. (See table 3.) Heavy and tractor-trailer truck drivers accounted for 17 of the 29 fatalities among transportation and material moving workers. The construction and extraction occupational group had the second highest number of workplace fatalities with 23. Construction trades workers suffered 19 of the work-related deaths with the construction and extraction group.
Additional highlightsMen accounted for 93 percent of the work-related fatalities in Alabama, similar to the 92-percent national share. (See table 4.) Transportation incidents made up 41 percent of the fatalities for men in Alabama.
White non-Hispanics accounted for 64 percent of those who died from a workplace injury, similar to the 65-percent national share.
Workers 25-54 years old accounted for 63 percent of the state’s work-related fatalities in 2018, compared to 58 percent of on-the-job fatalities nationally.
Of the 89 fatal work injuries in Alabama, 84 percent worked for wages and salaries; the remainder were self-employed. The most frequent fatal event for wage and salary workers was transportation incidents; violence and other injuries by persons or animals was the most frequent fatal event for self-employed workers.
Background of the program. The Census of Fatal Occupational Injuries (CFOI), part of the Bureau of Labor Statistics (BLS) Occupational Safety and Health Statistics (OSHS) program, is a count of all fatal work injuries occurring in the U.S. during the calendar year. The CFOI uses a variety of state, federal, and independent data sources to identify, verify, and describe fatal work injuries. This ensures counts are as complete and accurate as possible. For the 2018 national data, over 24,800 unique source documents were reviewed as part of the data collection process. For technical information and definitions for the CFOI, see the BLS Handbook of Methods on the BLS website at www.bls.gov/opub/hom/cfoi/home.htm.
Federal/State agency coverage. The CFOI includes data for all fatal work injuries, some of which may be outside the scope of other agencies or regulatory coverage. Comparisons between CFOI counts and those released by other agencies should account for the different coverage requirements and definitions used by each agency. For more information on the scope of CFOI, see www.bls.gov/iif/cfoiscope.htm and www.bls.gov/opub/hom/cfoi/concepts.htm.
Acknowledgments. BLS thanks the Alabama Department of Labor for their efforts in collecting accurate, comprehensive, and useful data on fatal work injuries. BLS also appreciates the efforts of all federal, state, local, and private sector entities that provided source documents used to identify fatal work injuries. Among these agencies are the Occupational Safety and Health Administration; the National Transportation Safety Board; the U.S. Coast Guard; the Mine Safety and Health Administration; the Office of Workers’ Compensation Programs (Federal Employees' Compensation and Longshore and Harbor Workers' Compensation divisions); the Federal Railroad Administration; the National Highway Traffic Safety Administration; state vital statistics registrars, coroners, and medical examiners; state departments of health, labor, and industrial relations and workers' compensation agencies; state and local police departments; and state farm bureaus.
Information in this release will be made available to sensory impaired individuals upon request. Voice phone: (202) 691-5200; Federal Relay Service: (800) 877-8339.
| Event or exposure (1) | 2017 | 2018 | |
|---|---|---|---|
| Number | Number | Percent | |
Total | 83 | 89 | 100 |
Violence and other injuries by persons or animals | 5 | 17 | 19 |
Intentional injury by person | 4 | 16 | 18 |
Intentional injury by other person | 3 | 12 | 13 |
Shooting by other person--intentional | 2 | 9 | 10 |
Self-inflicted injury--intentional | -- | 4 | 4 |
Transportation incidents | 34 | 34 | 38 |
Roadway incidents involving motorized land vehicle | 24 | 22 | 25 |
Roadway collision with other vehicle | 9 | 6 | 7 |
Roadway collision with object other than vehicle | 12 | 11 | 12 |
Vehicle struck object or animal on side of roadway | 12 | 11 | 12 |
Roadway noncollision incident | 3 | 5 | 6 |
Nonroadway incident involving motorized land vehicles | -- | 5 | 6 |
Fires and explosions | -- | 3 | 3 |
Falls, slips, trips | 13 | 18 | 20 |
Falls to lower level | 11 | 16 | 18 |
Exposure to harmful substances or environments | 7 | 9 | 10 |
Exposure to other harmful substances | 4 | 6 | 7 |
Contact with objects and equipment | 21 | 7 | 8 |
Struck by object or equipment | 12 | 6 | 7 |
Overexertion and bodily reaction | -- | -- | -- |
Footnotes: | |||
NOTE: Data for all years are final. Totals for major categories may include subcategories not shown separately. Percentages may not add to totals because of rounding. CFOI fatality counts exclude illness-related deaths unless precipitated by an injury event. Dashes indicate no data reported or data that do not meet publication criteria. | |||
| Industry (1) | 2017 | 2018 | |
|---|---|---|---|
| Number | Number | Percent | |
Total | 83 | 89 | 100 |
Private industry | 78 | 83 | 93 |
Goods producing | 33 | 40 | 45 |
Natural resources and mining | 7 | 7 | 8 |
Agriculture, forestry, fishing and hunting | 7 | 4 | 4 |
Mining (2) | -- | 3 | 3 |
Construction | 18 | 22 | 25 |
Construction | 18 | 22 | 25 |
Construction of buildings | 3 | 8 | 9 |
Specialty trade contractors | 11 | 11 | 12 |
Manufacturing | 8 | 11 | 12 |
Service providing | 45 | 43 | 48 |
Trade, transportation, and utilities | 26 | 28 | 31 |
Wholesale trade | 3 | 5 | 6 |
Retail trade | -- | 7 | 8 |
Transportation and warehousing | 19 | 16 | 18 |
Truck transportation | 16 | 12 | 13 |
General freight trucking | 12 | 8 | 9 |
Specialized freight trucking | 4 | 4 | 4 |
Information | -- | -- | -- |
Financial activities | -- | -- | -- |
Professional and business services | 10 | 7 | 8 |
Educational and health services | -- | 1 | 1 |
Health care and social assistance | 1 | 1 | 1 |
Leisure and hospitality | -- | 5 | 6 |
Arts, entertainment, and recreation | -- | 1 | 1 |
Accommodation and food services | -- | 4 | 4 |
Other services, except public administration | -- | 2 | 2 |
Government (3) | 5 | 6 | 7 |
Federal government | 1 | -- | -- |
State government | 1 | -- | -- |
Local government | 3 | 5 | 6 |
Footnotes: | |||
NOTE: Data for all years are final. Totals for major categories may include subcategories not shown separately. Percentages may not add to totals because of rounding. CFOI fatality counts exclude illness-related deaths unless precipitated by an injury event. Dashes indicate no data reported or data that do not meet publication criteria. | |||
| Occupation (1) | 2017 | 2018 | |
|---|---|---|---|
| Number | Number | Percent | |
Total | 83 | 89 | 100 |
Management occupations | -- | 6 | 7 |
Business and financial operations occupations | -- | -- | -- |
Computer and mathematical occupations | -- | -- | -- |
Architecture and engineering occupations | 2 | -- | -- |
Life, physical, and social science occupations | -- | -- | -- |
Community and social services occupations | -- | -- | -- |
Legal occupations | -- | -- | -- |
Education, training, and library occupations | -- | -- | -- |
Arts, design, entertainment, sports, and media occupations | -- | -- | -- |
Healthcare practitioners and technical occupations | -- | -- | -- |
Healthcare support occupations | -- | -- | -- |
Protective service occupations | 5 | 2 | 2 |
Law enforcement workers | -- | 2 | 2 |
Police officers | -- | 2 | 2 |
Food preparation and serving related occupations | -- | -- | -- |
Building and grounds cleaning and maintenance occupations | 3 | 7 | 8 |
Personal care and service occupations | 1 | 1 | 1 |
Entertainment attendants and related workers | -- | 1 | 1 |
Sales and related occupations | -- | 6 | 7 |
Supervisors of sales workers | -- | 4 | 4 |
Retail sales workers | -- | 2 | 2 |
Office and administrative support occupations | -- | -- | -- |
Farming, fishing, and forestry occupations | 4 | -- | -- |
Construction and extraction occupations | 18 | 23 | 26 |
Supervisors of construction and extraction workers | 1 | 3 | 3 |
Construction trades workers | 15 | 19 | 21 |
Carpenters | -- | 3 | 3 |
Construction laborers | 5 | 9 | 10 |
Electricians | 3 | 4 | 4 |
Installation, maintenance, and repair occupations | 12 | 7 | 8 |
Production occupations | 5 | 4 | 4 |
Transportation and material moving occupations | 24 | 29 | 33 |
Motor vehicle operators | 20 | 20 | 22 |
Driver/sales workers and truck drivers | 20 | 18 | 20 |
Heavy and tractor-trailer truck drivers | 19 | 17 | 19 |
Material moving workers | 3 | 5 | 6 |
Military specific occupations (2) | -- | -- | -- |
Footnotes: | |||
NOTE: Totals for major categories may include subcategories not shown separately. Percentages may not add to totals because of rounding. CFOI fatality counts exclude illness-related deaths unless precipitated by an injury event. Dashes indicate no data reported or data that do not meet publication criteria. | |||
| Worker characteristics | 2017 | 2018 | |
|---|---|---|---|
| Number | Number | Percent | |
Total | 83 | 89 | 100 |
Employee status | |||
Wage and salary workers (1) | 81 | 75 | 84 |
Self-employed (2) | -- | 14 | 16 |
Gender | |||
Men | 80 | 83 | 93 |
Women | 3 | 6 | 7 |
Age (3) | |||
20 to 24 years | 4 | 5 | 6 |
25 to 34 years | 15 | 18 | 20 |
35 to 44 years | 16 | 20 | 22 |
45 to 54 years | 20 | 18 | 20 |
55 to 64 years | 20 | 16 | 18 |
65 years and over | 7 | 11 | 12 |
Race or ethnic origin (4) | |||
White, non-Hispanic | 54 | 57 | 64 |
Black or African-American, non-Hispanic | 20 | 24 | 27 |
Hispanic or Latino | 8 | 4 | 4 |
Asian, non-Hispanic | -- | 4 | 4 |
Footnotes: | |||
NOTE: Data for all years are final. Totals for major categories may include subcategories not shown separately. Percentages may not add to totals because of rounding. CFOI fatality counts exclude illness-related deaths unless precipitated by an injury event. Dashes indicate no data reported or data that do not meet publication criteria. | |||
Last Modified Date: Tuesday, February 25, 2020