An official website of the United States government
An official website of the United States government
The .gov means it's official.
Federal government websites often end in .gov or .mil. Before sharing sensitive information,
make sure you're on a federal government site.
The site is secure.
The
https:// ensures that you are connecting to the official website and that any
information you provide is encrypted and transmitted securely.
24-1939-ATL
Wednesday, September 18, 2024
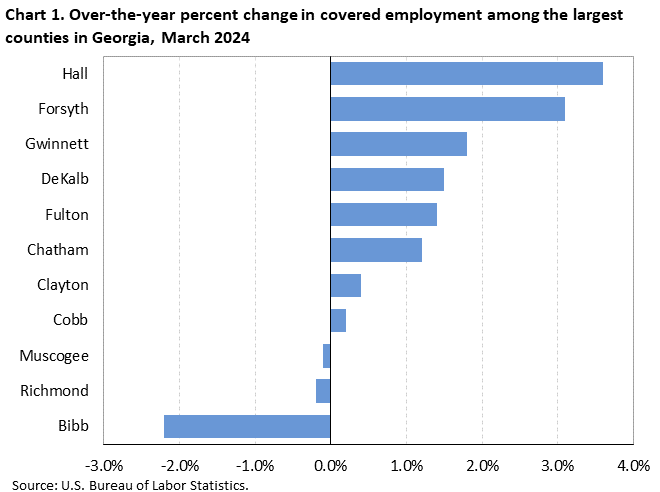
Employment rose in 8 of the 11 largest counties in Georgia from March 2023 to March 2024, the U.S. Bureau of Labor Statistics reported today. (Large counties are those with annual average employment levels of 75,000 or more in 2023.) Regional Commissioner Victoria G. Lee noted that Hall County and Forsyth County had the largest over-the-year increases in employment at 3.6 percent and 3.1 percent, respectively. (See chart 1 and table 1.)
National employment increased 1.3 percent over the year, with 300 of the 369 largest U.S. counties reporting gains. Monterey, CA, and St. Johns, FL, had the largest over-the-year increases in employment, with gains of 4.8 percent each. Elkhart, IN, had the largest over-the-year percentage decrease in employment (-4.9 percent).
Among the 11 largest counties in Georgia, employment was highest in Fulton County (942,900) in March 2024. Within Fulton County’s private industry, professional, scientific, and technical services accounted for the largest employment. Together, the 11 largest Georgia counties accounted for 57.4 percent of total employment within the state. Nationwide, the 369 largest counties made up 73.3 percent of total covered U.S. employment.
Employment and wage levels (but not over-the-year changes) are also available for the 148 counties in Georgia with employment below 75,000. Wage levels in 147 of the 148 smaller counties were below the national average of $1,527 in the first quarter of 2024. (See table 2.)
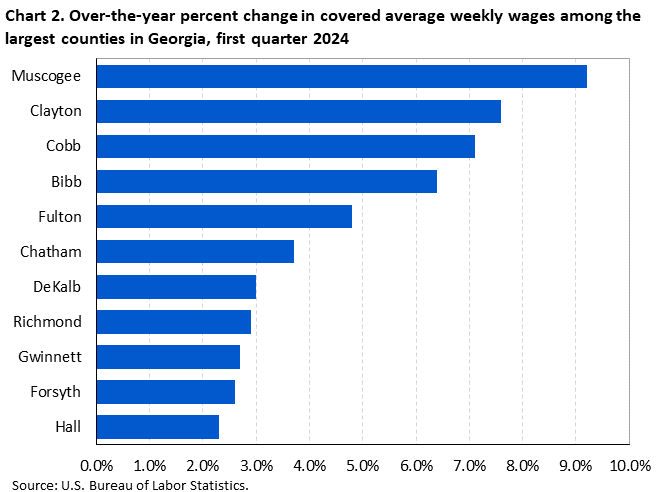
Large county wage changesAll 11 large Georgia counties reported average weekly wage gains from the first quarter of 2023 to the first quarter of 2024. (See chart 2.) Muscogee County had the largest gain (+9.2 percent), followed by Clayton County (+7.6 percent) and Cobb County (+7.1 percent). Over-the-year wage gains among Georgia’s other eight large counties ranged from 6.4 percent to 2.3 percent.
Nationwide, wages increased by 4.2 percent over the year. Among the 369 largest counties in the United States, 357 had over-the-year wage increases. Santa Clara, CA, had the largest percentage wage increase (+14.6 percent). Saginaw, MI, had the largest over-the-year percentage decrease (-3.4 percent).
Large county average weekly wagesWeekly wages in 3 of the 11 largest counties in Georgia were above the national average of $1,527 in the first quarter of 2024. Fulton county reported the highest average weekly wage ($2,203, 14th), followed by Clayton County ($1,708, 50th) and Cobb County ($1,606, 66th).
Among the largest U.S. counties, 85 reported average weekly wages above the U.S. average in the first quarter of 2024. San Mateo, CA, had the highest average weekly wage ($4,385). Average weekly wages were below the national average in the remaining 284 counties. Hidalgo, TX, had the lowest average weekly wage ($807).
Smaller county average weekly wagesAmong the 148 smaller counties in Georgia—those with employment below 75,000—Burke ($1,972) reported an average weekly wage above the national average. Glascock County ($677) reported the lowest average weekly wage in the state.
When all 159 counties in Georgia were considered, 19 reported average weekly wages of less than $800, 54 registered wages from $800 to $899, 39 had wages from $900 to $999, 24 had wages from $1,000 to $1,099, and 23 had average weekly wages of $1,100 or higher. (See map 1.)
QCEW data for states have been included in this release in table 3. For additional information about quarterly employment and wages data, please read the Technical Note for the County Employment and Wages News Release or visit the Quarterly Census of Employment and Wages website.
Employment and Wages Annual Averages Online features comprehensive information by detailed industry on establishments, employment, and wages for the nation and all states. This publication is typically published in September of the following year of the reference period or shortly after the QCEW first quarter full data update.
Information in this release will be made available to individuals with sensory impairments upon request. Voice phone: (202) 691-5200; Telecommunications Relay Service: 7-1-1.
The County Employment and Wages release for the second quarter 2024 is scheduled to be released on Wednesday, November 20, 2024. The County Employment and Wages full data update for the second quarter 2024 is scheduled to be released on Thursday, December 5, 2024.
Counties with annual average employment of 75,000 or more in 2023 are included in this release and will be included in future 2024 releases. Seven counties have been added to the nationwide publication tables: Martin, FL; Sarpy, NE; Doña Ana, NM; Kent, RI; Ector, TX; Gregg, TX; and Racine, WI. No counties were dropped from the publication tables.
New Metropolitan Statistical Area (MSA) definitions, and those for other types of Core Based Statistical Areas (CBSA), were announced in July 2023. With the full data update for first quarter 2024 on September 4, 2024, QCEW data reflect the new definitions. Data based on the new area definitions are available in the BLS online database. Historical data will not be re-tabulated to reflect the new definitions. The announcement regarding new metropolitan statistical area delineations for 2024 provides more information regarding the new area definitions.
| Area | Establishments, first quarter (thousands) | Employment | Average weekly wage (1) | |||||
|---|---|---|---|---|---|---|---|---|
| March 2024 (thousands) | Percent change, March 2023–24 (2) | National ranking by percent change (3) | First quarter 2024 ($) | National ranking by level (3) | Percent change, first quarter 2023–24 (2) | National ranking by percent change (3) | ||
United States (4) | 12,169.0 | 153,585.6 | 1.3 | -- | 1,527 | -- | 4.2 | -- |
Georgia | 401.4 | 4,843.9 | 1.3 | -- | 1,441 | 17 | 4.7 | 12 |
Bibb | 4.9 | 78.4 | -2.2 | 367 | 1,063 | 339 | 6.4 | 22 |
Chatham | 11.0 | 169.7 | 1.2 | 173 | 1,189 | 262 | 3.7 | 183 |
Clayton | 5.5 | 129.7 | 0.4 | 272 | 1,708 | 50 | 7.6 | 9 |
Cobb | 28.9 | 380.6 | 0.2 | 282 | 1,606 | 66 | 7.1 | 11 |
DeKalb | 24.5 | 310.7 | 1.5 | 139 | 1,493 | 93 | 3.0 | 252 |
Forsyth | 8.8 | 87.8 | 3.1 | 18 | 1,235 | 226 | 2.6 | 288 |
Fulton | 71.7 | 942.9 | 1.4 | 151 | 2,203 | 14 | 4.8 | 83 |
Gwinnett | 35.0 | 384.0 | 1.8 | 98 | 1,310 | 182 | 2.7 | 277 |
Hall | 6.1 | 101.3 | 3.6 | 9 | 1,216 | 241 | 2.3 | 307 |
Muscogee | 5.6 | 89.3 | -0.1 | 308 | 1,170 | 278 | 9.2 | 4 |
Richmond | 5.3 | 104.0 | -0.2 | 319 | 1,127 | 308 | 2.9 | 259 |
Footnotes: | ||||||||
Note: Data are preliminary. Covered employment and wages includes workers covered by Unemployment Insurance (UI) and Unemployment Compensation for Federal Employees (UCFE) programs. | ||||||||
| Area | Establishments | Employment March 2024 | Average weekly wage ($) (1) |
|---|---|---|---|
United States (2) | 12,169,000 | 153,585,576 | 1,527 |
Georgia | 401,358 | 4,843,928 | 1,441 |
Appling | 516 | 7,290 | 1,422 |
Atkinson | 130 | 2,258 | 953 |
Bacon | 301 | 3,692 | 890 |
Baker | 69 | 411 | 868 |
Baldwin | 1,017 | 15,953 | 836 |
Banks | 388 | 4,878 | 845 |
Barrow | 1,756 | 23,598 | 1,022 |
Bartow | 3,049 | 46,842 | 1,099 |
Ben Hill | 383 | 5,760 | 906 |
Berrien | 334 | 3,815 | 820 |
Bibb | 4,926 | 78,438 | 1,063 |
Bleckley | 232 | 3,076 | 840 |
Brantley | 268 | 2,558 | 862 |
Brooks | 321 | 3,326 | 877 |
Bryan | 1,089 | 11,186 | 969 |
Bulloch | 1,987 | 28,112 | 905 |
Burke | 507 | 7,532 | 1,972 |
Butts | 574 | 8,411 | 925 |
Calhoun | 131 | 1,187 | 827 |
Camden | 1,220 | 15,849 | 1,088 |
Candler | 286 | 2,892 | 867 |
Carroll | 2,833 | 45,089 | 1,156 |
Catoosa | 1,266 | 16,387 | 876 |
Charlton | 193 | 2,067 | 895 |
Chatham | 11,031 | 169,692 | 1,189 |
Chattahoochee | 138 | 2,044 | 978 |
Chattooga | 390 | 4,961 | 838 |
Cherokee | 8,081 | 73,698 | 1,028 |
Clarke | 4,053 | 73,728 | 1,107 |
Clay | 74 | 607 | 682 |
Clayton | 5,510 | 129,653 | 1,708 |
Clinch | 184 | 2,438 | 866 |
Cobb | 28,949 | 380,638 | 1,606 |
Coffee | 1,048 | 17,917 | 932 |
Colquitt | 1,210 | 15,507 | 899 |
Columbia | 3,579 | 39,831 | 936 |
Cook | 422 | 4,741 | 824 |
Coweta | 3,764 | 48,885 | 1,032 |
Crawford | 157 | 1,261 | 784 |
Crisp | 677 | 8,939 | 935 |
Dade | 313 | 4,436 | 879 |
Dawson | 1,056 | 11,078 | 851 |
Decatur | 811 | 8,706 | 890 |
De Kalb | 24,455 | 310,654 | 1,493 |
Dodge | 387 | 5,052 | 778 |
Dooly | 241 | 2,448 | 941 |
Dougherty | 2,712 | 45,939 | 1,054 |
Douglas | 3,636 | 51,553 | 1,125 |
Early | 282 | 3,619 | 1,060 |
Echols | 64 | 655 | 901 |
Effingham | 1,190 | 14,089 | 1,036 |
Elbert | 560 | 6,164 | 875 |
Emanuel | 483 | 7,141 | 874 |
Evans | 294 | 4,448 | 782 |
Fannin | 839 | 7,274 | 849 |
Fayette | 4,952 | 49,135 | 1,150 |
Floyd | 2,517 | 44,224 | 968 |
Forsyth | 8,785 | 87,814 | 1,235 |
Franklin | 612 | 8,067 | 892 |
Fulton | 71,662 | 942,905 | 2,203 |
Gilmer | 833 | 8,029 | 873 |
Glascock | 51 | 402 | 677 |
Glynn | 3,434 | 41,973 | 1,023 |
Gordon | 1,264 | 24,775 | 1,171 |
Grady | 600 | 5,952 | 868 |
Greene | 631 | 7,043 | 1,008 |
Gwinnett | 34,969 | 384,002 | 1,310 |
Habersham | 1,147 | 14,866 | 971 |
Hall | 6,069 | 101,314 | 1,216 |
Hancock | 106 | 1,455 | 873 |
Haralson | 630 | 7,756 | 989 |
Harris | 596 | 6,556 | 885 |
Hart | 601 | 7,869 | 946 |
Heard | 176 | 2,152 | 1,260 |
Henry | 5,730 | 75,135 | 1,012 |
Houston | 3,557 | 65,758 | 1,156 |
Irwin | 167 | 2,100 | 828 |
Jackson | 2,154 | 44,604 | 958 |
Jasper | 266 | 2,414 | 772 |
Jeff Davis | 286 | 4,261 | 902 |
Jefferson | 407 | 4,987 | 929 |
Jenkins | 134 | 1,671 | 872 |
Johnson | 148 | 1,340 | 780 |
Jones | 433 | 4,162 | 879 |
Lamar | 357 | 4,515 | 949 |
Lanier | 133 | 1,415 | 824 |
Laurens | 1,269 | 19,672 | 1,010 |
Lee | 625 | 7,402 | 908 |
Liberty | 1,143 | 19,666 | 975 |
Lincoln | 194 | 1,451 | 782 |
Long | 145 | 1,384 | 781 |
Lowndes | 3,430 | 49,885 | 943 |
Lumpkin | 725 | 8,410 | 917 |
McDuffie | 511 | 7,067 | 856 |
McIntosh | 257 | 1,793 | 807 |
Macon | 240 | 2,934 | 1,036 |
Madison | 511 | 3,909 | 843 |
Marion | 130 | 1,315 | 744 |
Meriwether | 436 | 4,761 | 944 |
Miller | 173 | 1,898 | 911 |
Mitchell | 495 | 6,663 | 826 |
Monroe | 692 | 8,031 | 1,114 |
Montgomery | 151 | 1,445 | 748 |
Morgan | 691 | 8,750 | 1,036 |
Murray | 563 | 8,328 | 868 |
Muscogee | 5,550 | 89,342 | 1,170 |
Newton | 2,272 | 27,664 | 1,047 |
Oconee | 1,608 | 15,646 | 981 |
Oglethorpe | 248 | 2,072 | 860 |
Paulding | 3,021 | 30,169 | 904 |
Peach | 681 | 10,686 | 949 |
Pickens | 949 | 9,062 | 1,102 |
Pierce | 457 | 4,544 | 871 |
Pike | 383 | 3,279 | 895 |
Polk | 831 | 11,153 | 935 |
Pulaski | 236 | 2,785 | 891 |
Putnam | 634 | 6,293 | 900 |
Quitman | 45 | 309 | 768 |
Rabun | 628 | 5,642 | 793 |
Randolph | 176 | 1,760 | 794 |
Richmond | 5,341 | 104,029 | 1,127 |
Rockdale | 2,758 | 35,980 | 1,184 |
Schley | 79 | 1,175 | 838 |
Screven | 303 | 2,916 | 850 |
Seminole | 240 | 2,535 | 737 |
Spalding | 1,560 | 23,686 | 959 |
Stephens | 651 | 8,841 | 1,015 |
Stewart | 95 | 1,656 | 1,015 |
Sumter | 760 | 9,941 | 869 |
Talbot | 99 | 816 | 893 |
Taliaferro | 29 | 219 | 707 |
Tattnall | 429 | 5,804 | 841 |
Taylor | 183 | 1,851 | 983 |
Telfair | 227 | 2,050 | 785 |
Terrell | 238 | 2,102 | 846 |
Thomas | 1,774 | 21,109 | 1,075 |
Tift | 1,259 | 22,168 | 969 |
Toombs | 784 | 12,449 | 878 |
Towns | 377 | 3,389 | 861 |
Treutlen | 112 | 1,105 | 927 |
Troup | 1,909 | 41,787 | 1,052 |
Turner | 213 | 1,950 | 837 |
Twiggs | 123 | 1,629 | 847 |
Union | 777 | 7,924 | 901 |
Upson | 547 | 7,315 | 953 |
Walker | 935 | 15,086 | 872 |
Walton | 2,412 | 26,340 | 1,018 |
Ware | 1,039 | 14,615 | 891 |
Warren | 109 | 1,650 | 1,022 |
Washington | 444 | 6,488 | 920 |
Wayne | 688 | 8,832 | 973 |
Webster | 45 | 507 | 1,070 |
Wheeler | 85 | 1,081 | 874 |
White | 882 | 9,408 | 775 |
Whitfield | 2,808 | 58,185 | 1,079 |
Wilcox | 116 | 1,151 | 767 |
Wilkes | 254 | 2,786 | 917 |
Wilkinson | 182 | 2,738 | 1,117 |
Worth | 383 | 3,018 | 807 |
Footnotes: | |||
Note: Data are preliminary. Covered employment and wages includes workers covered by Unemployment Insurance (UI) and Unemployment Compensation for Federal Employees (UCFE) programs. | |||
| State | Establishments, first quarter (thousands) | Employment | Average weekly wage (1) | ||||
|---|---|---|---|---|---|---|---|
| March 2024 (thousands) | Percent change, March 2023–24 | First quarter 2024 ($) | National ranking by level | Percent change, first quarter 2023–24 | National ranking by percent change | ||
United States (2) | 12,169.0 | 153,585.6 | 1.3 | 1,527 | -- | 4.2 | -- |
Alabama | 160.7 | 2,091.9 | 1.6 | 1,201 | 37 | 3.3 | 44 |
Alaska | 25.2 | 318.1 | 2.2 | 1,374 | 22 | 5.6 | 2 |
Arizona | 229.4 | 3,257.0 | 2.9 | 1,372 | 23 | 3.1 | 46 |
Arkansas | 104.6 | 1,292.8 | 1.4 | 1,171 | 44 | 4.0 | 24 |
California | 1,835.8 | 18,053.0 | 1.5 | 1,833 | 5 | 5.5 | 3 |
Colorado | 264.4 | 2,851.4 | 0.3 | 1,613 | 8 | 3.5 | 38 |
Connecticut | 149.5 | 1,661.9 | 1.0 | 1,908 | 4 | 4.4 | 18 |
Delaware | 43.0 | 469.3 | 1.8 | 1,484 | 15 | 3.7 | 33 |
District of Columbia | 52.3 | 759.8 | 0.7 | 2,434 | 1 | 4.0 | 24 |
Florida | 898.9 | 9,863.2 | 2.1 | 1,384 | 20 | 4.2 | 20 |
Georgia | 401.4 | 4,843.9 | 1.3 | 1,441 | 17 | 4.7 | 12 |
Hawaii | 58.6 | 638.8 | 0.6 | 1,278 | 29 | 4.8 | 10 |
Idaho | 98.5 | 835.8 | 1.9 | 1,130 | 47 | 4.1 | 22 |
Illinois | 410.2 | 5,966.9 | 0.3 | 1,608 | 9 | 2.7 | 50 |
Indiana | 195.2 | 3,148.3 | 0.6 | 1,271 | 30 | 5.7 | 1 |
Iowa | 110.8 | 1,543.1 | 0.9 | 1,214 | 36 | 3.2 | 45 |
Kansas | 100.7 | 1,415.7 | 0.7 | 1,199 | 38 | 3.8 | 32 |
Kentucky | 155.8 | 1,987.2 | 1.4 | 1,178 | 42 | 3.4 | 43 |
Louisiana | 154.5 | 1,904.2 | 0.7 | 1,195 | 39 | 4.0 | 24 |
Maine | 65.0 | 626.4 | 1.3 | 1,249 | 34 | 5.2 | 4 |
Maryland | 198.4 | 2,690.0 | 0.8 | 1,591 | 10 | 4.5 | 16 |
Massachusetts | 287.4 | 3,599.0 | 0.5 | 2,015 | 3 | 4.9 | 8 |
Michigan | 338.6 | 4,351.0 | 1.0 | 1,352 | 24 | 3.5 | 38 |
Minnesota | 210.5 | 2,850.4 | 0.2 | 1,519 | 14 | 4.0 | 24 |
Mississippi | 89.5 | 1,157.2 | 0.2 | 980 | 51 | 3.6 | 36 |
Missouri | 257.5 | 2,882.5 | 1.0 | 1,269 | 31 | 3.7 | 33 |
Montana | 61.8 | 503.1 | 1.2 | 1,126 | 49 | 4.4 | 18 |
Nebraska | 76.0 | 1,007.3 | 1.5 | 1,195 | 39 | 2.6 | 51 |
Nevada | 112.1 | 1,534.4 | 2.4 | 1,304 | 28 | 4.7 | 12 |
New Hampshire | 65.9 | 680.0 | 1.1 | 1,531 | 13 | 4.7 | 12 |
New Jersey | 335.6 | 4,218.8 | 1.3 | 1,761 | 7 | 3.5 | 38 |
New Mexico | 67.9 | 861.5 | 1.6 | 1,159 | 45 | 4.8 | 10 |
New York | 709.5 | 9,537.4 | 1.8 | 2,089 | 2 | 3.5 | 38 |
North Carolina | 395.7 | 4,871.0 | 1.8 | 1,401 | 18 | 4.0 | 24 |
North Dakota | 36.1 | 419.9 | 1.6 | 1,261 | 33 | 3.7 | 33 |
Ohio | 337.0 | 5,452.8 | 0.8 | 1,315 | 25 | 4.0 | 24 |
Oklahoma | 132.9 | 1,690.0 | 1.7 | 1,152 | 46 | 4.0 | 24 |
Oregon | 198.9 | 1,971.9 | -0.3 | 1,377 | 21 | 3.1 | 46 |
Pennsylvania | 392.0 | 5,967.0 | 1.1 | 1,449 | 16 | 3.0 | 48 |
Rhode Island | 48.5 | 483.9 | 1.1 | 1,387 | 19 | 4.0 | 24 |
South Carolina | 184.6 | 2,265.9 | 2.1 | 1,194 | 41 | 4.9 | 8 |
South Dakota | 39.9 | 449.7 | 2.0 | 1,129 | 48 | 4.2 | 20 |
Tennessee | 230.1 | 3,261.3 | 1.9 | 1,311 | 27 | 3.5 | 38 |
Texas | 839.6 | 13,826.9 | 1.7 | 1,540 | 12 | 4.1 | 22 |
Utah | 135.7 | 1,699.6 | 1.9 | 1,313 | 26 | 5.2 | 4 |
Vermont | 32.8 | 307.3 | 0.6 | 1,232 | 35 | 3.6 | 36 |
Virginia | 318.3 | 4,072.6 | 1.6 | 1,554 | 11 | 5.2 | 4 |
Washington | 224.3 | 3,577.3 | 1.3 | 1,815 | 6 | 5.1 | 7 |
West Virginia | 60.8 | 694.0 | 1.6 | 1,110 | 50 | 4.6 | 15 |
Wisconsin | 206.0 | 2,899.1 | 0.6 | 1,263 | 32 | 4.5 | 16 |
Wyoming | 30.8 | 274.1 | 1.1 | 1,177 | 43 | 2.8 | 49 |
Puerto Rico | 54.7 | 952.8 | 1.6 | 677 | (3) | 4.8 | (3) |
Virgin Islands | 3.9 | 36.5 | 0.9 | 996 | (3) | 1.6 | (3) |
Footnotes: | |||||||
Note: Data are preliminary. Covered employment and wages includes workers covered by Unemployment Insurance (UI) and Unemployment Compensation for Federal Employees (UCFE) programs. | |||||||
Last Modified Date: Wednesday, September 18, 2024