
The U.S. Bureau of Labor Statistics is best known for our monthly job and inflation reports, but we also publish data on many other topics. My blog series, “Why This Counts,” explains why we conduct our surveys and how people can use BLS data at work and home. I hope this series will help bring BLS data to life—to transform a set of abstract statistics into a snapshot of life in America.
“Time is money,” said Benjamin Franklin in Advice to a Young Tradesman, Written by an Old One. One of the most precious resources each of us has is our time. Indeed, how we use our time can tell you a lot about our priorities, opportunities, and constraints.
Today I am happy to announce our annual news release and 2014 data for the American Time Use Survey (ATUS)—and that we’ve made it easier to compare this year’s results to previous years.
Unlike other BLS surveys that track employment, wages, and prices, the ATUS tracks a less conventional economic resource that we never have enough of: time. The survey compiles data on how much time Americans spend doing paid work, unpaid household work (such as taking care of children or doing household chores), and all the other activities that compose a typical day. With this information, economists, sociologists, and other researchers can examine the different time choices and tradeoffs that people make every day.
ATUS data are behind many of the facts you often see in the news, such as:
- At what times of day do workers with different occupations work? (25% of workers in protective service occupations, such as firefighters and police, are at work at midnight.)
- How many hours of sleep do people get at different ages? (For teenagers, 9.8 hours!)
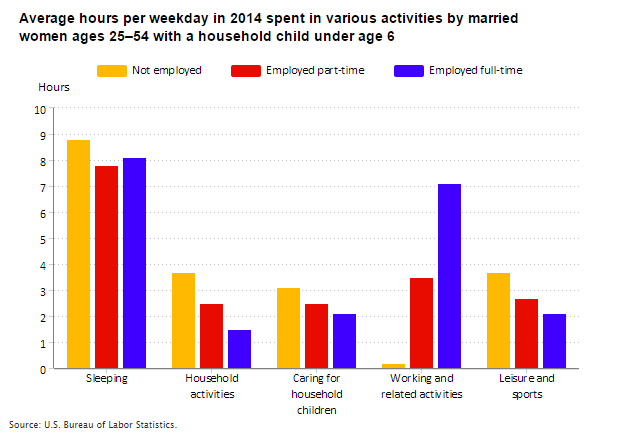
- How many hours per day do employed parents spend caring for their children? (See chart below.)
How do we get this key information? The ATUS is the only nationally representative, continuous survey that provides estimates of how, where, and with whom Americans spend their time. In 2014, more than 11,500 respondents completed the survey. The results represent the national population by gender, age, race and ethnicity, and other characteristics. We select the ATUS sample from households that have already responded to another BLS survey, the Current Population Survey. This enriches ATUS data because we already know the demographic characteristics and household composition and don’t have to ask for that information again. Instead, most of the ATUS interview involves asking respondents to report a time-use “diary” for the previous day.
In service to the rest of us, ATUS respondents voluntarily and carefully report every activity they did for the 24-hour period beginning at 4 a.m. on the day before the interview and ending at 4 a.m. on the day of the interview. So, dear reader, each of us owes the ATUS participants a huge thank you for their public service!
Economists from the U.S. Census Bureau and BLS put these responses together in a way that prevents anyone from identifying individual respondents. BLS then makes the data available to the public in the form of public-use data files, tables, charts, and news releases.
People often ask us how these estimates have changed over time. It’s now much easier for you to examine trends in time use because we have added ATUS historical data to the Labstat database on our BLS website. You can view thousands of ATUS time series going back to 2003, the first year of data collection. These data have always been available through the ATUS news release archive and tables. We are pleased to present them now in a more accessible and convenient format.
There are two big benefits to having ATUS data available from the Labstat database. First, all the historical data are now available in one place. You no longer have to combine data from different Excel or PDF documents to create a time series. Second, all estimates in Labstat have been created using the same statistical weighting method, which has been consistent since 2006 but changed slightly each year before that. This allows you to directly compare estimates over time.
We’ve selected a few data series that we think will be of particular interest. You can view these “Top Picks” at https://data.bls.gov/cgi-bin/surveymost?tu
Some examples are:
- The percent of employed people who did some or all of their work from home on days they worked
- The average hours per day mothers and fathers spent providing childcare, by age of their youngest child
- The average hours per day spent in leisure, including watching TV, and socializing, on weekdays and weekend days
Many more data series are available through the Historical Tables extraction tool. These tables allow you to select one or many estimates from ATUS tables, specify a time range, and retrieve the historical data. I hope you will explore this new tool.
For help working with ATUS data and for more information on the survey, please visit the ATUS Labstat Tips webpage and the ATUS homepage.