
Time is a limited resource. We have only 24 hours in a day to do everything we want to do, along with everything we need to do. Caregivers may be especially pressed for time, spending time not only on their own needs, but on the needs of their children or aging family members or friends.
Today I want to focus on care for the elderly. Sixteen percent of the population, amounting to 41.3 million people, provide unpaid eldercare in the United States. About one-quarter of this population provides unpaid eldercare on a given day, spending an average of 2.8 hours providing eldercare. Think about it. That’s almost 3 hours of the day spent caring for someone else—and that doesn’t even count the hours some eldercare providers spend caring for children!
We know this because the American Time Use Survey includes questions about unpaid eldercare. Eldercare commonly refers to the informal or unpaid care that family members or friends provide aging adults, although it can sometimes include formal or paid care. The number of people age 65 and older is expected to rise dramatically over the next two decades. The number of years elderly people live with chronic conditions due to longer life spans is also expected to rise. Because of this, there is wide interest in understanding how much time Americans devote to unpaid eldercare and how it affects caregivers’ lives.
Editor’s note: A text-only version of the graphic is below.
Let’s take a closer look at eldercare providers using the 2015–16 American Time Use Survey data.
Who are they?
- The majority (56 percent) of eldercare providers are women.
- People ages 55 to 64 are the most likely to provide eldercare (24 percent), followed by those ages 45 to 54 (21 percent) and those ages 65 and older (19 percent).
- Sixty-one percent of eldercare providers are employed.
- Four million people are parents of children under the age of 18 and also provide care for their own parent. These people sometimes are called members of the “sandwich generation,” because they are between two generations that need care.
For whom are they providing care?
- Thirty-nine percent of eldercare providers care for someone age 85 or older, while 14 percent provide care for someone ages 65 to 69.
- Most eldercare providers ages 15 to 34 care for a grandparent. Providers ages 35 to 64 are more likely to care for a parent than are caregivers who are younger or older. Providers age 65 and older are more likely to care for a spouse.
How much time are they spending on eldercare?
- Eldercare providers who care solely for someone with whom they live spend an average of 2.2 hours per day providing care.
- On weekdays they provide care, employed caregivers spend an average of 1.8 hours doing so.
- Among caregivers, women are more likely than men to provide eldercare on a given day. On days they provide eldercare, however, men and women spend about the same amount of time providing care.
What types of eldercare activities are they doing?
- When we think of eldercare, it might be easy to think of just the physical care. However, eldercare may include nearly any activity. Providers care for their family and friends by helping with grooming, preparing meals, providing rides, and more. They also provide companionship or remain available to help when needed.
- On days they provide care, 37 percent of eldercare providers prepare food, perform housework, or engage in other household tasks.
- Eldercare providers spend an average of 1.0 hour in caregiving associated with leisure and sports on days they provide care. This includes socializing and communicating.
This is just a snapshot of the eldercare information available from the American Time Use Survey. Find out more about unpaid eldercare in the United States.
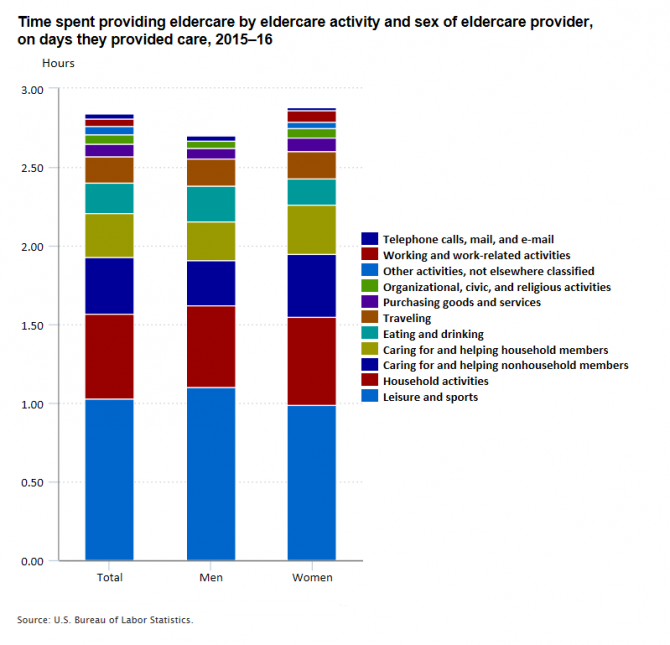
| Caregiving activity | Total | Men | Women |
|---|---|---|---|
| Total, activities reported as care done for those age 65 and older | 2.84 | 2.77 | 2.88 |
Telephone calls, mail, and e-mail | 0.03 | 0.03 | 0.02 |
Working and work-related activities | 0.05 | (1) | 0.07 |
Other activities, not elsewhere classified | 0.05 | (1) | 0.04 |
Organizational, civic, and religious activities | 0.06 | 0.05 | 0.06 |
Purchasing goods and services | 0.08 | 0.07 | 0.09 |
Traveling | 0.17 | 0.17 | 0.17 |
Eating and drinking | 0.19 | 0.23 | 0.17 |
Caring for and helping household members | 0.28 | 0.24 | 0.31 |
Caring for and helping nonhousehold members | 0.36 | 0.29 | 0.40 |
Household activities | 0.54 | 0.52 | 0.56 |
Leisure and sports | 1.03 | 1.10 | 0.99 |
| (1) Estimate is not shown because it does not meet the American Time Use Survey publication standards. | |||