
Football season is here. From pee-wee and youth sports, to high school and college rivalries, to professional matchups, it seems like there’s a game available almost every day of the week. You may wonder how football is related to economic statistics. Well, at BLS, we have a stat for that!
A recent Spotlight on Statistics by Bonnie Nichols, a research analyst at the National Endowment for the Arts, examines information from the BLS Consumer Expenditure Survey on what households spent on entertainment, including sporting events.
- In 2015, American consumers spent an average of $652 for admission to entertainment events, including movies, performing arts, and sporting events. The average spent on sporting events was about $43.
- Americans ages 35–44 spent an average of $957 per year and those ages 45–54 spent an average of $879 per year.
The Spotlight also provides information from the National Endowment for the Arts on the percentage of adults who attend sporting events—about 30 percent in 2012. Attendance varied by education level. Nearly twice the share of people with a bachelor’s degree or higher (43.4 percent) attended a sporting event as did people with a high school diploma or less education (22.5 percent).
Another source of information about America’s football behavior is the American Time Use Survey, which measures how Americans spend their day. In 2016, about 22 percent of Americans spent some time during the day in sports, exercise, and recreation activities. That could include playing a game of touch football on the back lawn at Thanksgiving or attending a game to cheer on your favorite team.
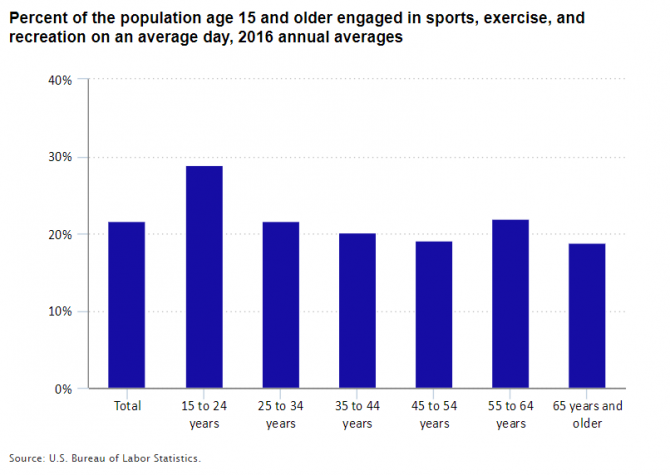
Editor’s note: Data for this chart are available in the table below.
More tidbits. The Consumer Price Index for October 2017 showed prices for admission to sporting events fell 1.7 percent over the year. Maybe it’s a good time to think about attending a game. On the other hand, the CPI also showed the price of beer bought away from home, such as at a stadium, rose 2.0 percent over the year.
I have to go get ready for the Thanksgiving Day games. Hope to see you on the gridiron.
| Age | Percent |
|---|---|
Total | 21.7 |
15 to 24 years | 28.9 |
25 to 34 years | 21.6 |
35 to 44 years | 20.2 |
45 to 54 years | 19.1 |
55 to 64 years | 22.0 |
65 years and older | 18.8 |