
Did you know that U.S. establishments at least partially owned by foreign companies employed 5.5 million U.S. workers in 2012? That was 5.0 percent of U.S. private-sector employment. The U.S. Bureau of Labor Statistics recently partnered with the Bureau of Economic Analysis to produce new data on foreign direct investment in the United States. These two agencies created a new, richer dataset on employment, wages, and occupations in U.S. establishments that have at least one foreign owner.
So how do we define foreign direct investment anyway? In the simplest sense, it is when a U.S. establishment has an owner from another country with at least a 10-percent stake. We consider any establishment that does not meet this threshold as domestically owned. The new data are more detailed than any data previously available on foreign direct investment in the United States. This first set of data is for 2012, but the agencies plan to work together to produce more recent data soon.
Nearly two-thirds of jobs in establishments with foreign ownership had European ownership (3.5 million jobs). The United Kingdom accounted for 874,000 of these jobs. Asia accounted for 17 percent (936,000 jobs) of jobs in U.S. establishments with foreign ownership. Canada accounted for 12 percent (671,000 jobs). The remaining world regions together accounted for less than 8 percent.
Now let’s look at how employment in establishments with foreign ownership breaks down within the United States. The map below shows the percent of private employment in establishments with foreign ownership in each state. South Carolina had the largest share of private employment in establishments with foreign ownership, 8.0 percent. Other states with large shares include New Hampshire, Michigan, Connecticut, New Jersey, and Indiana.
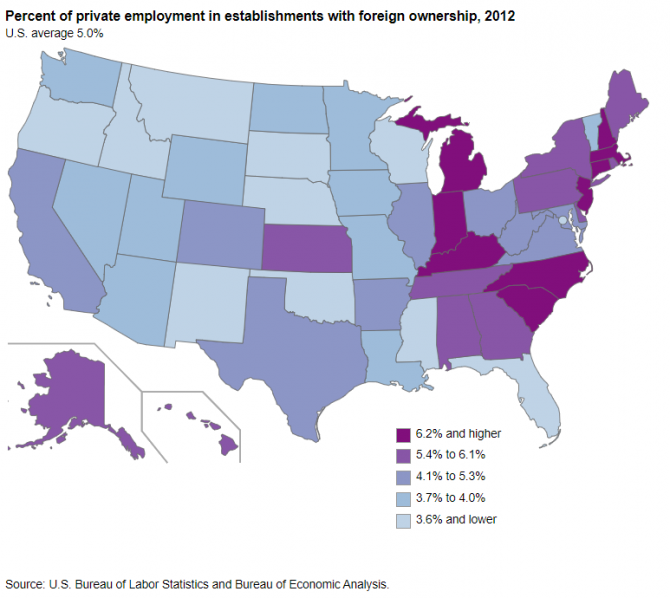
Editor’s note: Data for this map are available in the table below.
Each state’s percent of employment in establishments with foreign ownership depends in part on the industry mix in the state. The chart below shows the percent of each industry’s employment in establishments with foreign ownership. In mining, quarrying, and oil and gas extraction, 14.7 percent of employment is in establishments with foreign ownership. A large share of employment in Alaska is in this industry. Alaska’s share of employment in establishments with foreign ownership, 5.7 percent, is above the national average. Alaska’s vast energy resources may play a role in its share of employment in establishments with foreign ownership.
About 13.2 percent of all employees in manufacturing work in establishments with foreign ownership. Michigan has a large share of employment in manufacturing, and also a large share of employment in establishments with foreign ownership.
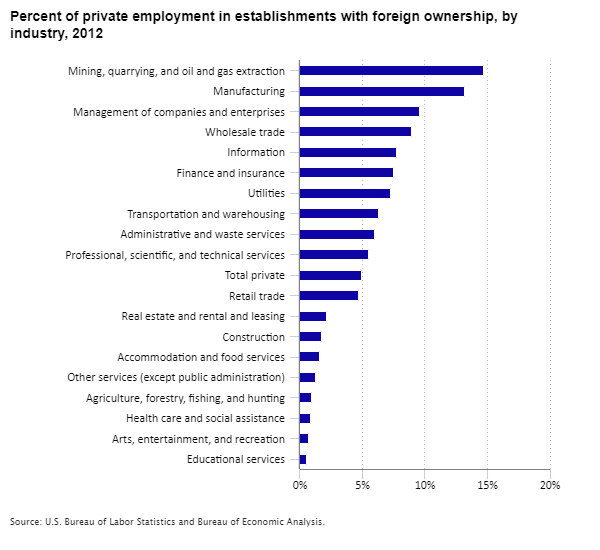
Editor’s note: Data for this chart are available in the table below.
Now let’s turn from employment to wages. The map below shows how wages in establishments with foreign ownership compare with wages in domestically owned establishments across the country. We make this comparison by calculating the ratio of what workers make in average wages in establishments with foreign ownership compared to the average wage in domestically owned establishments. Wage ratios greater than one mean the average for establishments with foreign ownership is higher than for domestically owned establishments. The U.S. wage ratio in 2012 was 1.57, and every state had a wage ratio greater than one. The highest wage ratio was in New York, at 1.98. At the other end of the spectrum, Vermont had a wage ratio of 1.05.
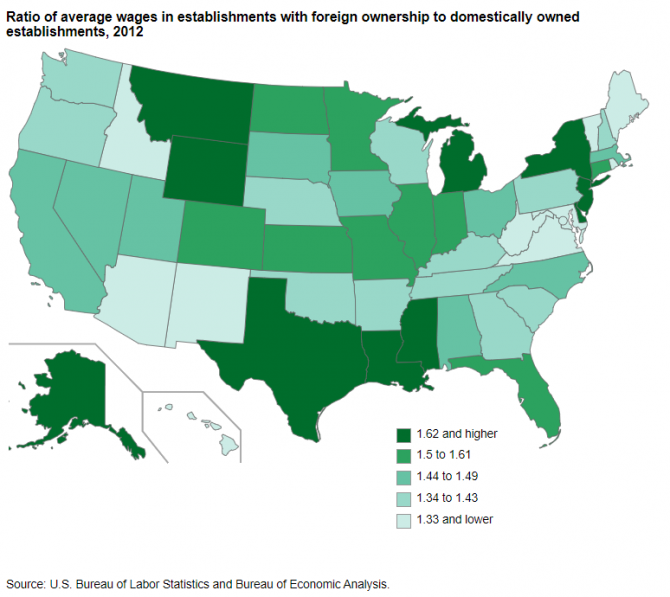
Editor’s note: Data for this map are available in the table below.
Does this mean every establishment with foreign ownership pays higher wages than domestically owned establishments? Let’s analyze wage ratios by industry. We see that the health care and social assistance industry had a wage ratio of 0.86 in 2012. All other major industry groups had wage ratios of 1.00 or higher. The finance and insurance industry had a wage ratio of 1.82.
Want to know more about these data? See our Spotlight on Statistics, “A look at employment and wages in U.S. establishments with foreign ownership.”
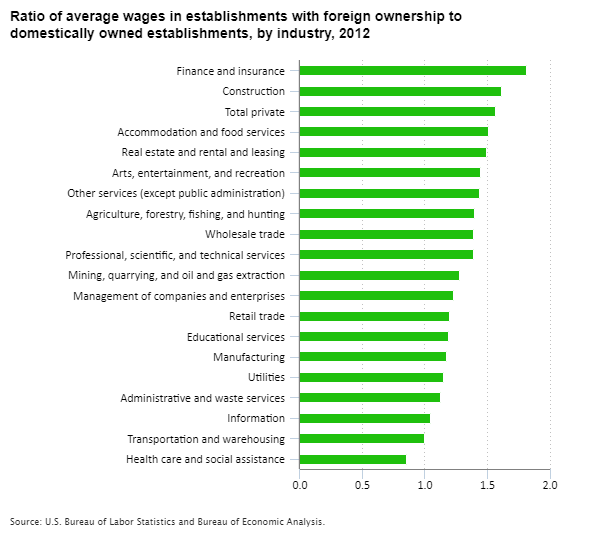
Editor’s note: Data for this chart are available in the table below.
BLS and the Bureau of Economic Analysis hope to continue this interagency collaboration. Our goal is to merge and analyze more recent data from both agencies. When agencies work together to produce new datasets with little increase in cost to the public, all data users benefit. Producing accurate, objective, relevant, timely, and accessible products is the BLS mission. This collaboration to produce new relevant data allows us to improve our service to the American people.
| State | Employment share |
|---|---|
| National | 5.0% |
| Alabama | 5.4 |
| Alaska | 5.7 |
| Arizona | 3.9 |
| Arkansas | 4.5 |
| California | 4.2 |
| Colorado | 4.6 |
| Connecticut | 6.5 |
| Delaware | 6.0 |
| District of Columbia | 3.4 |
| Florida | 3.6 |
| Georgia | 5.5 |
| Hawaii | 6.0 |
| Idaho | 2.9 |
| Illinois | 5.1 |
| Indiana | 6.4 |
| Iowa | 4.0 |
| Kansas | 5.7 |
| Kentucky | 6.2 |
| Louisiana | 3.9 |
| Maine | 6.1 |
| Maryland | 4.7 |
| Massachusetts | 6.3 |
| Michigan | 6.6 |
| Minnesota | 4.0 |
| Mississippi | 3.4 |
| Missouri | 4.0 |
| Montana | 1.8 |
| Nebraska | 3.6 |
| Nevada | 3.8 |
| New Hampshire | 6.9 |
| New Jersey | 6.5 |
| New Mexico | 3.0 |
| New York | 5.8 |
| North Carolina | 6.2 |
| North Dakota | 3.8 |
| Ohio | 5.3 |
| Oklahoma | 3.6 |
| Oregon | 3.4 |
| Pennsylvania | 5.5 |
| Rhode Island | 6.1 |
| South Carolina | 8.0 |
| South Dakota | 2.1 |
| Tennessee | 5.5 |
| Texas | 5.3 |
| Utah | 4.0 |
| Vermont | 3.7 |
| Virginia | 5.1 |
| Washington | 4.0 |
| West Virginia | 4.8 |
| Wisconsin | 3.5 |
| Wyoming | 3.8 |
| Industry | Employment share |
|---|---|
| Mining, quarrying, and oil and gas extraction | 14.7% |
| Manufacturing | 13.2 |
| Management of companies and enterprises | 9.6 |
| Wholesale trade | 9.0 |
| Information | 7.8 |
| Finance and insurance | 7.5 |
| Utilities | 7.3 |
| Transportation and warehousing | 6.3 |
| Administrative and waste services | 6.0 |
| Professional, scientific, and technical services | 5.5 |
| Total private | 5.0 |
| Retail trade | 4.7 |
| Real estate and rental and leasing | 2.2 |
| Construction | 1.8 |
| Accommodation and food services | 1.6 |
| Other services (except public administration) | 1.3 |
| Agriculture, forestry, fishing, and hunting | 1.0 |
| Health care and social assistance | 0.9 |
| Arts, entertainment, and recreation | 0.7 |
| Educational services | 0.6 |
| State | Wage ratio |
|---|---|
| National | 1.57 |
| Alabama | 1.44 |
| Alaska | 1.63 |
| Arizona | 1.28 |
| Arkansas | 1.43 |
| California | 1.49 |
| Colorado | 1.53 |
| Connecticut | 1.53 |
| Delaware | 1.78 |
| District of Columbia | 1.08 |
| Florida | 1.52 |
| Georgia | 1.36 |
| Hawaii | 1.06 |
| Idaho | 1.30 |
| Illinois | 1.61 |
| Indiana | 1.56 |
| Iowa | 1.48 |
| Kansas | 1.56 |
| Kentucky | 1.36 |
| Louisiana | 1.67 |
| Maine | 1.26 |
| Maryland | 1.28 |
| Massachusetts | 1.46 |
| Michigan | 1.84 |
| Minnesota | 1.50 |
| Mississippi | 1.63 |
| Missouri | 1.55 |
| Montana | 1.63 |
| Nebraska | 1.35 |
| Nevada | 1.47 |
| New Hampshire | 1.39 |
| New Jersey | 1.64 |
| New Mexico | 1.22 |
| New York | 1.98 |
| North Carolina | 1.47 |
| North Dakota | 1.55 |
| Ohio | 1.49 |
| Oklahoma | 1.40 |
| Oregon | 1.41 |
| Pennsylvania | 1.43 |
| Rhode Island | 1.31 |
| South Carolina | 1.43 |
| South Dakota | 1.45 |
| Tennessee | 1.42 |
| Texas | 1.80 |
| Utah | 1.45 |
| Vermont | 1.05 |
| Virginia | 1.23 |
| Washington | 1.40 |
| West Virginia | 1.33 |
| Wisconsin | 1.38 |
| Wyoming | 1.72 |
| Industry | Wage ratio |
|---|---|
| Finance and insurance | 1.82 |
| Construction | 1.62 |
| Total private | 1.57 |
| Accommodation and food services | 1.51 |
| Real estate and rental and leasing | 1.50 |
| Arts, entertainment, and recreation | 1.45 |
| Other services (except public administration) | 1.44 |
| Agriculture, forestry, fishing, and hunting | 1.40 |
| Wholesale trade | 1.39 |
| Professional, scientific, and technical services | 1.39 |
| Mining, quarrying, and oil and gas extraction | 1.28 |
| Management of companies and enterprises | 1.23 |
| Retail trade | 1.20 |
| Educational services | 1.19 |
| Manufacturing | 1.18 |
| Utilities | 1.15 |
| Administrative and waste services | 1.13 |
| Information | 1.05 |
| Transportation and warehousing | 1.00 |
| Health care and social assistance | 0.86 |