At BLS, productivity is the economic statistic that describes the efficiency of production. The productivity statistics you hear about most often in the news are for the entire U.S. economy. But there’s more to the productivity story than just the overall numbers. The economy is made up of hundreds of industries, and each one works in a different way. Productivity data for each industry help us understand how specific types of production have changed over time. Let’s look at a few specific industries to see how labor productivity data can enhance our understanding of their unique production systems.
General Freight Trucking: Technological Innovations
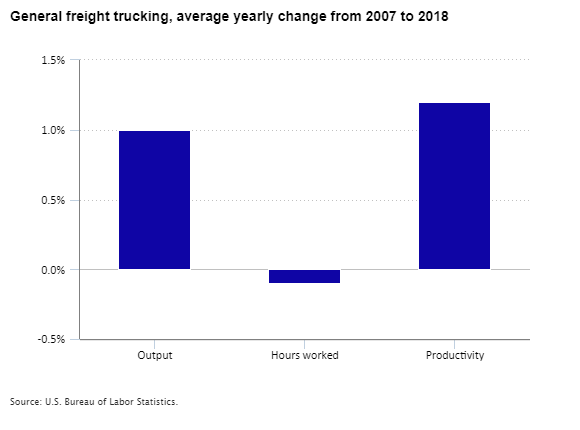
Economic conditions in the general freight trucking industry closely mirror the health of the overall economy. During the 2007–09 recession, both output and hours worked fell dramatically in trucking. Because employment and spending were down nationwide, there was less demand for the transportation of all kinds of goods. After the recession ended, output and hours in trucking picked back up. Output reached prerecession levels by 2014, but in 2018 hours worked were still slightly below their 2007 level.
Dividing output by hours worked yields labor productivity. Because output in trucking has grown faster than hours during the recovery from the recession, labor productivity has increased. This helps us understand the nature of operations in general freight trucking. Innovative technologies such as communications systems, mapping software, and truck-based sensors and monitors known as “telematics” have improved transportation efficiency. These systems allow deliveries to be planned more efficiently with fewer delays, allowing more freight to be delivered without an equivalent increase in worker hours.

Editor’s note: Data for this chart are available in the table below.
Travel Agencies: Digital Transformation
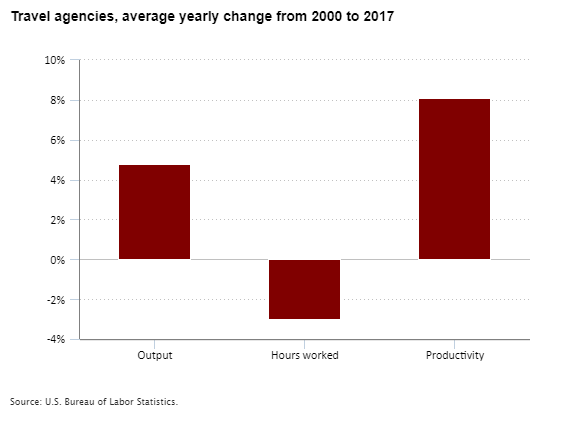
Another industry that has changed the way it operates is travel agencies. Since 2000, output has increased substantially, while hours fell from 2000 to 2010 and have increased only slightly since then. The major transformation for travel agencies has been the Internet. Online tools have allowed clients to make travel reservations with far less help from workers. This increase in efficiency is reflected in the industry’s labor productivity, which has more than tripled from 2000 to 2017.

Editor’s note: Data for this chart are available in the table below.
Supermarkets: Incremental Change
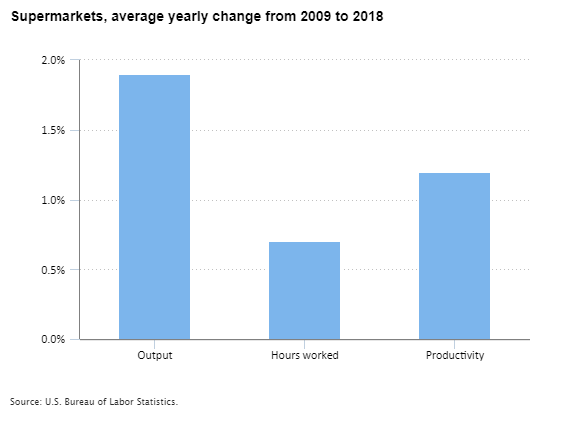
Changes in other industries have been more subtle. Supermarkets are a particularly competitive industry, and firms employ a large number of workers to maintain high levels of customer service. Managing inventories, stocking shelves, checking out merchandise, and staffing specialty stations are all tasks that supermarkets continue to need. But even in supermarkets, productivity has been increasing since 2009, as output has grown faster than worker hours. To continue growing sales with lower costs, many firms in this industry have relied more on labor-saving technology, such as self-checkout machines. This technology increases efficiency by allowing supermarkets to process more transactions with less help from workers.

Editor’s note: Data for this chart are available in the table below.
Cut and Sew Apparel Manufacturing: Establishment Turnover
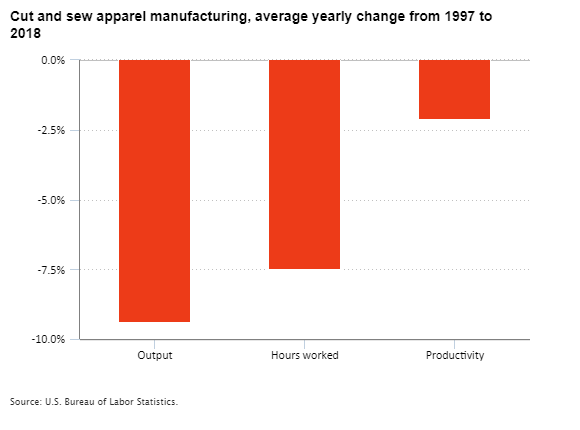
Productivity declines also can show the changing nature of work. Cut and sew apparel manufacturing has seen much of its production move outside the United States. In 2018, U.S. apparel manufacturers produced less than 15 percent of the output they produced in 1997. Although worker hours also have declined, they have not dropped as much as output, leading to a decline in labor productivity. This indicates a shift over time in the nature of the average apparel manufacturer. While many large establishments moved overseas in search of cheaper labor, the remaining domestic apparel manufacturing establishments are on average smaller and more specialized, requiring more labor-intensive work.

Editor’s note: Data for this chart are available in the table below.
To Learn More
BLS industry productivity data help us study the efficiencies of economic activities. Historical trends in productivity provide an important window into each industry’s working conditions, competitiveness, contribution to the economy, and potential for future growth. These data are used by investors, business leaders, jobseekers, researchers, and government decision makers. We have annual labor productivity measures for over 275 detailed industries.
To dive into the data for yourself, check out the BLS webpages on labor productivity. You also can see productivity data in a brand new way using our industry productivity viewer! Even more specialized industry data are on our webpages for hospitals, construction industries, elementary and secondary schools, and urban transit systems. We also have a recent article on productivity in grocery stores.
| Industry | Output | Hours worked | Productivity |
|---|---|---|---|
General freight trucking, 2007 to 2018 | 1.0% | -0.1% | 1.2% |
Travel agencies, 2000 to 2017 | 4.8 | -3.0 | 8.1 |
Supermarkets, 2009 to 2018 | 1.9 | 0.7 | 1.2 |
Cut and sew apparel manufacturing, 1997 to 2018 | -9.4 | -7.5 | -2.1 |
 United States Department of Labor