
The current “supply” of labor gets a lot of attention. That concept refers to the number of people working or looking for work. Our monthly Employment Situation report is where policymakers and the general public learn how that supply has changed. BLS also examines the current “demand” for labor with monthly information on filled jobs and job openings. Readers find those estimate in the BLS Job Openings and Labor Turnover Survey (JOLTS). JOLTS defines job openings as all positions that are open, but not filled, on the last business day of the month. A job is “open” only if it meets all of these conditions:
- A specific position exists and there is work available for that position.
- The job could start within 30 days.
- There is active recruiting for workers from outside the establishment.
There were 9.2 million job openings in May 2021, the same record-high level first reached in April. The May job opening rate also was the same as April’s record high; 6.0 percent of all currently available positions were unfilled. This rate is the number of job openings divided by the sum of current employment plus job openings. You can think of it as a measure of capacity or the rate of current unmet demand for labor.
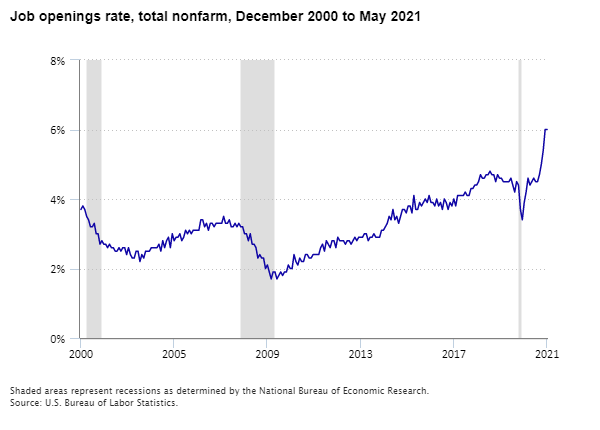
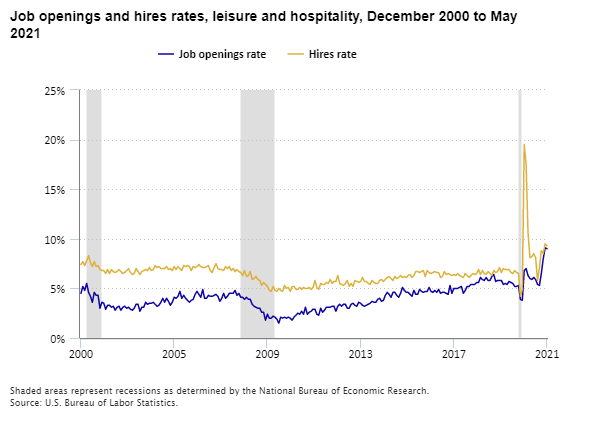
Editor’s note: Data for this chart are available in the table below.
This spike in openings was sudden by historical standards. It came just one year after an equally sudden drop, which bottomed out in April 2020. In contrast, openings fell more gradually during the 2007–09 recession, then grew even more gradually during the subsequent recovery. The labor market movements during the COVID-19 pandemic have been far more abrupt than those in earlier business cycles.
An abundance of job openings usually signals a “tight” labor market; the demand for labor exceeds the supply at the offered wage. For workers, this may mean it is relatively easy to find a desirable job, assuming they possess the skills employers are seeking. In contrast, employers must compete to hire well-qualified workers.
High unemployment usually signals a “loose” labor market, in which many applicants compete for a limited number of openings; the supply of labor exceeds the demand. Unemployment—the number of workers who lack but seek jobs—stood at 9.5 million in June 2021. That was, down from its pandemic peak of 23 million in April 2020 but still well above its level of less than 6 million before the pandemic. Millions more have left the labor force during the pandemic, and many of them have not returned. These people are not counted as unemployed because they are not actively looking for work. However, we know that 6.4 million of those not in the labor force indicate they want a job now, and 1.6 million say they are not currently searching because of pandemic-related reasons. Some of these people might be willing to consider offers and might add more “looseness” to the labor market.
Comparing the number of job openings to the number of unemployed people provides one measure of the current job market. In May 2021, there was just one unemployed person per job opening—a ratio usually associated with a tight labor market.
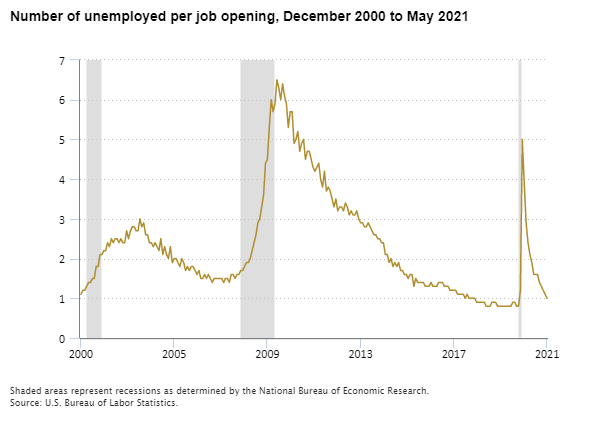
Editor’s note: Data for this chart are available in the table below.
So, with openings at an all-time high, and unemployment still elevated, is the labor market tight or loose? The answer is complicated. It also can feel different depending on each worker’s and employer’s circumstances. The answer also differs when you look beyond the national data to uncover differing stories by industry or geography.
As the COVID-19 pandemic subsides and many restaurants and other businesses return to normal operations, some employers are finding it hard to hire enough workers quickly. Some economists are unsure whether recent, temporary increases in the availability and generosity of unemployment insurance have influenced some unemployed workers’ interest in taking jobs. At the same time, the lingering effects of the pandemic probably kept some potential workers from entering or reentering the labor force, especially those with school-aged children whose schools were still closed, and those lacking childcare options. These factors could also affect employers’ ability to hire.
We should also remember that not all job applicants come from the ranks of the unemployed. Many are changing jobs or entering (or reentering) the labor force. The recent abundance of job openings may be increasing workers’ likelihood to change jobs. Just as openings reached a new high in April 2021, so did quits, at 4.0 million. Unlike openings, however, quits edged down a bit in May.
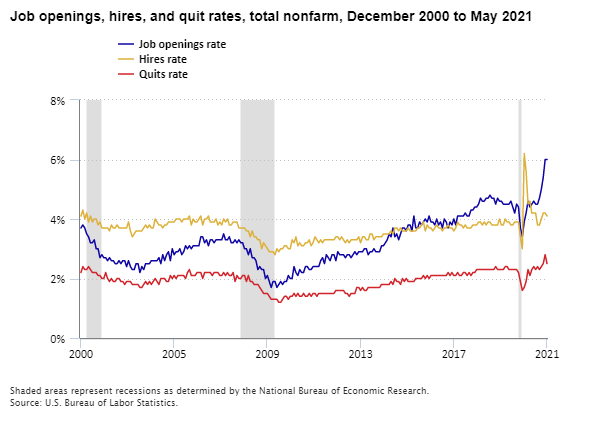
Editor’s note: Data for this chart are available in the table below.
Another factor could be mismatches between the open jobs and the jobseekers. In June 2021, about 15 percent of unemployed people were seeking part-time work. We don’t know how many of the openings were part-time. Since February of this year, the share of unemployed workers who were unemployed 27 weeks or longer has remained above 40 percent, a level last seen in 2012 and roughly twice the 2019 level. Historically, those unemployed longer are slower to connect with new jobs and more likely to stop looking. It is also possible that some workers’ job preferences changed, at least temporarily, as the pandemic changed the perceived risks and other characteristics of many jobs.
Finally, with many people on the sidelines of the labor market, and job openings at record high levels, employers may look to increase wages to entice potential employees back into the market. The BLS monthly measure of wage trends, average hourly earnings, has been heavily influenced by large employment shifts since the pandemic began. When employment dropped sharply in the spring of 2020, average wages increased, mainly because lower-paid workers were more likely to be out of work. Now that many businesses are reopening, some evidence of wage increases can be seen by focusing on the leisure and hospitality industry. From February 2020, just before the pandemic began, to June 2021, average hourly earnings for this industry rose 3.1 percent, after adjusting for inflation. Data from the Employment Cost Index, which are not influenced by employment shifts, show wages and salaries in the leisure and hospitality industry increasing 1.6 percent, after adjusting for inflation, for the year ending March 2021.
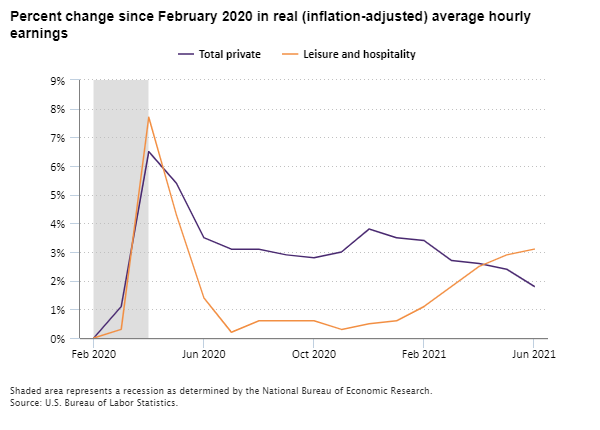
Editor’s note: Data for this chart are available in the table below.
While some employers might find it hard to hire workers quickly, there is a lot of hiring going on. Consider the leisure and hospitality industry, which includes restaurants. In May, a whopping 9.0 percent of positions were open. But the hiring rate was even higher—9.3 percent, far above levels before the pandemic.
Editor’s note: Data for this chart are available in the table below.
The labor market cannot be characterized with a single number. Over time, people change jobs, look for jobs, or leave the labor market entirely. These dynamics can be complicated, as they certainly were during the COVID-19 pandemic. This discussion covers just some of the many measures BLS reports to illuminate labor market conditions. For more analysis of JOLTS data, check out recent articles in the Monthly Labor Review and Beyond the Numbers.
| Month | Rate |
|---|---|
Dec 2000 | 3.7% |
Jan 2001 | 3.8 |
Feb 2001 | 3.7 |
Mar 2001 | 3.5 |
Apr 2001 | 3.4 |
May 2001 | 3.2 |
Jun 2001 | 3.2 |
Jul 2001 | 3.3 |
Aug 2001 | 3.0 |
Sep 2001 | 3.0 |
Oct 2001 | 2.7 |
Nov 2001 | 2.8 |
Dec 2001 | 2.7 |
Jan 2002 | 2.7 |
Feb 2002 | 2.6 |
Mar 2002 | 2.7 |
Apr 2002 | 2.6 |
May 2002 | 2.6 |
Jun 2002 | 2.5 |
Jul 2002 | 2.5 |
Aug 2002 | 2.6 |
Sep 2002 | 2.5 |
Oct 2002 | 2.6 |
Nov 2002 | 2.6 |
Dec 2002 | 2.4 |
Jan 2003 | 2.6 |
Feb 2003 | 2.4 |
Mar 2003 | 2.3 |
Apr 2003 | 2.3 |
May 2003 | 2.5 |
Jun 2003 | 2.5 |
Jul 2003 | 2.2 |
Aug 2003 | 2.4 |
Sep 2003 | 2.3 |
Oct 2003 | 2.5 |
Nov 2003 | 2.5 |
Dec 2003 | 2.5 |
Jan 2004 | 2.6 |
Feb 2004 | 2.6 |
Mar 2004 | 2.6 |
Apr 2004 | 2.6 |
May 2004 | 2.7 |
Jun 2004 | 2.5 |
Jul 2004 | 2.8 |
Aug 2004 | 2.6 |
Sep 2004 | 2.8 |
Oct 2004 | 2.9 |
Nov 2004 | 2.6 |
Dec 2004 | 3.0 |
Jan 2005 | 2.8 |
Feb 2005 | 2.9 |
Mar 2005 | 2.9 |
Apr 2005 | 3.0 |
May 2005 | 2.8 |
Jun 2005 | 2.9 |
Jul 2005 | 3.1 |
Aug 2005 | 3.0 |
Sep 2005 | 3.1 |
Oct 2005 | 3.0 |
Nov 2005 | 3.1 |
Dec 2005 | 3.1 |
Jan 2006 | 3.1 |
Feb 2006 | 3.1 |
Mar 2006 | 3.4 |
Apr 2006 | 3.4 |
May 2006 | 3.2 |
Jun 2006 | 3.3 |
Jul 2006 | 3.1 |
Aug 2006 | 3.3 |
Sep 2006 | 3.3 |
Oct 2006 | 3.2 |
Nov 2006 | 3.3 |
Dec 2006 | 3.3 |
Jan 2007 | 3.3 |
Feb 2007 | 3.3 |
Mar 2007 | 3.5 |
Apr 2007 | 3.3 |
May 2007 | 3.3 |
Jun 2007 | 3.4 |
Jul 2007 | 3.2 |
Aug 2007 | 3.2 |
Sep 2007 | 3.3 |
Oct 2007 | 3.2 |
Nov 2007 | 3.3 |
Dec 2007 | 3.2 |
Jan 2008 | 3.2 |
Feb 2008 | 3.0 |
Mar 2008 | 3.0 |
Apr 2008 | 2.8 |
May 2008 | 3.0 |
Jun 2008 | 2.7 |
Jul 2008 | 2.7 |
Aug 2008 | 2.6 |
Sep 2008 | 2.3 |
Oct 2008 | 2.4 |
Nov 2008 | 2.3 |
Dec 2008 | 2.3 |
Jan 2009 | 2.0 |
Feb 2009 | 2.1 |
Mar 2009 | 1.9 |
Apr 2009 | 1.7 |
May 2009 | 1.9 |
Jun 2009 | 1.9 |
Jul 2009 | 1.7 |
Aug 2009 | 1.8 |
Sep 2009 | 1.9 |
Oct 2009 | 1.8 |
Nov 2009 | 1.9 |
Dec 2009 | 1.9 |
Jan 2010 | 2.1 |
Feb 2010 | 2.0 |
Mar 2010 | 2.0 |
Apr 2010 | 2.4 |
May 2010 | 2.2 |
Jun 2010 | 2.1 |
Jul 2010 | 2.3 |
Aug 2010 | 2.2 |
Sep 2010 | 2.2 |
Oct 2010 | 2.4 |
Nov 2010 | 2.4 |
Dec 2010 | 2.3 |
Jan 2011 | 2.3 |
Feb 2011 | 2.4 |
Mar 2011 | 2.4 |
Apr 2011 | 2.4 |
May 2011 | 2.4 |
Jun 2011 | 2.6 |
Jul 2011 | 2.7 |
Aug 2011 | 2.5 |
Sep 2011 | 2.8 |
Oct 2011 | 2.7 |
Nov 2011 | 2.6 |
Dec 2011 | 2.8 |
Jan 2012 | 2.8 |
Feb 2012 | 2.6 |
Mar 2012 | 2.9 |
Apr 2012 | 2.8 |
May 2012 | 2.8 |
Jun 2012 | 2.8 |
Jul 2012 | 2.7 |
Aug 2012 | 2.8 |
Sep 2012 | 2.8 |
Oct 2012 | 2.7 |
Nov 2012 | 2.8 |
Dec 2012 | 2.9 |
Jan 2013 | 2.8 |
Feb 2013 | 2.9 |
Mar 2013 | 2.9 |
Apr 2013 | 2.9 |
May 2013 | 3.0 |
Jun 2013 | 3.0 |
Jul 2013 | 2.8 |
Aug 2013 | 2.9 |
Sep 2013 | 2.9 |
Oct 2013 | 3.0 |
Nov 2013 | 2.9 |
Dec 2013 | 2.9 |
Jan 2014 | 2.9 |
Feb 2014 | 3.1 |
Mar 2014 | 3.1 |
Apr 2014 | 3.2 |
May 2014 | 3.3 |
Jun 2014 | 3.5 |
Jul 2014 | 3.4 |
Aug 2014 | 3.7 |
Sep 2014 | 3.4 |
Oct 2014 | 3.5 |
Nov 2014 | 3.3 |
Dec 2014 | 3.5 |
Jan 2015 | 3.7 |
Feb 2015 | 3.7 |
Mar 2015 | 3.6 |
Apr 2015 | 3.8 |
May 2015 | 3.8 |
Jun 2015 | 3.6 |
Jul 2015 | 4.1 |
Aug 2015 | 3.7 |
Sep 2015 | 3.7 |
Oct 2015 | 3.9 |
Nov 2015 | 3.8 |
Dec 2015 | 3.9 |
Jan 2016 | 4.0 |
Feb 2016 | 3.9 |
Mar 2016 | 4.1 |
Apr 2016 | 3.9 |
May 2016 | 3.9 |
Jun 2016 | 3.8 |
Jul 2016 | 4.0 |
Aug 2016 | 3.8 |
Sep 2016 | 3.9 |
Oct 2016 | 3.7 |
Nov 2016 | 4.0 |
Dec 2016 | 3.9 |
Jan 2017 | 3.7 |
Feb 2017 | 3.9 |
Mar 2017 | 3.8 |
Apr 2017 | 4.0 |
May 2017 | 3.8 |
Jun 2017 | 4.1 |
Jul 2017 | 4.1 |
Aug 2017 | 4.1 |
Sep 2017 | 4.1 |
Oct 2017 | 4.2 |
Nov 2017 | 4.1 |
Dec 2017 | 4.1 |
Jan 2018 | 4.3 |
Feb 2018 | 4.3 |
Mar 2018 | 4.4 |
Apr 2018 | 4.4 |
May 2018 | 4.5 |
Jun 2018 | 4.7 |
Jul 2018 | 4.6 |
Aug 2018 | 4.6 |
Sep 2018 | 4.7 |
Oct 2018 | 4.7 |
Nov 2018 | 4.8 |
Dec 2018 | 4.7 |
Jan 2019 | 4.7 |
Feb 2019 | 4.5 |
Mar 2019 | 4.7 |
Apr 2019 | 4.6 |
May 2019 | 4.6 |
Jun 2019 | 4.5 |
Jul 2019 | 4.5 |
Aug 2019 | 4.5 |
Sep 2019 | 4.5 |
Oct 2019 | 4.6 |
Nov 2019 | 4.4 |
Dec 2019 | 4.2 |
Jan 2020 | 4.5 |
Feb 2020 | 4.4 |
Mar 2020 | 3.7 |
Apr 2020 | 3.4 |
May 2020 | 3.9 |
Jun 2020 | 4.2 |
Jul 2020 | 4.6 |
Aug 2020 | 4.4 |
Sep 2020 | 4.5 |
Oct 2020 | 4.6 |
Nov 2020 | 4.5 |
Dec 2020 | 4.5 |
Jan 2021 | 4.7 |
Feb 2021 | 5.0 |
Mar 2021 | 5.4 |
Apr 2021 | 6.0 |
May 2021 | 6.0 |
| Month | Ratio |
|---|---|
Dec 2000 | 1.1 |
Jan 2001 | 1.2 |
Feb 2001 | 1.2 |
Mar 2001 | 1.3 |
Apr 2001 | 1.4 |
May 2001 | 1.4 |
Jun 2001 | 1.5 |
Jul 2001 | 1.5 |
Aug 2001 | 1.8 |
Sep 2001 | 1.8 |
Oct 2001 | 2.1 |
Nov 2001 | 2.1 |
Dec 2001 | 2.2 |
Jan 2002 | 2.2 |
Feb 2002 | 2.4 |
Mar 2002 | 2.3 |
Apr 2002 | 2.5 |
May 2002 | 2.4 |
Jun 2002 | 2.5 |
Jul 2002 | 2.5 |
Aug 2002 | 2.4 |
Sep 2002 | 2.5 |
Oct 2002 | 2.4 |
Nov 2002 | 2.4 |
Dec 2002 | 2.7 |
Jan 2003 | 2.5 |
Feb 2003 | 2.7 |
Mar 2003 | 2.8 |
Apr 2003 | 2.8 |
May 2003 | 2.7 |
Jun 2003 | 2.7 |
Jul 2003 | 3.0 |
Aug 2003 | 2.8 |
Sep 2003 | 2.9 |
Oct 2003 | 2.6 |
Nov 2003 | 2.6 |
Dec 2003 | 2.4 |
Jan 2004 | 2.4 |
Feb 2004 | 2.3 |
Mar 2004 | 2.4 |
Apr 2004 | 2.3 |
May 2004 | 2.2 |
Jun 2004 | 2.5 |
Jul 2004 | 2.1 |
Aug 2004 | 2.3 |
Sep 2004 | 2.1 |
Oct 2004 | 2.0 |
Nov 2004 | 2.3 |
Dec 2004 | 1.9 |
Jan 2005 | 2.0 |
Feb 2005 | 2.0 |
Mar 2005 | 1.9 |
Apr 2005 | 1.8 |
May 2005 | 2.0 |
Jun 2005 | 1.9 |
Jul 2005 | 1.7 |
Aug 2005 | 1.8 |
Sep 2005 | 1.7 |
Oct 2005 | 1.8 |
Nov 2005 | 1.8 |
Dec 2005 | 1.7 |
Jan 2006 | 1.6 |
Feb 2006 | 1.7 |
Mar 2006 | 1.5 |
Apr 2006 | 1.5 |
May 2006 | 1.6 |
Jun 2006 | 1.5 |
Jul 2006 | 1.6 |
Aug 2006 | 1.5 |
Sep 2006 | 1.4 |
Oct 2006 | 1.5 |
Nov 2006 | 1.5 |
Dec 2006 | 1.5 |
Jan 2007 | 1.5 |
Feb 2007 | 1.5 |
Mar 2007 | 1.4 |
Apr 2007 | 1.5 |
May 2007 | 1.5 |
Jun 2007 | 1.4 |
Jul 2007 | 1.6 |
Aug 2007 | 1.6 |
Sep 2007 | 1.5 |
Oct 2007 | 1.6 |
Nov 2007 | 1.6 |
Dec 2007 | 1.7 |
Jan 2008 | 1.7 |
Feb 2008 | 1.8 |
Mar 2008 | 1.9 |
Apr 2008 | 1.9 |
May 2008 | 2.0 |
Jun 2008 | 2.2 |
Jul 2008 | 2.4 |
Aug 2008 | 2.6 |
Sep 2008 | 2.9 |
Oct 2008 | 3.0 |
Nov 2008 | 3.3 |
Dec 2008 | 3.6 |
Jan 2009 | 4.4 |
Feb 2009 | 4.5 |
Mar 2009 | 5.3 |
Apr 2009 | 6.0 |
May 2009 | 5.7 |
Jun 2009 | 5.9 |
Jul 2009 | 6.5 |
Aug 2009 | 6.3 |
Sep 2009 | 6.0 |
Oct 2009 | 6.4 |
Nov 2009 | 6.1 |
Dec 2009 | 5.9 |
Jan 2010 | 5.3 |
Feb 2010 | 5.7 |
Mar 2010 | 5.7 |
Apr 2010 | 4.9 |
May 2010 | 5.0 |
Jun 2010 | 5.2 |
Jul 2010 | 4.7 |
Aug 2010 | 4.9 |
Sep 2010 | 5.0 |
Oct 2010 | 4.5 |
Nov 2010 | 4.7 |
Dec 2010 | 4.7 |
Jan 2011 | 4.5 |
Feb 2011 | 4.3 |
Mar 2011 | 4.2 |
Apr 2011 | 4.3 |
May 2011 | 4.4 |
Jun 2011 | 4.0 |
Jul 2011 | 3.8 |
Aug 2011 | 4.2 |
Sep 2011 | 3.7 |
Oct 2011 | 3.8 |
Nov 2011 | 3.7 |
Dec 2011 | 3.5 |
Jan 2012 | 3.3 |
Feb 2012 | 3.5 |
Mar 2012 | 3.2 |
Apr 2012 | 3.3 |
May 2012 | 3.3 |
Jun 2012 | 3.2 |
Jul 2012 | 3.4 |
Aug 2012 | 3.3 |
Sep 2012 | 3.1 |
Oct 2012 | 3.2 |
Nov 2012 | 3.1 |
Dec 2012 | 3.1 |
Jan 2013 | 3.2 |
Feb 2013 | 3.0 |
Mar 2013 | 2.9 |
Apr 2013 | 2.9 |
May 2013 | 2.8 |
Jun 2013 | 2.8 |
Jul 2013 | 2.9 |
Aug 2013 | 2.8 |
Sep 2013 | 2.7 |
Oct 2013 | 2.6 |
Nov 2013 | 2.6 |
Dec 2013 | 2.5 |
Jan 2014 | 2.5 |
Feb 2014 | 2.4 |
Mar 2014 | 2.4 |
Apr 2014 | 2.1 |
May 2014 | 2.1 |
Jun 2014 | 1.9 |
Jul 2014 | 2.0 |
Aug 2014 | 1.8 |
Sep 2014 | 1.9 |
Oct 2014 | 1.8 |
Nov 2014 | 1.9 |
Dec 2014 | 1.7 |
Jan 2015 | 1.7 |
Feb 2015 | 1.6 |
Mar 2015 | 1.6 |
Apr 2015 | 1.5 |
May 2015 | 1.6 |
Jun 2015 | 1.6 |
Jul 2015 | 1.3 |
Aug 2015 | 1.5 |
Sep 2015 | 1.4 |
Oct 2015 | 1.4 |
Nov 2015 | 1.4 |
Dec 2015 | 1.4 |
Jan 2016 | 1.3 |
Feb 2016 | 1.3 |
Mar 2016 | 1.3 |
Apr 2016 | 1.4 |
May 2016 | 1.3 |
Jun 2016 | 1.3 |
Jul 2016 | 1.3 |
Aug 2016 | 1.4 |
Sep 2016 | 1.4 |
Oct 2016 | 1.4 |
Nov 2016 | 1.3 |
Dec 2016 | 1.3 |
Jan 2017 | 1.3 |
Feb 2017 | 1.2 |
Mar 2017 | 1.2 |
Apr 2017 | 1.2 |
May 2017 | 1.2 |
Jun 2017 | 1.1 |
Jul 2017 | 1.1 |
Aug 2017 | 1.1 |
Sep 2017 | 1.1 |
Oct 2017 | 1.0 |
Nov 2017 | 1.1 |
Dec 2017 | 1.0 |
Jan 2018 | 1.0 |
Feb 2018 | 1.0 |
Mar 2018 | 1.0 |
Apr 2018 | 0.9 |
May 2018 | 0.9 |
Jun 2018 | 0.9 |
Jul 2018 | 0.9 |
Aug 2018 | 0.9 |
Sep 2018 | 0.8 |
Oct 2018 | 0.8 |
Nov 2018 | 0.8 |
Dec 2018 | 0.9 |
Jan 2019 | 0.9 |
Feb 2019 | 0.9 |
Mar 2019 | 0.8 |
Apr 2019 | 0.8 |
May 2019 | 0.8 |
Jun 2019 | 0.8 |
Jul 2019 | 0.8 |
Aug 2019 | 0.8 |
Sep 2019 | 0.8 |
Oct 2019 | 0.8 |
Nov 2019 | 0.9 |
Dec 2019 | 0.9 |
Jan 2020 | 0.8 |
Feb 2020 | 0.8 |
Mar 2020 | 1.2 |
Apr 2020 | 5.0 |
May 2020 | 3.9 |
Jun 2020 | 2.9 |
Jul 2020 | 2.4 |
Aug 2020 | 2.1 |
Sep 2020 | 1.9 |
Oct 2020 | 1.6 |
Nov 2020 | 1.6 |
Dec 2020 | 1.6 |
Jan 2021 | 1.4 |
Feb 2021 | 1.3 |
Mar 2021 | 1.2 |
Apr 2021 | 1.1 |
May 2021 | 1.0 |
| Month | Job openings rate | Hires rate | Quits rate |
|---|---|---|---|
Dec 2000 | 3.7% | 4.1% | 2.2% |
Jan 2001 | 3.8 | 4.3 | 2.4 |
Feb 2001 | 3.7 | 4.0 | 2.3 |
Mar 2001 | 3.5 | 4.2 | 2.3 |
Apr 2001 | 3.4 | 3.9 | 2.4 |
May 2001 | 3.2 | 4.1 | 2.3 |
Jun 2001 | 3.2 | 3.9 | 2.2 |
Jul 2001 | 3.3 | 4.0 | 2.2 |
Aug 2001 | 3.0 | 4.0 | 2.2 |
Sep 2001 | 3.0 | 3.8 | 2.1 |
Oct 2001 | 2.7 | 3.9 | 2.1 |
Nov 2001 | 2.8 | 3.7 | 2.0 |
Dec 2001 | 2.7 | 3.7 | 2.0 |
Jan 2002 | 2.7 | 3.7 | 2.2 |
Feb 2002 | 2.6 | 3.7 | 2.0 |
Mar 2002 | 2.7 | 3.6 | 1.9 |
Apr 2002 | 2.6 | 3.8 | 2.0 |
May 2002 | 2.6 | 3.7 | 1.9 |
Jun 2002 | 2.5 | 3.7 | 1.9 |
Jul 2002 | 2.5 | 3.8 | 2.0 |
Aug 2002 | 2.6 | 3.7 | 2.0 |
Sep 2002 | 2.5 | 3.7 | 1.9 |
Oct 2002 | 2.6 | 3.7 | 1.9 |
Nov 2002 | 2.6 | 3.7 | 1.8 |
Dec 2002 | 2.4 | 3.7 | 1.9 |
Jan 2003 | 2.6 | 3.9 | 1.9 |
Feb 2003 | 2.4 | 3.6 | 1.9 |
Mar 2003 | 2.3 | 3.4 | 1.8 |
Apr 2003 | 2.3 | 3.5 | 1.8 |
May 2003 | 2.5 | 3.6 | 1.8 |
Jun 2003 | 2.5 | 3.6 | 1.8 |
Jul 2003 | 2.2 | 3.6 | 1.7 |
Aug 2003 | 2.4 | 3.6 | 1.7 |
Sep 2003 | 2.3 | 3.7 | 1.8 |
Oct 2003 | 2.5 | 3.8 | 1.9 |
Nov 2003 | 2.5 | 3.7 | 1.8 |
Dec 2003 | 2.5 | 3.8 | 1.9 |
Jan 2004 | 2.6 | 3.7 | 1.8 |
Feb 2004 | 2.6 | 3.7 | 1.9 |
Mar 2004 | 2.6 | 4.0 | 2.0 |
Apr 2004 | 2.6 | 3.9 | 1.9 |
May 2004 | 2.7 | 3.8 | 1.8 |
Jun 2004 | 2.5 | 3.8 | 2.0 |
Jul 2004 | 2.8 | 3.7 | 2.0 |
Aug 2004 | 2.6 | 3.8 | 2.0 |
Sep 2004 | 2.8 | 3.8 | 1.9 |
Oct 2004 | 2.9 | 3.9 | 1.9 |
Nov 2004 | 2.6 | 3.9 | 2.1 |
Dec 2004 | 3.0 | 3.9 | 2.0 |
Jan 2005 | 2.8 | 3.9 | 2.1 |
Feb 2005 | 2.9 | 4.0 | 2.0 |
Mar 2005 | 2.9 | 4.0 | 2.1 |
Apr 2005 | 3.0 | 4.0 | 2.1 |
May 2005 | 2.8 | 3.9 | 2.1 |
Jun 2005 | 2.9 | 4.0 | 2.1 |
Jul 2005 | 3.1 | 4.0 | 2.0 |
Aug 2005 | 3.0 | 4.0 | 2.2 |
Sep 2005 | 3.1 | 4.1 | 2.3 |
Oct 2005 | 3.0 | 3.8 | 2.1 |
Nov 2005 | 3.1 | 4.0 | 2.1 |
Dec 2005 | 3.1 | 3.9 | 2.1 |
Jan 2006 | 3.1 | 3.9 | 2.2 |
Feb 2006 | 3.1 | 4.0 | 2.2 |
Mar 2006 | 3.4 | 4.1 | 2.2 |
Apr 2006 | 3.4 | 3.8 | 2.0 |
May 2006 | 3.2 | 4.0 | 2.2 |
Jun 2006 | 3.3 | 4.0 | 2.2 |
Jul 2006 | 3.1 | 4.1 | 2.2 |
Aug 2006 | 3.3 | 3.9 | 2.2 |
Sep 2006 | 3.3 | 3.9 | 2.1 |
Oct 2006 | 3.2 | 3.9 | 2.2 |
Nov 2006 | 3.3 | 4.0 | 2.2 |
Dec 2006 | 3.3 | 3.8 | 2.2 |
Jan 2007 | 3.3 | 3.9 | 2.1 |
Feb 2007 | 3.3 | 3.8 | 2.1 |
Mar 2007 | 3.5 | 4.0 | 2.2 |
Apr 2007 | 3.3 | 3.9 | 2.1 |
May 2007 | 3.3 | 4.0 | 2.2 |
Jun 2007 | 3.4 | 3.8 | 2.1 |
Jul 2007 | 3.2 | 3.8 | 2.1 |
Aug 2007 | 3.2 | 3.9 | 2.2 |
Sep 2007 | 3.3 | 3.9 | 1.9 |
Oct 2007 | 3.2 | 3.9 | 2.1 |
Nov 2007 | 3.3 | 3.7 | 2.0 |
Dec 2007 | 3.2 | 3.7 | 2.0 |
Jan 2008 | 3.2 | 3.7 | 2.1 |
Feb 2008 | 3.0 | 3.7 | 2.1 |
Mar 2008 | 3.0 | 3.6 | 1.9 |
Apr 2008 | 2.8 | 3.6 | 2.1 |
May 2008 | 3.0 | 3.4 | 1.9 |
Jun 2008 | 2.7 | 3.6 | 1.9 |
Jul 2008 | 2.7 | 3.4 | 1.8 |
Aug 2008 | 2.6 | 3.4 | 1.8 |
Sep 2008 | 2.3 | 3.3 | 1.8 |
Oct 2008 | 2.4 | 3.3 | 1.7 |
Nov 2008 | 2.3 | 3.0 | 1.6 |
Dec 2008 | 2.3 | 3.2 | 1.5 |
Jan 2009 | 2.0 | 3.1 | 1.5 |
Feb 2009 | 2.1 | 3.0 | 1.5 |
Mar 2009 | 1.9 | 2.9 | 1.4 |
Apr 2009 | 1.7 | 2.9 | 1.3 |
May 2009 | 1.9 | 2.9 | 1.3 |
Jun 2009 | 1.9 | 2.8 | 1.3 |
Jul 2009 | 1.7 | 3.0 | 1.3 |
Aug 2009 | 1.8 | 2.9 | 1.2 |
Sep 2009 | 1.9 | 3.0 | 1.2 |
Oct 2009 | 1.8 | 3.0 | 1.3 |
Nov 2009 | 1.9 | 3.1 | 1.4 |
Dec 2009 | 1.9 | 3.1 | 1.4 |
Jan 2010 | 2.1 | 3.0 | 1.3 |
Feb 2010 | 2.0 | 3.0 | 1.4 |
Mar 2010 | 2.0 | 3.3 | 1.4 |
Apr 2010 | 2.4 | 3.2 | 1.5 |
May 2010 | 2.2 | 3.4 | 1.4 |
Jun 2010 | 2.1 | 3.1 | 1.5 |
Jul 2010 | 2.3 | 3.2 | 1.4 |
Aug 2010 | 2.2 | 3.1 | 1.4 |
Sep 2010 | 2.2 | 3.1 | 1.5 |
Oct 2010 | 2.4 | 3.2 | 1.4 |
Nov 2010 | 2.4 | 3.2 | 1.4 |
Dec 2010 | 2.3 | 3.3 | 1.5 |
Jan 2011 | 2.3 | 3.1 | 1.4 |
Feb 2011 | 2.4 | 3.2 | 1.5 |
Mar 2011 | 2.4 | 3.4 | 1.5 |
Apr 2011 | 2.4 | 3.3 | 1.4 |
May 2011 | 2.4 | 3.2 | 1.5 |
Jun 2011 | 2.6 | 3.3 | 1.5 |
Jul 2011 | 2.7 | 3.2 | 1.5 |
Aug 2011 | 2.5 | 3.3 | 1.5 |
Sep 2011 | 2.8 | 3.3 | 1.5 |
Oct 2011 | 2.7 | 3.3 | 1.5 |
Nov 2011 | 2.6 | 3.3 | 1.5 |
Dec 2011 | 2.8 | 3.3 | 1.5 |
Jan 2012 | 2.8 | 3.3 | 1.5 |
Feb 2012 | 2.6 | 3.4 | 1.6 |
Mar 2012 | 2.9 | 3.4 | 1.6 |
Apr 2012 | 2.8 | 3.3 | 1.6 |
May 2012 | 2.8 | 3.4 | 1.6 |
Jun 2012 | 2.8 | 3.3 | 1.6 |
Jul 2012 | 2.7 | 3.2 | 1.5 |
Aug 2012 | 2.8 | 3.3 | 1.5 |
Sep 2012 | 2.8 | 3.2 | 1.4 |
Oct 2012 | 2.7 | 3.3 | 1.5 |
Nov 2012 | 2.8 | 3.3 | 1.5 |
Dec 2012 | 2.9 | 3.3 | 1.5 |
Jan 2013 | 2.8 | 3.3 | 1.7 |
Feb 2013 | 2.9 | 3.4 | 1.7 |
Mar 2013 | 2.9 | 3.2 | 1.6 |
Apr 2013 | 2.9 | 3.4 | 1.7 |
May 2013 | 3.0 | 3.4 | 1.6 |
Jun 2013 | 3.0 | 3.3 | 1.6 |
Jul 2013 | 2.8 | 3.3 | 1.7 |
Aug 2013 | 2.9 | 3.5 | 1.7 |
Sep 2013 | 2.9 | 3.5 | 1.7 |
Oct 2013 | 3.0 | 3.3 | 1.7 |
Nov 2013 | 2.9 | 3.4 | 1.7 |
Dec 2013 | 2.9 | 3.4 | 1.7 |
Jan 2014 | 2.9 | 3.4 | 1.7 |
Feb 2014 | 3.1 | 3.4 | 1.8 |
Mar 2014 | 3.1 | 3.5 | 1.8 |
Apr 2014 | 3.2 | 3.5 | 1.8 |
May 2014 | 3.3 | 3.5 | 1.8 |
Jun 2014 | 3.5 | 3.5 | 1.8 |
Jul 2014 | 3.4 | 3.6 | 1.9 |
Aug 2014 | 3.7 | 3.5 | 1.8 |
Sep 2014 | 3.4 | 3.7 | 2.0 |
Oct 2014 | 3.5 | 3.7 | 1.9 |
Nov 2014 | 3.3 | 3.6 | 1.9 |
Dec 2014 | 3.5 | 3.7 | 1.8 |
Jan 2015 | 3.7 | 3.6 | 2.0 |
Feb 2015 | 3.7 | 3.6 | 1.9 |
Mar 2015 | 3.6 | 3.6 | 2.0 |
Apr 2015 | 3.8 | 3.7 | 1.9 |
May 2015 | 3.8 | 3.6 | 1.9 |
Jun 2015 | 3.6 | 3.6 | 1.9 |
Jul 2015 | 4.1 | 3.6 | 1.9 |
Aug 2015 | 3.7 | 3.6 | 2.0 |
Sep 2015 | 3.7 | 3.7 | 2.0 |
Oct 2015 | 3.9 | 3.7 | 2.0 |
Nov 2015 | 3.8 | 3.8 | 2.0 |
Dec 2015 | 3.9 | 3.9 | 2.1 |
Jan 2016 | 4.0 | 3.6 | 2.0 |
Feb 2016 | 3.9 | 3.8 | 2.1 |
Mar 2016 | 4.1 | 3.7 | 2.0 |
Apr 2016 | 3.9 | 3.7 | 2.1 |
May 2016 | 3.9 | 3.6 | 2.1 |
Jun 2016 | 3.8 | 3.7 | 2.1 |
Jul 2016 | 4.0 | 3.8 | 2.1 |
Aug 2016 | 3.8 | 3.7 | 2.1 |
Sep 2016 | 3.9 | 3.7 | 2.1 |
Oct 2016 | 3.7 | 3.6 | 2.1 |
Nov 2016 | 4.0 | 3.7 | 2.1 |
Dec 2016 | 3.9 | 3.7 | 2.1 |
Jan 2017 | 3.7 | 3.8 | 2.2 |
Feb 2017 | 3.9 | 3.7 | 2.1 |
Mar 2017 | 3.8 | 3.7 | 2.2 |
Apr 2017 | 4.0 | 3.6 | 2.1 |
May 2017 | 3.8 | 3.7 | 2.1 |
Jun 2017 | 4.1 | 3.9 | 2.2 |
Jul 2017 | 4.1 | 3.8 | 2.1 |
Aug 2017 | 4.1 | 3.8 | 2.1 |
Sep 2017 | 4.1 | 3.7 | 2.2 |
Oct 2017 | 4.2 | 3.8 | 2.2 |
Nov 2017 | 4.1 | 3.7 | 2.1 |
Dec 2017 | 4.1 | 3.7 | 2.2 |
Jan 2018 | 4.3 | 3.7 | 2.1 |
Feb 2018 | 4.3 | 3.8 | 2.2 |
Mar 2018 | 4.4 | 3.8 | 2.2 |
Apr 2018 | 4.4 | 3.8 | 2.3 |
May 2018 | 4.5 | 3.9 | 2.3 |
Jun 2018 | 4.7 | 3.9 | 2.3 |
Jul 2018 | 4.6 | 3.8 | 2.3 |
Aug 2018 | 4.6 | 3.9 | 2.3 |
Sep 2018 | 4.7 | 3.8 | 2.3 |
Oct 2018 | 4.7 | 3.9 | 2.3 |
Nov 2018 | 4.8 | 3.9 | 2.3 |
Dec 2018 | 4.7 | 3.8 | 2.3 |
Jan 2019 | 4.7 | 3.8 | 2.3 |
Feb 2019 | 4.5 | 3.8 | 2.4 |
Mar 2019 | 4.7 | 3.8 | 2.3 |
Apr 2019 | 4.6 | 4.0 | 2.3 |
May 2019 | 4.6 | 3.8 | 2.3 |
Jun 2019 | 4.5 | 3.8 | 2.3 |
Jul 2019 | 4.5 | 4.0 | 2.4 |
Aug 2019 | 4.5 | 3.9 | 2.4 |
Sep 2019 | 4.5 | 3.9 | 2.3 |
Oct 2019 | 4.6 | 3.8 | 2.3 |
Nov 2019 | 4.4 | 3.8 | 2.3 |
Dec 2019 | 4.2 | 3.9 | 2.3 |
Jan 2020 | 4.5 | 3.9 | 2.3 |
Feb 2020 | 4.4 | 3.9 | 2.2 |
Mar 2020 | 3.7 | 3.4 | 1.9 |
Apr 2020 | 3.4 | 3.0 | 1.6 |
May 2020 | 3.9 | 6.2 | 1.7 |
Jun 2020 | 4.2 | 5.6 | 1.9 |
Jul 2020 | 4.6 | 4.5 | 2.3 |
Aug 2020 | 4.4 | 4.6 | 2.1 |
Sep 2020 | 4.5 | 4.2 | 2.3 |
Oct 2020 | 4.6 | 4.2 | 2.4 |
Nov 2020 | 4.5 | 4.2 | 2.3 |
Dec 2020 | 4.5 | 3.8 | 2.4 |
Jan 2021 | 4.7 | 3.8 | 2.3 |
Feb 2021 | 5.0 | 4.0 | 2.4 |
Mar 2021 | 5.4 | 4.2 | 2.5 |
Apr 2021 | 6.0 | 4.2 | 2.8 |
May 2021 | 6.0 | 4.1 | 2.5 |
| Month | Total private | Leisure and hospitality |
|---|---|---|
Feb 2020 | 0.0% | 0.0% |
Mar 2020 | 1.1 | 0.3 |
Apr 2020 | 6.5 | 7.7 |
May 2020 | 5.4 | 4.3 |
Jun 2020 | 3.5 | 1.4 |
Jul 2020 | 3.1 | 0.2 |
Aug 2020 | 3.1 | 0.6 |
Sep 2020 | 2.9 | 0.6 |
Oct 2020 | 2.8 | 0.6 |
Nov 2020 | 3.0 | 0.3 |
Dec 2020 | 3.8 | 0.5 |
Jan 2021 | 3.5 | 0.6 |
Feb 2021 | 3.4 | 1.1 |
Mar 2021 | 2.7 | 1.8 |
Apr 2021 | 2.6 | 2.5 |
May 2021 | 2.4 | 2.9 |
Jun 2021 | 1.8 | 3.1 |
| Month | Job openings rate | Hires rate |
|---|---|---|
Dec 2000 | 4.5% | 7.4% |
Jan 2001 | 5.2 | 7.7 |
Feb 2001 | 4.8 | 7.3 |
Mar 2001 | 5.5 | 7.8 |
Apr 2001 | 4.6 | 8.3 |
May 2001 | 4.2 | 7.6 |
Jun 2001 | 3.6 | 7.2 |
Jul 2001 | 4.6 | 7.7 |
Aug 2001 | 4.3 | 7.2 |
Sep 2001 | 4.3 | 7.3 |
Oct 2001 | 3.0 | 6.9 |
Nov 2001 | 3.6 | 6.8 |
Dec 2001 | 3.5 | 6.8 |
Jan 2002 | 2.9 | 6.5 |
Feb 2002 | 3.3 | 6.9 |
Mar 2002 | 3.3 | 6.5 |
Apr 2002 | 3.1 | 6.9 |
May 2002 | 3.2 | 6.7 |
Jun 2002 | 2.8 | 6.6 |
Jul 2002 | 3.1 | 6.7 |
Aug 2002 | 3.2 | 6.9 |
Sep 2002 | 2.8 | 6.7 |
Oct 2002 | 3.1 | 6.5 |
Nov 2002 | 3.2 | 6.6 |
Dec 2002 | 3.0 | 6.8 |
Jan 2003 | 3.1 | 7.0 |
Feb 2003 | 2.9 | 6.6 |
Mar 2003 | 2.8 | 6.4 |
Apr 2003 | 3.0 | 6.5 |
May 2003 | 3.4 | 7.0 |
Jun 2003 | 3.4 | 6.7 |
Jul 2003 | 2.7 | 6.4 |
Aug 2003 | 3.1 | 6.7 |
Sep 2003 | 3.1 | 6.8 |
Oct 2003 | 3.6 | 6.9 |
Nov 2003 | 3.4 | 6.8 |
Dec 2003 | 3.5 | 7.1 |
Jan 2004 | 3.5 | 6.8 |
Feb 2004 | 3.6 | 6.9 |
Mar 2004 | 3.4 | 7.3 |
Apr 2004 | 3.2 | 7.1 |
May 2004 | 3.3 | 7.2 |
Jun 2004 | 3.6 | 7.0 |
Jul 2004 | 4.0 | 7.0 |
Aug 2004 | 3.6 | 7.0 |
Sep 2004 | 4.0 | 7.2 |
Oct 2004 | 3.7 | 6.9 |
Nov 2004 | 3.3 | 7.0 |
Dec 2004 | 3.6 | 6.8 |
Jan 2005 | 4.1 | 7.2 |
Feb 2005 | 4.0 | 6.9 |
Mar 2005 | 4.2 | 7.2 |
Apr 2005 | 4.7 | 7.0 |
May 2005 | 4.0 | 6.8 |
Jun 2005 | 4.3 | 7.3 |
Jul 2005 | 4.0 | 7.2 |
Aug 2005 | 3.8 | 7.3 |
Sep 2005 | 3.6 | 7.2 |
Oct 2005 | 3.8 | 6.8 |
Nov 2005 | 3.9 | 7.2 |
Dec 2005 | 4.4 | 7.1 |
Jan 2006 | 4.7 | 7.2 |
Feb 2006 | 4.4 | 7.4 |
Mar 2006 | 4.1 | 7.2 |
Apr 2006 | 4.9 | 7.1 |
May 2006 | 4.0 | 7.1 |
Jun 2006 | 4.0 | 7.2 |
Jul 2006 | 4.3 | 7.3 |
Aug 2006 | 4.2 | 6.8 |
Sep 2006 | 4.2 | 6.6 |
Oct 2006 | 4.3 | 7.1 |
Nov 2006 | 4.4 | 7.5 |
Dec 2006 | 4.2 | 7.0 |
Jan 2007 | 3.7 | 6.9 |
Feb 2007 | 4.0 | 6.9 |
Mar 2007 | 4.5 | 6.8 |
Apr 2007 | 4.0 | 7.2 |
May 2007 | 4.2 | 7.0 |
Jun 2007 | 4.5 | 7.2 |
Jul 2007 | 4.5 | 6.8 |
Aug 2007 | 4.5 | 7.0 |
Sep 2007 | 4.8 | 6.7 |
Oct 2007 | 4.3 | 6.9 |
Nov 2007 | 4.5 | 6.7 |
Dec 2007 | 4.1 | 6.6 |
Jan 2008 | 4.1 | 6.3 |
Feb 2008 | 3.9 | 6.8 |
Mar 2008 | 4.1 | 6.2 |
Apr 2008 | 3.9 | 6.3 |
May 2008 | 3.9 | 6.7 |
Jun 2008 | 3.4 | 5.9 |
Jul 2008 | 3.2 | 6.0 |
Aug 2008 | 3.1 | 6.2 |
Sep 2008 | 3.0 | 5.9 |
Oct 2008 | 3.0 | 5.8 |
Nov 2008 | 2.6 | 5.3 |
Dec 2008 | 2.6 | 5.6 |
Jan 2009 | 1.8 | 5.4 |
Feb 2009 | 2.4 | 5.2 |
Mar 2009 | 2.0 | 4.8 |
Apr 2009 | 2.0 | 4.7 |
May 2009 | 2.2 | 5.2 |
Jun 2009 | 2.1 | 4.8 |
Jul 2009 | 1.9 | 4.7 |
Aug 2009 | 1.5 | 5.0 |
Sep 2009 | 2.1 | 4.8 |
Oct 2009 | 2.0 | 4.7 |
Nov 2009 | 2.1 | 5.3 |
Dec 2009 | 2.0 | 5.0 |
Jan 2010 | 2.1 | 5.1 |
Feb 2010 | 2.0 | 4.7 |
Mar 2010 | 1.8 | 5.2 |
Apr 2010 | 2.1 | 5.2 |
May 2010 | 2.3 | 4.9 |
Jun 2010 | 2.5 | 4.9 |
Jul 2010 | 2.4 | 5.1 |
Aug 2010 | 2.7 | 4.9 |
Sep 2010 | 2.4 | 5.1 |
Oct 2010 | 3.1 | 5.0 |
Nov 2010 | 2.4 | 5.0 |
Dec 2010 | 2.6 | 5.1 |
Jan 2011 | 2.7 | 4.9 |
Feb 2011 | 2.9 | 5.1 |
Mar 2011 | 2.9 | 5.8 |
Apr 2011 | 2.4 | 5.1 |
May 2011 | 2.3 | 4.9 |
Jun 2011 | 3.0 | 5.5 |
Jul 2011 | 2.6 | 5.4 |
Aug 2011 | 2.8 | 5.4 |
Sep 2011 | 3.1 | 5.6 |
Oct 2011 | 3.1 | 5.5 |
Nov 2011 | 3.1 | 5.9 |
Dec 2011 | 3.2 | 5.5 |
Jan 2012 | 3.2 | 5.7 |
Feb 2012 | 2.7 | 5.7 |
Mar 2012 | 3.2 | 6.3 |
Apr 2012 | 3.4 | 5.5 |
May 2012 | 3.2 | 5.4 |
Jun 2012 | 3.4 | 5.3 |
Jul 2012 | 3.4 | 5.5 |
Aug 2012 | 3.0 | 5.8 |
Sep 2012 | 3.0 | 5.2 |
Oct 2012 | 3.4 | 5.5 |
Nov 2012 | 3.5 | 5.2 |
Dec 2012 | 3.3 | 5.8 |
Jan 2013 | 3.2 | 5.7 |
Feb 2013 | 3.6 | 5.6 |
Mar 2013 | 3.5 | 5.7 |
Apr 2013 | 3.3 | 6.1 |
May 2013 | 3.2 | 5.7 |
Jun 2013 | 3.3 | 5.7 |
Jul 2013 | 3.4 | 5.5 |
Aug 2013 | 3.5 | 5.4 |
Sep 2013 | 3.7 | 5.8 |
Oct 2013 | 3.6 | 5.6 |
Nov 2013 | 3.6 | 5.5 |
Dec 2013 | 3.9 | 5.5 |
Jan 2014 | 4.0 | 5.8 |
Feb 2014 | 3.7 | 5.9 |
Mar 2014 | 3.8 | 5.7 |
Apr 2014 | 4.3 | 5.9 |
May 2014 | 4.6 | 6.1 |
Jun 2014 | 4.4 | 6.2 |
Jul 2014 | 4.1 | 6.0 |
Aug 2014 | 4.6 | 5.8 |
Sep 2014 | 4.6 | 6.2 |
Oct 2014 | 4.3 | 6.0 |
Nov 2014 | 4.1 | 6.1 |
Dec 2014 | 4.5 | 6.3 |
Jan 2015 | 5.1 | 6.1 |
Feb 2015 | 4.8 | 6.2 |
Mar 2015 | 4.6 | 6.1 |
Apr 2015 | 4.6 | 6.3 |
May 2015 | 4.4 | 6.4 |
Jun 2015 | 4.2 | 6.1 |
Jul 2015 | 4.8 | 6.3 |
Aug 2015 | 4.4 | 6.7 |
Sep 2015 | 4.4 | 6.7 |
Oct 2015 | 4.9 | 6.6 |
Nov 2015 | 4.7 | 6.7 |
Dec 2015 | 4.6 | 6.8 |
Jan 2016 | 4.7 | 6.2 |
Feb 2016 | 4.7 | 6.8 |
Mar 2016 | 5.1 | 6.6 |
Apr 2016 | 4.7 | 6.5 |
May 2016 | 4.6 | 6.6 |
Jun 2016 | 4.8 | 6.7 |
Jul 2016 | 4.6 | 6.6 |
Aug 2016 | 4.9 | 6.6 |
Sep 2016 | 4.5 | 6.1 |
Oct 2016 | 4.6 | 6.2 |
Nov 2016 | 4.6 | 6.7 |
Dec 2016 | 4.5 | 6.4 |
Jan 2017 | 4.4 | 6.5 |
Feb 2017 | 5.3 | 6.4 |
Mar 2017 | 4.5 | 6.3 |
Apr 2017 | 5.0 | 6.4 |
May 2017 | 5.0 | 6.3 |
Jun 2017 | 5.0 | 6.5 |
Jul 2017 | 5.1 | 6.3 |
Aug 2017 | 5.2 | 6.2 |
Sep 2017 | 4.5 | 6.1 |
Oct 2017 | 4.8 | 6.5 |
Nov 2017 | 5.2 | 6.3 |
Dec 2017 | 5.2 | 6.1 |
Jan 2018 | 5.4 | 6.3 |
Feb 2018 | 5.4 | 6.5 |
Mar 2018 | 5.4 | 6.4 |
Apr 2018 | 5.6 | 6.5 |
May 2018 | 5.6 | 6.9 |
Jun 2018 | 6.1 | 6.4 |
Jul 2018 | 5.9 | 6.8 |
Aug 2018 | 5.8 | 6.5 |
Sep 2018 | 6.1 | 6.4 |
Oct 2018 | 5.8 | 6.7 |
Nov 2018 | 5.8 | 6.5 |
Dec 2018 | 6.2 | 6.3 |
Jan 2019 | 6.4 | 6.8 |
Feb 2019 | 5.7 | 6.6 |
Mar 2019 | 5.8 | 6.7 |
Apr 2019 | 5.8 | 7.1 |
May 2019 | 5.8 | 6.6 |
Jun 2019 | 5.4 | 7.0 |
Jul 2019 | 5.5 | 6.9 |
Aug 2019 | 5.4 | 6.9 |
Sep 2019 | 5.7 | 6.9 |
Oct 2019 | 5.6 | 6.6 |
Nov 2019 | 5.5 | 6.5 |
Dec 2019 | 5.2 | 6.8 |
Jan 2020 | 5.2 | 6.6 |
Feb 2020 | 5.3 | 6.5 |
Mar 2020 | 3.9 | 4.2 |
Apr 2020 | 3.8 | 4.9 |
May 2020 | 6.8 | 19.5 |
Jun 2020 | 7.0 | 17.5 |
Jul 2020 | 6.3 | 10.6 |
Aug 2020 | 6.0 | 8.1 |
Sep 2020 | 5.9 | 8.2 |
Oct 2020 | 6.1 | 8.5 |
Nov 2020 | 5.9 | 8.1 |
Dec 2020 | 5.4 | 5.8 |
Jan 2021 | 5.3 | 7.1 |
Feb 2021 | 6.5 | 8.8 |
Mar 2021 | 8.0 | 8.5 |
Apr 2021 | 9.1 | 9.5 |
May 2021 | 9.0 | 9.3 |