
Labor productivity, a key measure of the health of the U.S. economy, had been rising steadily but slowly throughout the 2010s—just over one percent per year on average. But what happens when the economy is thrown into a sudden decline by an unprecedented shock? COVID-19 landed in the United States in the early months of 2020, and it did not take long for its effects on productivity to hit hard and fast.
First, some background. Labor productivity is the ratio of real output to hours worked. Productivity increases when the output of goods and services increases faster than the amount of labor needed to produce the goods and provide the services. Productivity growth is often thought to show that businesses are becoming more efficient and profitable, but the path to positive productivity is not always desirable. Productivity may also increase when output falls but hours worked fall faster.
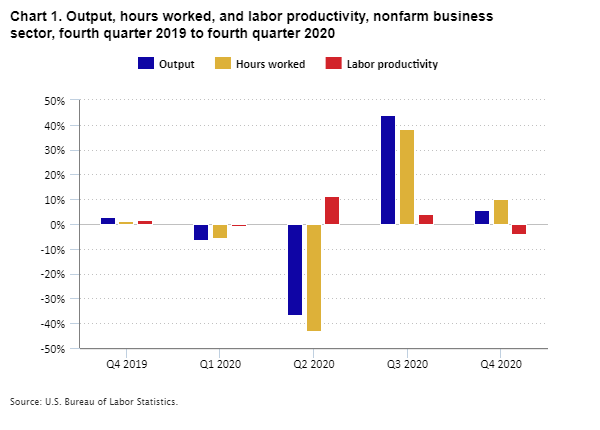
During 2020, two distinct paths yielded positive productivity growth. From the first quarter to the second quarter of 2020, hours worked decreased more than output. We can think of this path as businesses rapidly cutting hours and employment faster than output fell. Conversely, in the third quarter of 2020, the economy began to rebound, and the increase in demand for goods and services outpaced the rising labor hours, also resulting in positive labor productivity growth. (See chart 1).
When looking at the growth rates for output, hours worked, and productivity, we annualize the numbers, meaning these are the growth rates we would observe if the change in a quarter were to continue at that rate for an entire year. The data presented here are for the nonfarm business sector, covering about three-fourths of the U.S. economy, from the end of 2019 to the end of 2020. Although we report labor productivity measures quarterly, we incorporated higher frequency data to more accurately capture the rapid changes resulting from the COVID-19 pandemic.
Editor’s note: Data for this chart are available in the table below.
First Quarter 2020, Pandemic on the Horizon
Although the COVID-19 pandemic began during the first quarter of 2020, data from January and February were not significantly affected by the pandemic; business closures and job losses didn’t occur until the latter part of March. Since only one out of three months in the first quarter was affected, the decreases were modest compared to what was to come in the second quarter. Nevertheless, both output (-6.4 percent) and hours worked (-5.6 percent) declined in the first quarter, the first decreases since the second quarter of 2009. The declines in first quarter 2020 were an early sign of the drastic decreases we were about to see. While labor productivity declined only 0.8 percent at an annual rate in the first quarter, this was the first decline in labor productivity since the second quarter of 2017.
Second Quarter 2020, COVID-19 Rears Its Ugly Head
The second quarter of 2020 saw historically large decreases in both output and hours worked. Our measures of nonfarm business began in 1947, and the second quarter of 2020 had the largest declines ever recorded in both output (-36.8 percent) and hours worked (-43.2 percent). While the resulting labor productivity growth of 11.1 percent was the largest increase since the first quarter of 1971 (12.3 percent), the large increase in second quarter 2020 resulted from the devastation of the U.S. economy in terms of both employment and output.
How can productivity grow at near a record rate with such large declines in output and hours worked? Remember the different paths to positive labor productivity. Many consumers avoided stores, restaurants, and other public gatherings to reduce the risk of catching or spreading the virus that causes COVID-19. With shutdowns of nonessential businesses and limited contact and other restrictions for businesses still opened, businesses had to adapt quickly to reduce work hours while trying to preserve output. For example, many eating establishments focused on carryout and outdoor seating to limit their revenue loss. Additionally, online buying and home delivery became more widespread. The data from the second quarter show hours worked fell faster than output, resulting in productivity growth.
Third Quarter 2020, the Road to Recovery
By the third quarter of 2020, both output and hours worked began to climb again and in a big way. Many more businesses had shifted operations online or tried to bring workers back and resume normal operations. Following the historically large declines in the second quarter, we saw historically large increases in the third quarter in both output (44.1 percent) and hours worked (38.3 percent). With output recovering more quickly than hours worked, labor productivity grew by a robust 4.2 percent.
The automotive industry is one that highlights the jumpstart to recovery. In the second quarter, automotive production factories stopped almost entirely, resulting in output and hours worked plummeting. Once they started to reopen in the third quarter, both hours worked and output rebounded. While the third quarter outcome was positive, both output and hours worked still had not returned to their values before the pandemic, meaning much more work remained to fully recover. It is important to remember nonfarm employment at the end of the third quarter was still 10.7 million below the level at the start of the pandemic.
Fourth Quarter 2020, on the Right Track
The fourth quarter continued the large growth for both output (5.5 percent) and hours worked (10.1 percent). This quarter shows how negative productivity is not always a negative thing. In this case, hours worked outpaced output growth, leading to a productivity decline.
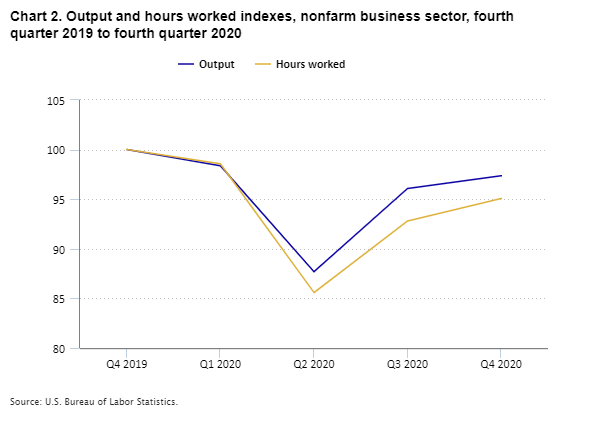
When we look over the past year, we see that we are digging out of the huge decline in the second quarter of 2020. The fourth quarter of 2020 was the second straight increase in both hours and output. In the fourth quarter of 2020, output was only 2.6 percent below the level a year earlier, and hours worked were 4.9 percent below. (See chart 2). After the labor productivity rollercoaster ride of 2020, the fourth quarter data suggest things may be on a path to normalcy.
Editor’s note: Data for this chart are available in the table below.
Pandemic in Perspective
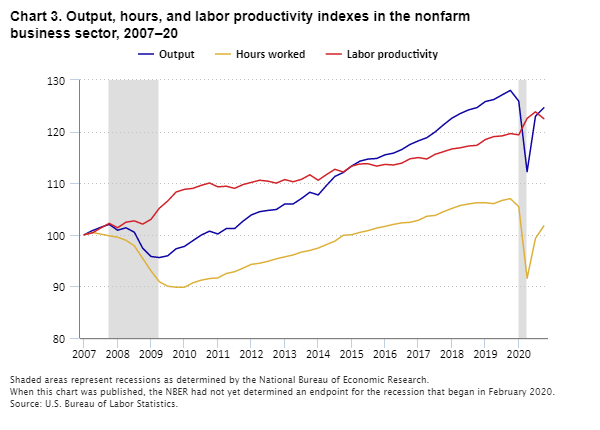
So how does productivity in a pandemic compare with other major economic events like the Great Recession? From 2007 to 2009, both output and hours worked declined (see chart 3), as the U.S. economy endured a period known as the “Great Recession.” (To learn more, see “Below Trend: the U.S. productivity slowdown since the Great Recession.”) In 2020, both output and hours worked declined at the start of the pandemic. The wild changes from quarter to quarter during the rest of the year were unprecedented, even for an economic downturn. Over the past decade, the movements in output, hours, and productivity were usually small, making 2020 even more unusual.
The last time productivity growth was close to what it was in the second quarter of 2020 was in the second quarter of 2009. Labor productivity typically spikes at the start of an economic recovery because output rises faster than businesses can restore hours. In both the Great Recession and the 2020 pandemic, the magnitude of the changes in output and hours worked were larger than usual. In the Great Recession it took several quarters to see gains in hours worked, whereas 2020 saw a faster turnaround as businesses began to reopen and government restrictions eased in the third quarter. In fact, hours worked in the fourth quarter of 2020 grew faster than output, causing productivity to decline.
Editor’s note: Data for this chart are available in the table below.
BLS labor productivity data help us study efficiencies and the economic well-being of the country. Positive labor productivity isn’t always positive. The components that make up the labor productivity measure—output and hours worked—should not be examined alone but rather together to fully understand productivity’s effect on economic growth.
During unprecedented events like the COVID-19 pandemic, historical trends in productivity can provide important context into the economic environment. We at BLS, like many of you, will be very interested to see how the economy recovers and what that will mean for productivity and the economy.
Want to Learn More?
To dive into the data for yourself, check out the BLS webpages on labor productivity. Get the most recent news release to see the data firsthand! Check out Productivity 101 and our video “What is Productivity?” to learn more about the concepts of productivity.
If you have a specific question, you might find it answered in our Frequently Asked Questions. Or you can always contact our staff by email or call (202) 691-5606.
| Quarter | Output | Hours worked | Labor productivity |
|---|---|---|---|
Q4 2019 | 2.8% | 1.3% | 1.5% |
Q1 2020 | -6.4 | -5.6 | -0.8 |
Q2 2020 | -36.8 | -43.2 | 11.1 |
Q3 2020 | 44.1 | 38.3 | 4.2 |
Q4 2020 | 5.5 | 10.1 | -4.2 |
| Quarter | Output | Hours worked |
|---|---|---|
Q4 2019 | 100.000 | 100.000 |
Q1 2020 | 98.369 | 98.573 |
Q2 2020 | 87.695 | 85.589 |
Q3 2020 | 96.082 | 92.810 |
Q4 2020 | 97.366 | 95.067 |
| Quarter | Output | Hours worked | Labor productivity |
|---|---|---|---|
Q1 2007 | 100.000 | 100.000 | 100.000 |
Q2 2007 | 100.820 | 100.442 | 100.377 |
Q3 2007 | 101.464 | 100.134 | 101.329 |
Q4 2007 | 102.015 | 99.802 | 102.217 |
Q1 2008 | 100.886 | 99.531 | 101.361 |
Q2 2008 | 101.363 | 98.944 | 102.444 |
Q3 2008 | 100.502 | 97.862 | 102.698 |
Q4 2008 | 97.409 | 95.434 | 102.069 |
Q1 2009 | 95.795 | 93.004 | 103.002 |
Q2 2009 | 95.592 | 90.900 | 105.161 |
Q3 2009 | 95.935 | 90.031 | 106.559 |
Q4 2009 | 97.296 | 89.843 | 108.295 |
Q1 2010 | 97.752 | 89.839 | 108.808 |
Q2 2010 | 98.851 | 90.689 | 108.999 |
Q3 2010 | 99.941 | 91.205 | 109.579 |
Q4 2010 | 100.708 | 91.521 | 110.038 |
Q1 2011 | 100.167 | 91.652 | 109.291 |
Q2 2011 | 101.202 | 92.496 | 109.412 |
Q3 2011 | 101.200 | 92.842 | 109.001 |
Q4 2011 | 102.638 | 93.537 | 109.730 |
Q1 2012 | 103.849 | 94.272 | 110.158 |
Q2 2012 | 104.483 | 94.492 | 110.573 |
Q3 2012 | 104.727 | 94.868 | 110.392 |
Q4 2012 | 104.905 | 95.356 | 110.013 |
Q1 2013 | 105.969 | 95.726 | 110.700 |
Q2 2013 | 105.976 | 96.095 | 110.282 |
Q3 2013 | 107.035 | 96.647 | 110.748 |
Q4 2013 | 108.242 | 96.967 | 111.628 |
Q1 2014 | 107.726 | 97.426 | 110.573 |
Q2 2014 | 109.572 | 98.110 | 111.682 |
Q3 2014 | 111.314 | 98.777 | 112.692 |
Q4 2014 | 112.070 | 99.904 | 112.177 |
Q1 2015 | 113.326 | 100.020 | 113.302 |
Q2 2015 | 114.278 | 100.471 | 113.742 |
Q3 2015 | 114.683 | 100.817 | 113.753 |
Q4 2015 | 114.787 | 101.306 | 113.307 |
Q1 2016 | 115.503 | 101.635 | 113.645 |
Q2 2016 | 115.821 | 102.017 | 113.531 |
Q3 2016 | 116.522 | 102.310 | 113.891 |
Q4 2016 | 117.514 | 102.419 | 114.738 |
Q1 2017 | 118.213 | 102.823 | 114.966 |
Q2 2017 | 118.819 | 103.599 | 114.691 |
Q3 2017 | 119.944 | 103.754 | 115.605 |
Q4 2017 | 121.319 | 104.488 | 116.108 |
Q1 2018 | 122.600 | 105.109 | 116.642 |
Q2 2018 | 123.497 | 105.680 | 116.859 |
Q3 2018 | 124.208 | 105.970 | 117.211 |
Q4 2018 | 124.648 | 106.228 | 117.341 |
Q1 2019 | 125.823 | 106.216 | 118.459 |
Q2 2019 | 126.204 | 106.032 | 119.025 |
Q3 2019 | 127.104 | 106.663 | 119.165 |
Q4 2019 | 127.990 | 107.000 | 119.617 |
Q1 2020 | 125.902 | 105.474 | 119.369 |
Q2 2020 | 112.241 | 91.580 | 122.561 |
Q3 2020 | 122.975 | 99.306 | 123.833 |
Q4 2020 | 124.619 | 101.722 | 122.510 |