
My thanks to BLS economist Jill Janocha Redmond for her help with this blog.
The history of baseball is all about numbers, and a few baseball numbers—62 and 700—have gotten a lot of attention recently. (Aaron Judge of the Yankees hit a whopping 62 home runs during the 2022 season, and Albert Pujols of the Cardinals passed the milestone of 700 home runs in his career before he retires.) As we settle in to watch the remaining teams vie for the ultimate title, it’s interesting to notice how the emphasis on baseball numbers has changed over time. There are simple numbers, like batting average, with a long history. How many youngsters improved their long division skills by poring over the box scores in the morning paper? But today there are more complex numbers, like on-base plus slugging (OPS), which might require some explaining and some computing skills. Likewise, BLS has both simple and complex numbers, each demonstrating different aspects of economic activity. Let’s look at both.
World Series records
We looked at the record books to check out batting average and OPS for the World Series. The focus here is on single-season records, trying to avoid any bias as some players (and teams) had many World Series appearances, while others had few. Is there a connection between those players with the best World Series batting average and those with the best OPS?
As a reminder, batting average is hits divided by at bats. Major League Baseball describes batting average as “one of the oldest and most universal tools to measure a hitter’s success at the plate.” There are details, such as “at bats” don’t include walks or sacrifices. But let’s try to keep things simple. OPS is the sum of on-base percentage (how frequently a batter reaches base per plate appearance) and slugging percentage (total bases per at bat). As indicated, things get complicated pretty fast. Major League Baseball says OPS “is meant to combine how well a hitter can reach base, and how well he can hit for average and for power.” Take a look at the top 5 in each category.
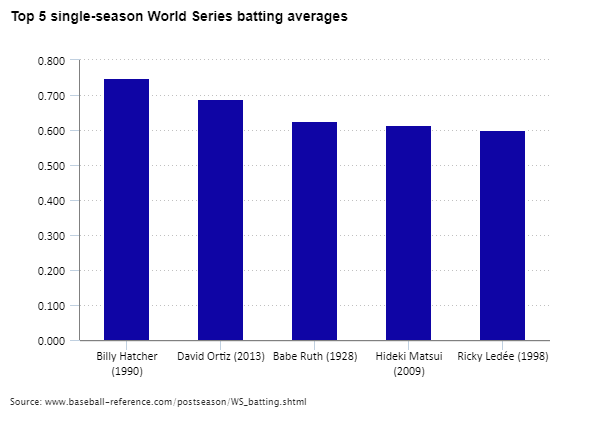
Editor’s note: Data for this chart are available in the table below.
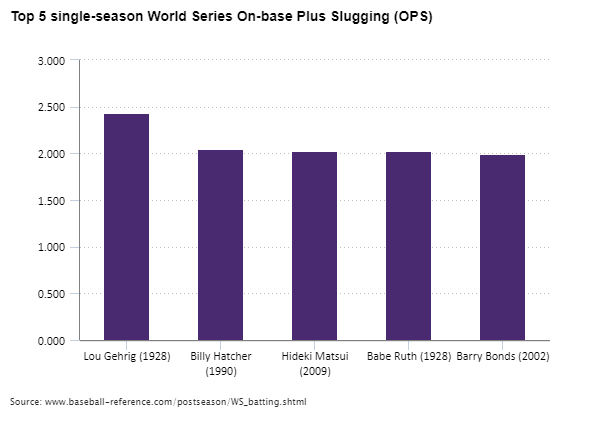
Editor’s note: Data for this chart are available in the table below.
The first thing you notice is that these numbers go back more than a century, as the long tradition of baseball numbers just grows and grows. Also notice that there is much overlap between the lists; 3 out of 5 players show up on both charts. In each case, a fourth player shows up in the top 10 (Gehrig is number 10 in batting average and Ortiz is number 7 in OPS), while only one player in each category is not in the top 10 (Bonds in batting average and LedÉe in OPS). This suggests a substantial relationship between the tried-and-true statistic and the upstart, complex number. Is the same true at BLS?
Productivity statistics
BLS has been providing measures of productivity in the U.S. economy since the end of World War II. Our headline measure looks at labor productivity in the nonfarm business sector. Like a batting average, labor productivity is a simple calculation: output divided by hours worked. It is doubtful that youngsters are practicing their long division on these numbers, and, in fact, the calculation is not quite so simple. There are multiple data sources and multiple adjustments needed to ensure consistency among the components. Nonetheless, labor productivity is the traditional, easier-to-understand measure.
The OPS of productivity statistics is Total Factor Productivity, which we call TFP for short. TFP compares output to the combined inputs of labor and capital. Capital includes things like machinery, buildings, and software. Labor includes hours worked and an adjustment to capture skill of the workers, which we call labor composition. For the math geeks among us, total factor productivity starts with the hours worked from the labor productivity measures and adjusts for changes in capital and labor composition over time.
Much like our baseball statistics, the question is what is the relationship between labor productivity and total factor productivity? Let’s look at some data. They are similar, like our baseball statistics, but have key differences.
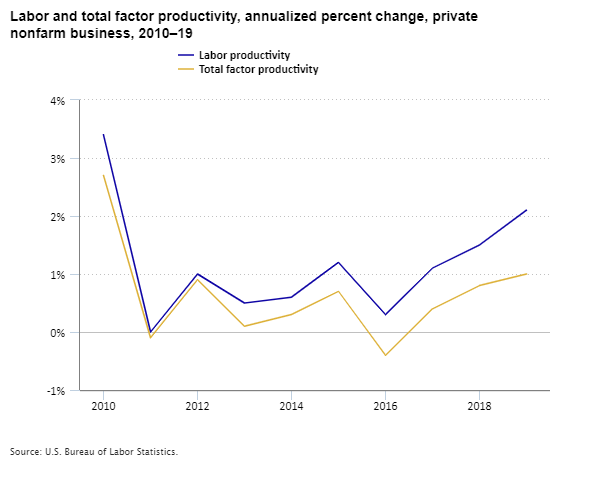
Editor’s note: Data for this chart are available in the table below.
Looking at the trend lines for the 2010 decade, there is a clear relationship between labor productivity and TFP. The lines seem identical for a couple of years, and where they diverge, they continue in the same direction. The trends are the same as they are using the same output and base of hours, but then TFP takes that and adjusts hours, and measures a few other things. We would expect TFP to be a lower line because it accounts for more of what’s going into production, and thus the difference between outputs and inputs is going to be less.
Labor productivity and total factor productivity aim to measure how much input it takes to create the output of the economy. In the case of labor productivity, we only look at hours worked compared to output, and the difference (what we didn’t measure) is labor productivity. In total factor productivity, we measure both labor (hours and composition adjustment) and capital. We can show both inputs in terms of how they create the output. If productivity increases, the economy has become more efficient.
To take it a step further, we can express total factor productivity as a part of labor productivity, as seen in the next chart.
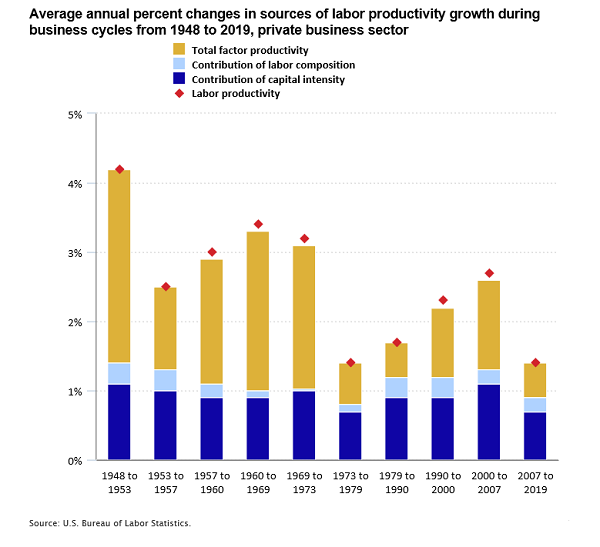
Editor’s note: Data for this chart are available in the table below.
Here we see variations over each business cycle dating back 70 years. Over time, capital intensity and labor composition are pretty stable in terms of contributing to labor productivity growth. Innovations and improvements—what we measure with total factor productivity—are the most important determinant in labor productivity growth.
For those who can’t get enough data and want to know more about productivity, be sure to see our productivity page. For more about baseball, try the internet. Like baseball, you can always get more complex—wins above replacement (WAR) anyone? If you start looking at TFP data by industry, it gets even more complex as we measure more inputs. To learn more about that complexity, see my blog on Expanding BLS Data on Total Factor Productivity.
One thing we don’t measure at BLS is the productivity of baseball players. For that, you’ll have to settle in for the Fall Classic. Enjoy!
| Player | Batting average |
|---|---|
Billy Hatcher (1990) | 0.750 |
David Ortiz (2013) | 0.688 |
Babe Ruth (1928) | 0.625 |
Hideki Matsui (2009) | 0.615 |
Ricky LedÉe (1998) | 0.600 |
| Player | OPS |
|---|---|
Lou Gehrig (1928) | 2.433 |
Billy Hatcher (1990) | 2.050 |
Hideki Matsui (2009) | 2.027 |
Babe Ruth (1928) | 2.022 |
Barry Bonds (2002) | 1.994 |
| Year | Labor productivity | Total factor productivity |
|---|---|---|
2010 | 3.4 | 2.7 |
2011 | 0.0 | -0.1 |
2012 | 1.0 | 0.9 |
2013 | 0.5 | 0.1 |
2014 | 0.6 | 0.3 |
2015 | 1.2 | 0.7 |
2016 | 0.3 | -0.4 |
2017 | 1.1 | 0.4 |
2018 | 1.5 | 0.8 |
2019 | 2.1 | 1.0 |
| Business cycles | Total factor productivity | Contribution of labor composition | Contribution of capital intensity | Labor productivity |
|---|---|---|---|---|
1948 to 1953 | 2.8 | 0.3 | 1.1 | 4.2 |
1953 to 1957 | 1.2 | 0.3 | 1.0 | 2.5 |
1957 to 1960 | 1.8 | 0.2 | 0.9 | 3.0 |
1960 to 1969 | 2.3 | 0.1 | 0.9 | 3.4 |
1969 to 1973 | 2.1 | 0.0 | 1.0 | 3.2 |
1973 to 1979 | 0.6 | 0.1 | 0.7 | 1.4 |
1979 to 1990 | 0.5 | 0.3 | 0.9 | 1.7 |
1990 to 2000 | 1.0 | 0.3 | 0.9 | 2.3 |
2000 to 2007 | 1.3 | 0.2 | 1.1 | 2.7 |
2007 to 2019 | 0.5 | 0.2 | 0.7 | 1.4 |