Our data on multifactor productivity are getting a makeover. You’ll get the same great data but with a new name, “total factor productivity.” Why change the name if it’s the same data? To reach you! More web searches seek total factor productivity than multifactor productivity. That’s probably because most other countries, including our major trading partners, call it total factor productivity. We want to make it easier to find us and stop having to answer how multifactor productivity differs from total factor productivity. They’re the same thing!
Besides the name change, we will expand our annual release of trends in total factor productivity for manufacturing to include not only manufacturing, but all the major industries in the private sector. With this addition, total factor productivity measures for all private major industries of the economy will be available in our news release and the BLS database.
Back to Basics
For those new to productivity data, let’s back up a bit. What is productivity and why should we care about it?
Productivity is a measure of economic performance, often touted as the engine of a nation’s economic growth. Productivity compares the output of goods and services with the inputs used to produce them. The difference in growth rates between these two amounts—the unexplained portion—equals productivity growth. Productivity tells us how good we are at using the inputs to create the output.
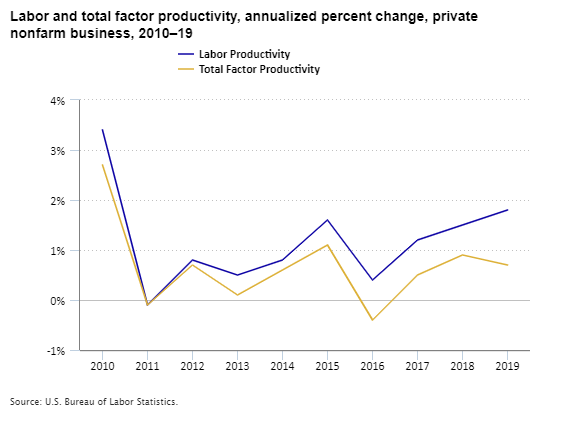
Productivity growth is important because, in the long run, it accounts for a third of the growth in a nation’s output. This growth supports increased wages, profits, public sector revenue, and global competitiveness. There are two types of productivity measures produced by BLS, labor productivity and total factor productivity. They are similar, as you can see in the chart below, but they have key differences.

Editor’s note: Data for this chart are available in the table below.
Much of the limelight goes to labor productivity, output per hour worked, which measures how many hours it takes to produce the goods and services in our economy. This measure is pretty simple to interpret and apply. If you used the same number of hours but produced more goods and services than last year, the economy became more efficient and labor productivity increased. Labor productivity increased because something besides worker hours (which we know stayed the same) contributed to the increased output. That something is productivity—the growth we didn’t account for in the calculation. With labor productivity, we only account for one input—hours worked. All the other inputs to production, like capital investment and materials, get lumped together into the unknown efficiency gains that can result from changes in technology or how work is organized.
This is where total factor productivity comes in. As the name suggests, total factor productivity measures more than just labor as an input to producing goods and services. It puts more “knowns” into the equation to help us pinpoint a more detailed story of why productivity is changing. For an industry, total factor productivity measures the output produced by a combined set of inputs: capital, labor, energy, materials, and purchased services. Total factor productivity tells us how much more output can be produced without increasing any of these inputs. The more efficiently an industry uses its inputs to create output, the faster total factor productivity will grow.
Total factor productivity gives us great insight into what drives economic growth. Is it the industries’ choice of capital investment? Better or more skilled labor? Or is it a change to the other factors of production, such as energy expenditures, materials consumed, or services purchased, or more efficient use of these inputs? The more detail with which we measure an industry, the more we can learn how these choices contribute to growth in this industry and ultimately our economy.
Let’s recap what we know:
Total factor productivity = output ÷ (combined inputs of capital, labor, energy, materials, and services)
And if we rearrange this equation and transform it to growth over time, we can see that increasing total factor productivity is a way to increase our nation’s output growth.
Output growth = total factor productivity growth + combined inputs growth
More is More
Previously, the annual release on Multifactor Productivity Trends in Manufacturing brought you information on the manufacturing sector and its 19 detailed industries. The manufacturing sector has often been a pioneer of technological development that drives productivity growth and is thus an important sector of the nation’s economy. You can see just how big of a role it has played in productivity growth in The Economics Daily.
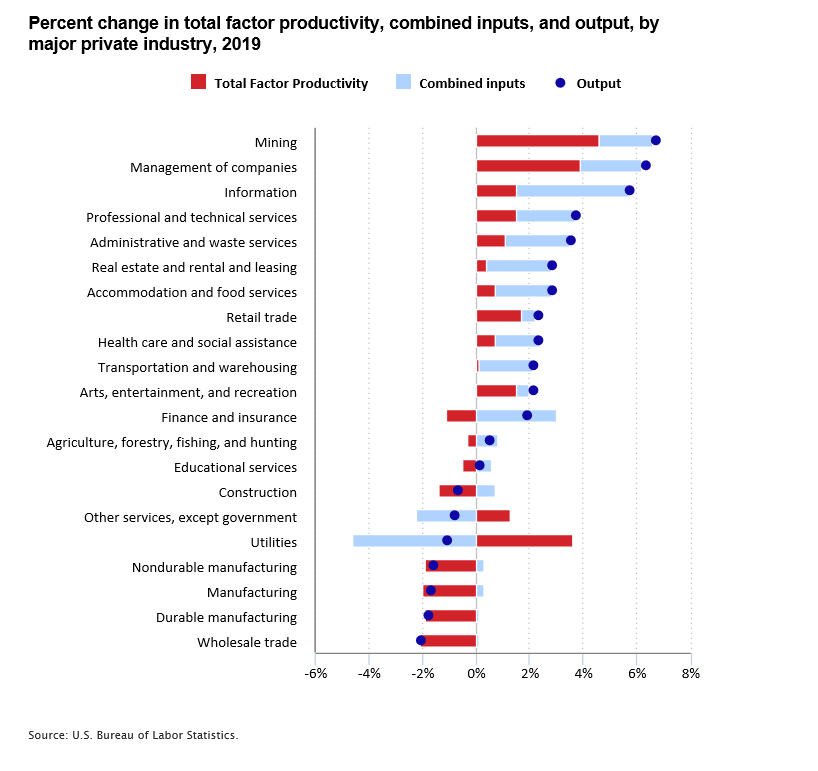
And now we are providing a more complete picture. Not only will you get the first comprehensive look into what the COVID-19 pandemic in 2020 meant for labor, capital, and more, but we also will include all major industries and not just manufacturing. The chart below gives a taste of the expanded information that we will now include in the reimagined release with a new name. For example, we can see that in 2019, the information industry had strong output growth (third highest), stemming mostly from combined inputs growth and total factor productivity growth (those things that are harder to measure).

Editor’s note: Data for this chart are available in the table below.
Connecting Total Factor Productivity to Labor Productivity
We can use total factor productivity and combined inputs for more than just an explanation of output growth. These measures give us is a way to break down the growth of labor productivity. We are the Bureau of Labor Statistics after all, so using our data to understand the growth in efficiency of the nation’s workforce is important.
We can express labor productivity growth as the sum of the growth of six components:
- Total factor productivity
- Contribution of capital intensity
- Contribution of labor composition (shifts in the age, education, and gender composition of the workforce)
- Contribution of energy
- Contribution of materials
- Contribution of purchased services
The contribution of each input is the ratio of the services provided by that input to hours worked. When we look at the contribution of each input, we can measure the effect of increasing the use of that input on an industry’s labor productivity.
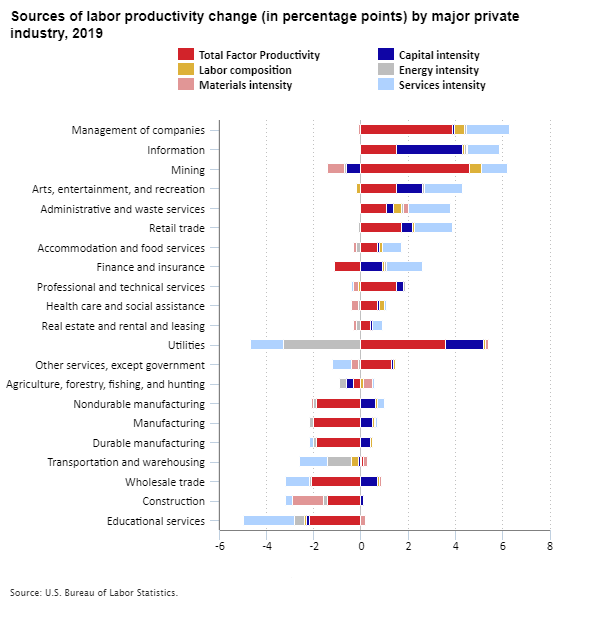
The chart below shows sources of labor productivity in 2019 for each industry. The information industry had the second largest increase in labor productivity, rising 5.9 percent. That increase was driven by an increase in capital of 2.8 percent and total factor productivity growth of 1.5 percent. Knowing what drives productivity helps businesses make better decisions and pass those efficiencies on to workers and customers.

Editor’s note: Data for this chart are available in the table below.
We will release new annual data for Total Factor Productivity in 2020 on November 18, 2021, at 10:00 a.m. Eastern Time. More detailed industry data are also available. For more information on productivity check, out our Productivity page. Want to help us improve our productivity data and publications? Please fill out our 10-minute survey by November 16, 2021.
| Year | Labor Productivity | Total Factor Productivity |
|---|---|---|
2010 | 3.4% | 2.7% |
2011 | -0.1 | -0.1 |
2012 | 0.8 | 0.7 |
2013 | 0.5 | 0.1 |
2014 | 0.8 | 0.6 |
2015 | 1.6 | 1.1 |
2016 | 0.4 | -0.4 |
2017 | 1.2 | 0.5 |
2018 | 1.5 | 0.9 |
2019 | 1.8 | 0.7 |
| Industry | Output | Combined inputs | Total Factor Productivity |
|---|---|---|---|
Mining | 6.7% | 2.0% | 4.6% |
Management of companies | 6.3 | 2.3 | 3.9 |
Information | 5.7 | 4.2 | 1.5 |
Professional and technical services | 3.7 | 2.2 | 1.5 |
Administrative and waste services | 3.5 | 2.4 | 1.1 |
Real estate and rental and leasing | 2.8 | 2.4 | 0.4 |
Accommodation and food services | 2.8 | 2.1 | 0.7 |
Retail trade | 2.3 | 0.5 | 1.7 |
Health care and social assistance | 2.3 | 1.7 | 0.7 |
Transportation and warehousing | 2.1 | 2.1 | 0.0 |
Arts, entertainment, and recreation | 2.1 | 0.5 | 1.5 |
Finance and insurance | 1.9 | 3.0 | -1.1 |
Agriculture, forestry, fishing, and hunting | 0.5 | 0.8 | -0.3 |
Educational services | 0.1 | 0.6 | -0.5 |
Construction | -0.7 | 0.7 | -1.4 |
Other services, except government | -0.8 | -2.2 | 1.3 |
Utilities | -1.1 | -4.6 | 3.6 |
Nondurable manufacturing | -1.6 | 0.3 | -1.9 |
Manufacturing | -1.7 | 0.3 | -2.0 |
Durable manufacturing | -1.8 | 0.1 | -1.9 |
Wholesale trade | -2.1 | 0.0 | -2.1 |
| Industry | Services intensity | Materials intensity | Energy intensity | Labor composition | Capital intensity | Total Factor Productivity |
|---|---|---|---|---|---|---|
Management of companies | 1.9 | -0.1 | 0.0 | 0.5 | 0.0 | 3.9 |
Information | 1.4 | 0.1 | 0.0 | 0.1 | 2.8 | 1.5 |
Mining | 1.1 | -0.7 | -0.1 | 0.5 | -0.6 | 4.6 |
Arts, entertainment, and recreation | 1.7 | 0.0 | 0.0 | -0.2 | 1.1 | 1.5 |
Administrative and waste services | 1.8 | 0.3 | 0.0 | 0.3 | 0.3 | 1.1 |
Retail trade | 1.7 | 0.0 | -0.1 | 0.0 | 0.5 | 1.7 |
Accommodation and food services | 0.8 | -0.1 | -0.2 | 0.2 | 0.0 | 0.7 |
Finance and insurance | 1.6 | 0.0 | 0.0 | 0.1 | 0.9 | -1.1 |
Professional and technical services | -0.1 | -0.2 | 0.0 | -0.1 | 0.3 | 1.5 |
Health care and social assistance | 0.1 | -0.3 | -0.1 | 0.2 | 0.1 | 0.7 |
Real estate and rental and leasing | 0.5 | -0.1 | -0.2 | 0.0 | 0.0 | 0.4 |
Utilities | -1.4 | 0.2 | -3.3 | 0.0 | 1.6 | 3.6 |
Other services, except government | -0.8 | -0.3 | -0.1 | 0.0 | 0.1 | 1.3 |
Agriculture, forestry, fishing, and hunting | 0.0 | 0.4 | -0.3 | 0.1 | -0.3 | -0.3 |
Nondurable manufacturing | 0.3 | -0.1 | -0.1 | 0.1 | 0.6 | -1.9 |
Manufacturing | 0.0 | 0.1 | -0.2 | 0.0 | 0.5 | -2.0 |
Durable manufacturing | -0.2 | 0.1 | -0.1 | 0.0 | 0.4 | -1.9 |
Transportation and warehousing | -1.2 | 0.3 | -1.0 | -0.3 | -0.1 | 0.0 |
Wholesale trade | -1.0 | 0.0 | -0.1 | 0.1 | 0.7 | -2.1 |
Construction | -0.3 | -1.3 | -0.2 | 0.0 | 0.1 | -1.4 |
Educational services | -2.2 | 0.2 | -0.4 | -0.1 | -0.1 | -2.2 |
 United States Department of Labor