
An official website of the United States government
 United States Department of Labor
An official website of the United States government
United States Department of Labor

The .gov means it's official.
Federal government websites often end in .gov or .mil. Before sharing sensitive information,
make sure you're on a federal government site.

The site is secure.
The
https:// ensures that you are connecting to the official website and that any
information you provide is encrypted and transmitted securely.


25-1305-KAN
Friday, August 15, 2025
Colorado had 136,000 job openings in June 2025, compared to 129,000 openings in May, the U.S. Bureau of Labor Statistics reported today. (See table 1.) Assistant Commissioner for Regional Operations Michael Hirniak noted that the job openings rate in Colorado was 4.4 percent in June and 4.1 percent in the previous month. (See chart 1 and table 2.) The job openings rate nationally was 4.4 percent in June and 4.6 percent in May. (See table 3.) All data in this release are seasonally adjusted.
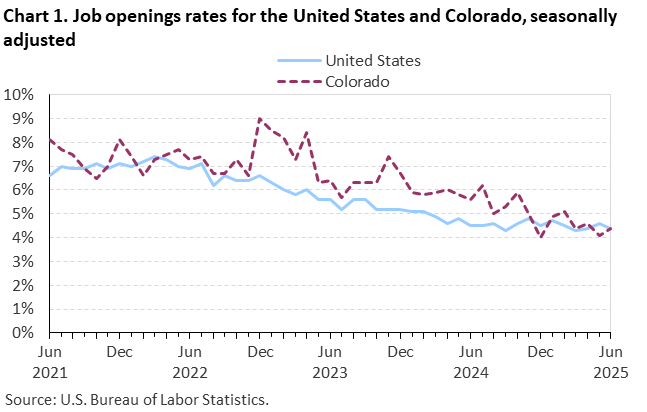
| Month | Colorado | United States |
|---|---|---|
| Jun 2021 | 8.1 | 6.6 |
| Jul 2021 | 7.7 | 7.0 |
| Aug 2021 | 7.5 | 6.9 |
| Sep 2021 | 6.9 | 6.9 |
| Oct 2021 | 6.5 | 7.1 |
| Nov 2021 | 7.0 | 6.9 |
| Dec 2021 | 8.1 | 7.1 |
| Jan 2022 | 7.4 | 7.0 |
| Feb 2022 | 6.6 | 7.2 |
| Mar 2022 | 7.3 | 7.4 |
| Apr 2022 | 7.5 | 7.3 |
| May 2022 | 7.7 | 7.0 |
| Jun 2022 | 7.3 | 6.9 |
| Jul 2022 | 7.4 | 7.1 |
| Aug 2022 | 6.7 | 6.2 |
| Sep 2022 | 6.7 | 6.6 |
| Oct 2022 | 7.3 | 6.4 |
| Nov 2022 | 6.6 | 6.4 |
| Dec 2022 | 9.0 | 6.6 |
| Jan 2023 | 8.5 | 6.3 |
| Feb 2023 | 8.2 | 6.0 |
| Mar 2023 | 7.3 | 5.8 |
| Apr 2023 | 8.4 | 6.0 |
| May 2023 | 6.3 | 5.6 |
| Jun 2023 | 6.4 | 5.6 |
| Jul 2023 | 5.7 | 5.2 |
| Aug 2023 | 6.3 | 5.6 |
| Sep 2023 | 6.3 | 5.6 |
| Oct 2023 | 6.3 | 5.2 |
| Nov 2023 | 7.4 | 5.2 |
| Dec 2023 | 6.7 | 5.2 |
| Jan 2024 | 5.9 | 5.1 |
| Feb 2024 | 5.8 | 5.1 |
| Mar 2024 | 5.9 | 4.9 |
| Apr 2024 | 6.0 | 4.6 |
| May 2024 | 5.8 | 4.8 |
| Jun 2024 | 5.6 | 4.5 |
| Jul 2024 | 6.2 | 4.5 |
| Aug 2024 | 5.0 | 4.6 |
| Sep 2024 | 5.3 | 4.3 |
| Oct 2024 | 5.9 | 4.6 |
| Nov 2024 | 5.0 | 4.8 |
| Dec 2024 | 4.0 | 4.5 |
| Jan 2025 | 4.9 | 4.7 |
| Feb 2025 | 5.1 | 4.5 |
| Mar 2025 | 4.4 | 4.3 |
| Apr 2025 | 4.6 | 4.4 |
| May 2025 | 4.1 | 4.6 |
| Jun 2025 | 4.4 | 4.4 |
The ratio of unemployed persons per job opening in Colorado was 1.1 in June. Nationwide, 25 states and the District of Columbia had ratios in June that were lower than the national measure of 0.9 unemployed persons per job opening; 18 states had ratios that were higher than the national ratio, and 7 states had ratios equal to the national measure. (See map 1.)
In June, Colorado had 95,000 hires and 108,000 separations, compared to 130,000 hires and 118,000 separations in May. (See chart 2.) Over the 12 months ending in June, hires have averaged 115,000 per month and separations have averaged 110,000 per month. These averages include workers who may have been hired and separated more than once during the year.
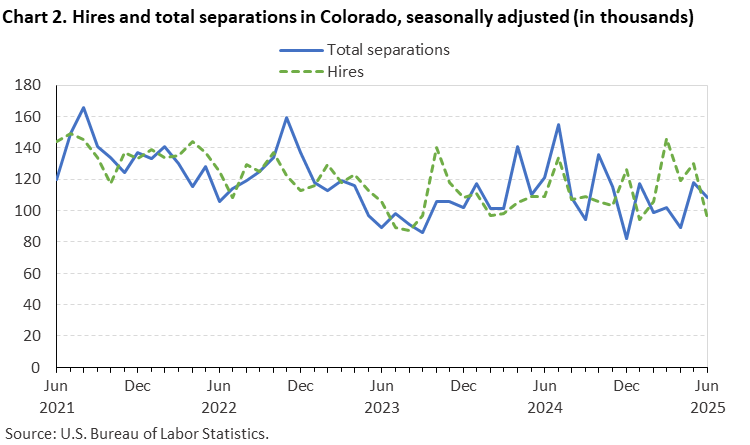
| Month | Hires | Total separations |
|---|---|---|
| Jun 2021 | 144 | 120 |
| Jul 2021 | 149 | 149 |
| Aug 2021 | 145 | 166 |
| Sep 2021 | 134 | 141 |
| Oct 2021 | 117 | 134 |
| Nov 2021 | 137 | 124 |
| Dec 2021 | 133 | 137 |
| Jan 2022 | 139 | 133 |
| Feb 2022 | 134 | 141 |
| Mar 2022 | 135 | 130 |
| Apr 2022 | 144 | 115 |
| May 2022 | 137 | 128 |
| Jun 2022 | 125 | 106 |
| Jul 2022 | 108 | 114 |
| Aug 2022 | 129 | 119 |
| Sep 2022 | 125 | 125 |
| Oct 2022 | 137 | 134 |
| Nov 2022 | 122 | 159 |
| Dec 2022 | 113 | 137 |
| Jan 2023 | 116 | 118 |
| Feb 2023 | 129 | 113 |
| Mar 2023 | 118 | 119 |
| Apr 2023 | 123 | 116 |
| May 2023 | 113 | 97 |
| Jun 2023 | 106 | 89 |
| Jul 2023 | 89 | 98 |
| Aug 2023 | 87 | 91 |
| Sep 2023 | 97 | 86 |
| Oct 2023 | 140 | 106 |
| Nov 2023 | 118 | 106 |
| Dec 2023 | 108 | 102 |
| Jan 2024 | 111 | 117 |
| Feb 2024 | 97 | 101 |
| Mar 2024 | 98 | 101 |
| Apr 2024 | 105 | 141 |
| May 2024 | 109 | 110 |
| Jun 2024 | 109 | 121 |
| Jul 2024 | 134 | 155 |
| Aug 2024 | 107 | 108 |
| Sep 2024 | 109 | 94 |
| Oct 2024 | 106 | 136 |
| Nov 2024 | 103 | 115 |
| Dec 2024 | 126 | 82 |
| Jan 2025 | 94 | 117 |
| Feb 2025 | 106 | 99 |
| Mar 2025 | 146 | 102 |
| Apr 2025 | 119 | 89 |
| May 2025 | 130 | 118 |
| Jun 2025 | 95 | 108 |
Among the June separations in Colorado, 64,000 were quits and 40,000 were layoffs and discharges, compared to 68,000 quits and 42,000 layoffs and discharges in May. (See chart 3.) Over the year, quits averaged 66,000 per month, ranging from 49,000 to 108,000. Layoffs and discharges have averaged 38,000 per month, ranging from 23,000 to 71,000.
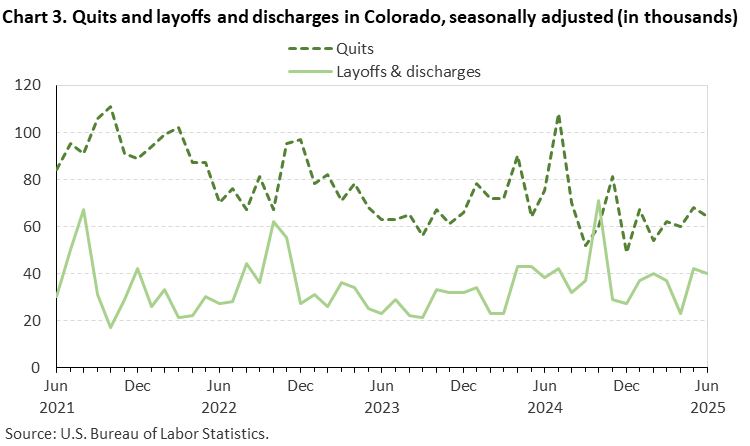
| Month | Quits | Layoffs & discharges |
|---|---|---|
| Jun 2021 | 84 | 30 |
| Jul 2021 | 95 | 50 |
| Aug 2021 | 91 | 67 |
| Sep 2021 | 106 | 31 |
| Oct 2021 | 111 | 17 |
| Nov 2021 | 91 | 29 |
| Dec 2021 | 89 | 42 |
| Jan 2022 | 94 | 26 |
| Feb 2022 | 99 | 33 |
| Mar 2022 | 102 | 21 |
| Apr 2022 | 87 | 22 |
| May 2022 | 87 | 30 |
| Jun 2022 | 70 | 27 |
| Jul 2022 | 76 | 28 |
| Aug 2022 | 67 | 44 |
| Sep 2022 | 81 | 36 |
| Oct 2022 | 67 | 62 |
| Nov 2022 | 95 | 55 |
| Dec 2022 | 97 | 27 |
| Jan 2023 | 78 | 31 |
| Feb 2023 | 82 | 26 |
| Mar 2023 | 71 | 36 |
| Apr 2023 | 78 | 34 |
| May 2023 | 68 | 25 |
| Jun 2023 | 63 | 23 |
| Jul 2023 | 63 | 29 |
| Aug 2023 | 65 | 22 |
| Sep 2023 | 56 | 21 |
| Oct 2023 | 67 | 33 |
| Nov 2023 | 61 | 32 |
| Dec 2023 | 66 | 32 |
| Jan 2024 | 78 | 34 |
| Feb 2024 | 72 | 23 |
| Mar 2024 | 72 | 23 |
| Apr 2024 | 90 | 43 |
| May 2024 | 64 | 43 |
| Jun 2024 | 75 | 38 |
| Jul 2024 | 108 | 42 |
| Aug 2024 | 70 | 32 |
| Sep 2024 | 52 | 37 |
| Oct 2024 | 60 | 71 |
| Nov 2024 | 81 | 29 |
| Dec 2024 | 49 | 27 |
| Jan 2025 | 67 | 37 |
| Feb 2025 | 54 | 40 |
| Mar 2025 | 62 | 37 |
| Apr 2025 | 60 | 23 |
| May 2025 | 68 | 42 |
| Jun 2025 | 64 | 40 |
The State Job Openings and Labor Turnover Survey estimates for July 2025 are scheduled to be released on Wednesday, September 17, 2025, at 8:00 a.m. (MT).
This news release presents statistics from the Bureau of Labor Statistics’ Job Openings and Labor Turnover Survey (JOLTS). The JOLTS program provides information on labor demand and turnover. The state estimates produced by JOLTS are model-based, incorporating JOLTS sample, Quarterly Census of Employment and Wages (QCEW), and Current Employment Statistics (CES) estimates. For more information see the JOLTS State Estimates Methodology.
Job Openings. Job openings include all positions that are open on the last business day of the reference month. A job is open only if it meets all three of these conditions:
The number of unemployed persons per job opening is a ratio of the level of unemployed persons and the level of job openings. The number of unemployed persons at the national level is an estimate from the Current Population Survey (CPS), while state-level unemployment estimates are modeled by the Local Area Unemployment Statistics (LAUS) program. A ratio of 1.0 means there is a job available for every unemployed person. Lower ratios signal tighter labor markets, where firms have more job openings than there are unemployed persons available to work. Higher ratios indicate there are more unemployed persons competing for each job opening.
Hires. Hires include all additions to the payroll during the entire reference month.
Separations. Separations include all separations from the payroll during the entire reference month and is reported by type of separation: quits, layoffs and discharges, and other separations.
Levels and rates of other separations represent a small portion of total separations and are not published with the release of state estimates.
Complete definitions, including exclusions, and additional information about the State JOLTS data presented in this release are available in the State Job Openings and Labor Turnover Technical Note.
Information in this release will be made available to individuals with sensory impairments upon request. Voice phone: 202-691-5200; Telecommunications Relay Service: 7-1-1.
| Estimate | June 2024 | March 2025 | April 2025 | May 2025 | June 2025(p) | Change from May 2025 to June 2025(p) |
|---|---|---|---|---|---|---|
Openings | 178 | 138 | 145 | 129 | 136 | 7 |
Hires | 109 | 146 | 119 | 130 | 95 | -35 |
Total separations | 121 | 102 | 89 | 118 | 108 | -10 |
Quits | 75 | 62 | 60 | 68 | 64 | -4 |
Layoffs & discharges | 38 | 37 | 23 | 42 | 40 | -2 |
(p) Preliminary. | ||||||
| Estimate | June 2024 | March 2025 | April 2025 | May 2025 | June 2025(p) | Change from May 2025 to June 2025(p) |
|---|---|---|---|---|---|---|
Openings(1) | 5.6 | 4.4 | 4.6 | 4.1 | 4.4 | 0.3 |
Hires(2) | 3.7 | 4.9 | 4.0 | 4.4 | 3.2 | -1.2 |
Total separations(3) | 4.1 | 3.4 | 3.0 | 4.0 | 3.6 | -0.4 |
Quits(3) | 2.5 | 2.1 | 2.0 | 2.3 | 2.1 | -0.2 |
Layoffs & discharges(3) | 1.3 | 1.2 | 0.8 | 1.4 | 1.3 | -0.1 |
(p) Preliminary. | ||||||
| Estimate | June 2024 | March 2025 | April 2025 | May 2025 | June 2025(p) | Change from May 2025 to June 2025(p) |
|---|---|---|---|---|---|---|
Openings(1) | 4.5 | 4.3 | 4.4 | 4.6 | 4.4 | -0.2 |
Hires(2) | 3.2 | 3.4 | 3.5 | 3.4 | 3.3 | -0.1 |
Total separations(3) | 3.2 | 3.3 | 3.3 | 3.3 | 3.2 | -0.1 |
Quits(3) | 2.1 | 2.1 | 2.0 | 2.0 | 2.0 | 0.0 |
Layoffs & discharges(3) | 0.9 | 1.0 | 1.1 | 1.0 | 1.0 | 0.0 |
(p) Preliminary. | ||||||
Last Modified Date: Friday, August 15, 2025