An official website of the United States government
An official website of the United States government
The .gov means it's official.
Federal government websites often end in .gov or .mil. Before sharing sensitive information,
make sure you're on a federal government site.
The site is secure.
The
https:// ensures that you are connecting to the official website and that any
information you provide is encrypted and transmitted securely.
26-637-KAN
Friday, April 10, 2026
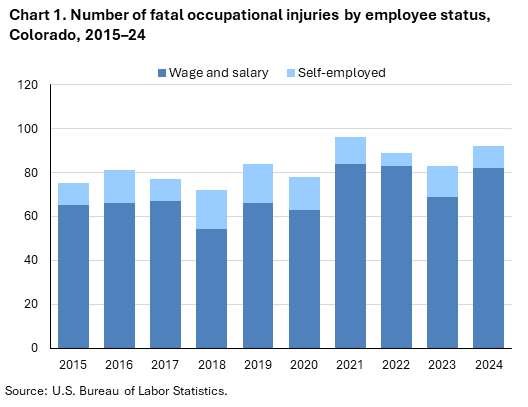
Fatal work injuries totaled 92 in 2024 for Colorado, the U.S. Bureau of Labor Statistics reported today. Acting Regional Commissioner Jerome Watters noted that the number of work-related fatalities in Colorado was up 10.8 percent from 83 in 2023. (See chart 1.) The fatal work injury rate was 3.2 fatalities per 100,000 full-time equivalent (FTE) workers in 2024, an increase from a rate of 2.8 in 2023. Nationwide, a total of 5,070 fatal work injuries were recorded in 2024, a 4.0-percent decrease from 5,283 in 2023. These data are from the Census of Fatal Occupational Injuries (CFOI).
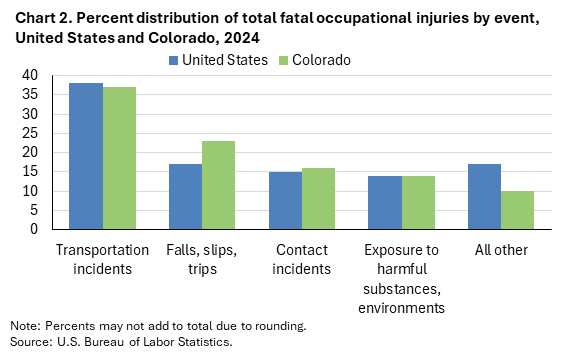
Transportation incidents (34) were the most frequent type of fatal event in Colorado, accounting for 37 percent of all fatal work injuries in the state. Nationally the share was 38 percent. Worker deaths from transportation incidents were down from 35 over the year. (See chart 2 and table 1.)
Work fatalities from exposure to harmful substances or environments increased from 6 in 2023 to 13 in 2024.
Violent acts resulted in 5 fewer workplace fatalities over the year, a decrease from 14 in 2023 to 9 in 2024.
The construction sector had the highest number of fatalities with 22, up from 15 the previous year. (See table 2.) Fatal falls, slips, and trips resulted in 10 of the 22 construction sector fatalities. The specialty trade contractors subsector accounted for 12 of the sector’s fatal workplace injuries.
For the transportation and warehousing sector, workplace fatalities fell from 20 in 2023 to 12 in 2024. The truck transportation subsector accounted for 7 of the 12 sector fatalities.
Agriculture, forestry, fishing and hunting industry fatal work injuries were up 7 over the year, with 11 occurring in 2024. Transportation incidents comprised five of this sector’s workplace fatalities.
The construction and extraction occupational group had the highest number of fatal workplace injuries with 27, up from 13 in 2023. Within this occupational group, falls, trips, and slips resulted in 10 of these fatal incidents in the workplace.
Fatal work injuries decreased by 12 over the year in the transportation and material moving occupational group from 29 in 2023. (See table 3.) Heavy and tractor-trailer truck drivers comprised 10 of these worker fatalities.
Wage and salary workers accounted for 89 percent of fatal workplace injuries in Colorado; the self-employed comprised the remaining 11 percent. (See chart 1 and table 4.) Nationally, wage and salary workers comprised 82 percent of fatalities.
Fatal workplace injuries among male workers increased from 76 to 86, with transportation incidents accounting for 35 percent of fatal events in 2024.
Fatalities among Hispanic or Latino workers increased by 13 from 22 the previous year.
Workers aged 55 years and older had an increase of 9 fatalities over the year, from 26 in 2023 to 35 in 2024. Within that age grouping, six of the additional fatalities over the year occurred among workers aged 65 and over.
Background of the program. The Census of Fatal Occupational Injuries (CFOI), part of the Bureau of Labor Statistics (BLS) Occupational Safety and Health Statistics (OSHS) program, is a count of all fatalities resulting from workplace injuries occurring in the U.S. during the calendar year. For technical information and definitions for the CFOI, see the national CFOI release Technical notes, the BLS Handbook of Methods, and the CFOI definitions.
Acknowledgments. BLS thanks the Missouri Department of Labor & Industrial Relations for their efforts in collecting accurate, comprehensive, and useful data on fatal work injuries. BLS also appreciates the efforts of all federal, state, local, and private sector entities that provided source documents used to identify fatal work injuries nationally. See the national CFOI release Technical Notes for details on cooperating entities.
If you are deaf, hard of hearing, or have a speech disability, please dial 7-1-1 to access telecommunications relay services.
| Event or Exposure (1) | 2023 | 2024 | |
|---|---|---|---|
| Number | Number | Percent (%) | |
All events and exposures | 83 | 92 | 100 |
Violent acts | 14 | 9 | 10 |
Homicides (violent acts by other person) | -- | 6 | 7 |
Suicides (intentional self-harm) | -- | 3 | 3 |
Transportation incidents | 35 | 34 | 37 |
Roadway incidents involving motorized land vehicle | 24 | 24 | 26 |
Roadway collision with other vehicle(s) | 8 | 13 | 14 |
Roadway collision with other vehicle(s)-intersecting, turning | 5 | 4 | 4 |
Roadway collision with other vehicle(s)-moving and standing vehicle | -- | 3 | 3 |
Roadway collision with object other than vehicle | 6 | 7 | 8 |
Roadway noncollision incident | 10 | 4 | 4 |
Roadway noncollision- vehicle overturn | -- | 4 | 4 |
Falls, slips, trips | 16 | 21 | 23 |
Fall to lower level | -- | 17 | 18 |
Other fall to lower level | -- | 12 | 13 |
Other fall to lower level- 6 to 30 feet | -- | 5 | 5 |
Other fall to lower level- more than 30 feet | -- | 4 | 4 |
Exposure to harmful substances, environments | 6 | 13 | 14 |
Exposure to harmful substances | 3 | 9 | 10 |
Contact incidents | 12 | 15 | 16 |
Struck by propelled, falling, or suspended object | 7 | 8 | 9 |
(1) Based on the BLS Occupational Injury and Illness Classification System (OIICS) version 3 implemented for 2023 data forward. | |||
Note: The Census of Fatal Occupational Injuries (CFOI) has published data on fatal occupational injuries for the United States since 1992. During this time, the classification systems and definitions of many data elements have changed. See the CFOI Definitions page (www.bls.gov/iif/definitions/census-of-fatal-occupational-injuries-definitions.htm) for a more detailed description of each data element. Data for all years are revised and final. Totals for major categories may include subcategories not shown separately. Dashes indicate no data reported or data that do not meet publication criteria. CFOI fatal injury counts exclude illness-related deaths unless precipitated by an injury event. | |||
| Industry | 2023 | 2024 | |
|---|---|---|---|
| Number | Number | Percent (%) | |
Total | 83 | 92 | 100 |
Private industry (1) | 74 | 88 | 96 |
Natural resources and mining | -- | 15 | 16 |
Agriculture, forestry, fishing and hunting | 4 | 11 | 12 |
Animal production and aquaculture | -- | 6 | 7 |
Cattle ranching and farming | -- | 5 | 5 |
Other animal production | -- | 1 | 1 |
All other animal production | -- | 1 | 1 |
Mining, quarrying, and oil and gas extraction | -- | 4 | 4 |
Construction | 15 | 22 | 24 |
Construction | 15 | 22 | 24 |
Construction of buildings | 4 | 5 | 5 |
Specialty trade contractors | 6 | 12 | 13 |
Foundation, structure, and building exterior contractors | 4 | 7 | 8 |
Manufacturing | -- | 4 | 4 |
Manufacturing | -- | 4 | 4 |
Trade, transportation, and utilities | 31 | 19 | 21 |
Wholesale trade | 4 | 4 | 4 |
Retail trade | 7 | 3 | 3 |
Transportation and warehousing | 20 | 12 | 13 |
Truck transportation | 14 | 7 | 8 |
Information | -- | -- | -- |
Financial activities | -- | -- | -- |
Professional and business services | 7 | 7 | 8 |
Administrative and support and waste management and remediation services | 7 | 7 | 8 |
Educational and health services | -- | -- | -- |
Educational services | -- | 1 | 1 |
Educational services | -- | 1 | 1 |
Colleges, universities, and professional schools | -- | 1 | 1 |
Colleges, universities, and professional schools | -- | 1 | 1 |
Leisure and hospitality | -- | -- | -- |
Accommodation and food services | 4 | 3 | 3 |
Food services and drinking places | 4 | 3 | 3 |
Restaurants and other eating places | -- | 3 | 3 |
Restaurants and other eating places | -- | 3 | 3 |
Full-service restaurants | -- | 3 | 3 |
Other services (except public administration) | -- | 6 | 7 |
Other services (except public administration) | -- | 6 | 7 |
Government (2) | 9 | 4 | 4 |
Federal government | 3 | -- | -- |
State government | -- | -- | -- |
Local government | 5 | -- | -- |
(1) CFOI has used several versions of the North American Industry Classification System (NAICS) since 2003 to define industry. For complete information on the version of NAICS used in this year, see our concepts page at https://www.bls.gov/opub/hom/cfoi/concepts.htm#industry. | |||
Note: The Census of Fatal Occupational Injuries (CFOI) has published data on fatal occupational injuries for the United States since 1992. During this time, the classification systems and definitions of many data elements have changed. See the CFOI Definitions page (www.bls.gov/iif/definitions/census-of-fatal-occupational-injuries-definitions.htm) for a more detailed description of each data element. Data for all years are revised and final. Totals for major categories may include subcategories not shown separately. Dashes indicate no data reported or data that do not meet publication criteria. CFOI fatal injury counts exclude illness-related deaths unless precipitated by an injury event. | |||
| Occupation (1) | 2023 | 2024 | |
|---|---|---|---|
| Number | Number | Percent (%) | |
All occupations | 83 | 92 | 100 |
Management occupations | 4 | 7 | 8 |
Operations specialties managers | -- | 3 | 3 |
Other management occupations | -- | 4 | 4 |
Educational instruction and library occupations | -- | 1 | 1 |
Protective service occupations | 6 | 5 | 5 |
Other protective service workers | 3 | 3 | 3 |
Security guards and gambling surveillance officers | 3 | 3 | 3 |
Security guards | 3 | 3 | 3 |
Food preparation and serving related occupations | -- | 3 | 3 |
Farming, fishing, and forestry occupations | 4 | 5 | 5 |
Construction and extraction occupations | 13 | 27 | 29 |
Construction trades workers | 12 | 21 | 23 |
Construction laborers | 5 | 12 | 13 |
Construction laborers | 5 | 12 | 13 |
Roofers | -- | 5 | 5 |
Roofers | -- | 5 | 5 |
Installation, maintenance, and repair occupations | 3 | 10 | 11 |
Vehicle and mobile equipment mechanics, installers, and repairers | 3 | 5 | 5 |
Transportation and material moving occupations | 29 | 17 | 18 |
Motor vehicle operators | 25 | 13 | 14 |
Driver/sales workers and truck drivers | -- | 13 | 14 |
Heavy and tractor-trailer truck drivers | -- | 10 | 11 |
(1) CFOI has used several versions of the Standard Occupation Classification (SOC) system since 2003 to define occupation. For complete information on the version of SOC used in these years, see the CFOI definitions page (www.bls.gov/iif/definitions/census-of-fatal-occupational-injuries-definitions.htm). Cases where occupation is unknown are included in the total. | |||
Note: The Census of Fatal Occupational Injuries (CFOI) has published data on fatal occupational injuries for the United States since 1992. During this time, the classification systems and definitions of many data elements have changed. See the CFOI Definitions page (www.bls.gov/iif/definitions/census-of-fatal-occupational-injuries-definitions.htm) for a more detailed description of each data element. Data for all years are revised and final. Totals for major categories may include subcategories not shown separately. Dashes indicate no data reported or data that do not meet publication criteria. CFOI fatal injury counts exclude illness-related deaths unless precipitated by an injury event. | |||
| Demographic | 2023 | 2024 | |
|---|---|---|---|
| Number | Number | Percent (%) | |
Total | 83 | 92 | 100 |
Employee status | |||
Wage and salary workers (1) | 69 | 82 | 89 |
Self-employed (2) | 14 | 10 | 11 |
Sex | |||
Male | 76 | 86 | 93 |
Female | 7 | 6 | 7 |
Age (3) | |||
Under 16 years | -- | -- | -- |
16 to 17 years | -- | -- | -- |
18 to 19 years | -- | -- | -- |
20 to 24 years | -- | -- | -- |
25 to 34 years | 19 | 17 | 18 |
35 to 44 years | 16 | 17 | 18 |
45 to 54 years | 14 | 19 | 21 |
55 to 64 years | 17 | 20 | 22 |
65 years and over | 9 | 15 | 16 |
Race or ethnic origin (4) | |||
White, non-Hispanic | 49 | 50 | 54 |
Black or African-American, non-Hispanic | 8 | -- | -- |
Hispanic or Latino | 22 | 35 | 38 |
American Indian or Alaska Native, non-Hispanic | -- | -- | -- |
Asian, non-Hispanic | -- | -- | -- |
Native Hawaiian or Pacific Islander, non-Hispanic | -- | -- | -- |
Person of multiple races, non-Hispanic | -- | -- | -- |
Other or not reported, non-Hispanic | -- | -- | -- |
(1) May include volunteers and workers receiving other types of compensation. Cases where employment status is unknown are included in the counts of wage and salary workers. | |||
Note: The Census of Fatal Occupational Injuries (CFOI) has published data on fatal occupational injuries for the United States since 1992. During this time, the classification systems and definitions of many data elements have changed. See the CFOI Definitions page (www.bls.gov/iif/definitions/census-of-fatal-occupational-injuries-definitions.htm) for a more detailed description of each data element. Data for all years are revised and final. Totals for major categories may include subcategories not shown separately. Dashes indicate no data reported or data that do not meet publication criteria. CFOI fatal injury counts exclude illness-related deaths unless precipitated by an injury event. | |||
Last Modified Date: Friday, April 10, 2026