An official website of the United States government
An official website of the United States government
The .gov means it's official.
Federal government websites often end in .gov or .mil. Before sharing sensitive information,
make sure you're on a federal government site.
The site is secure.
The
https:// ensures that you are connecting to the official website and that any
information you provide is encrypted and transmitted securely.
26-1299-KAN
Friday, July 31, 2026
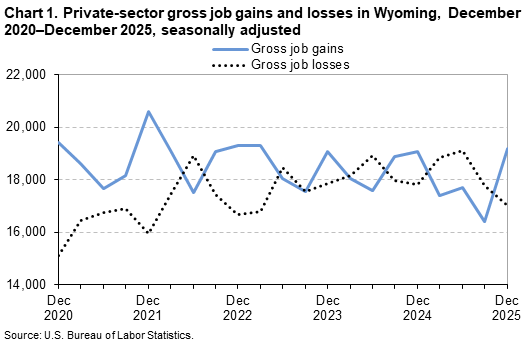
From September 2025 to December 2025, gross job gains from opening and expanding private-sector establishments in Wyoming were 19,197, while gross job losses from closing and contracting private-sector establishments were 17,023, the U.S. Bureau of Labor Statistics reported today. Acting Regional Commissioner Jerome Watters noted that the difference between the number of gross job gains and the number of gross job losses yielded a net employment gain of 2,174 jobs in the private sector during the fourth quarter of 2025. (See table 1.) During the previous quarter, gross job losses exceeded gross job gains by 1,362. (See chart 1.)
The change in the number of jobs over time is the net result of increases and decreases in employment that occur at all private businesses in the economy. Business Employment Dynamics (BED) statistics track these changes in employment at private-sector establishments from the third month of one quarter to the third month of the next. The difference between the number of gross job gains and the number of gross job losses is the net change in employment. (See the Business Employment Dynamics Technical Note.)
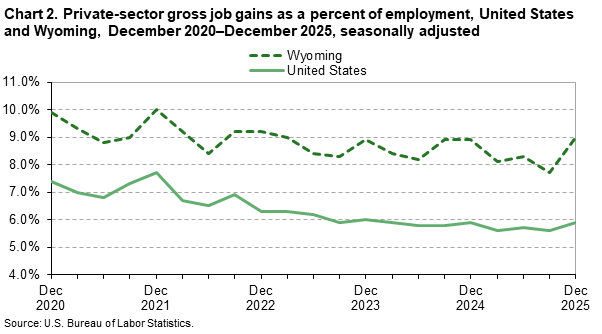
Gross job gainsIn the fourth quarter of 2025, gross job gains represented 9.0 percent of private-sector employment in Wyoming; nationally, gross job gains accounted for 5.9 percent of private-sector employment. (See chart 2.) Gross job gains are the sum of increases in employment due to expansions at existing establishments and the addition of new jobs at opening establishments. In Wyoming, gross job gains at expanding establishments totaled 15,054 in the fourth quarter of 2025, an increase of 2,243 jobs compared to the previous quarter. Opening establishments accounted for 4,143 jobs gained in the fourth quarter of 2025, an increase of 545 jobs from the previous quarter.
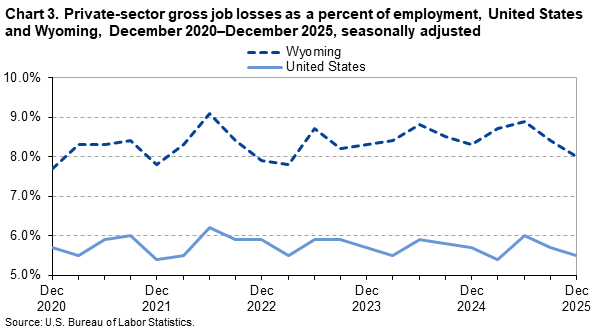
Gross job lossesIn the fourth quarter of 2025, gross job losses represented 8.0 percent of private-sector employment in Wyoming; nationally, gross job losses accounted for 5.5 percent of private-sector employment. (See chart 3.) Gross job losses are the result of contractions in employment at existing establishments and the loss of jobs at closing establishments. In Wyoming, contracting establishments lost 14,355 jobs in the fourth quarter of 2025, an increase of 192 jobs from the prior quarter. Closing establishments lost 2,668 jobs, a decrease of 940 jobs from the previous quarter.
IndustriesGross job gains exceeded gross job losses in 3 of the 5 published industry sectors in Wyoming in the fourth quarter of 2025. Construction had the largest over-the-quarter net job increase, with a gain of 1,175 jobs. This was the result of 3,363 gross job gains and 2,188 gross job losses. The leisure and hospitality industry had a net gain of 858 jobs.
For more informationThe BED data series include gross job gains and gross job losses by industry subsector, for the 50 states, the District of Columbia, Puerto Rico, and the Virgin Islands, as well as gross job gains and gross job losses at the firm level by employer size class. BED data for the states have been included in table 2 of this release. Additional information is available online at the Business Employment Dynamics homepage and the Business Employment Dynamics Summary.
The Business Employment Dynamics for First Quarter 2026 are scheduled to be released on Wednesday, October 28, 2026, at 8:00 a.m. (MT).
The release of First Quarter 2026 Business Employment Dynamics data, scheduled for October 28, 2026, will incorporate annual revisions in accordance with standard procedures. The revisions will include the previous four quarters of not seasonally adjusted data and five years of seasonally adjusted data.
If you are deaf, hard of hearing, or have a speech disability, please dial 7-1-1 to access telecommunications relay services.
| Category | Gross job gains and losses (3 months ended) |
Gross job gains and losses as a percent of employment (3 months ended) |
||||||||
|---|---|---|---|---|---|---|---|---|---|---|
| Dec. 2024 |
Mar. 2025 |
June 2025 |
Sept. 2025 |
Dec. 2025 |
Dec. 2024 |
Mar. 2025 |
June 2025 |
Sept. 2025 |
Dec. 2025 |
|
|
Total private (1) |
||||||||||
|
Gross job gains |
19,063 | 17,407 | 17,712 | 16,409 | 19,197 | 8.9 | 8.1 | 8.3 | 7.7 | 9.0 |
|
At expanding establishments |
15,263 | 13,953 | 14,271 | 12,811 | 15,054 | 7.1 | 6.5 | 6.7 | 6.0 | 7.1 |
|
At opening establishments |
3,800 | 3,454 | 3,441 | 3,598 | 4,143 | 1.8 | 1.6 | 1.6 | 1.7 | 1.9 |
|
Gross job losses |
17,817 | 18,842 | 19,124 | 17,771 | 17,023 | 8.3 | 8.7 | 8.9 | 8.4 | 8.0 |
|
At contracting establishments |
15,051 | 15,176 | 15,836 | 14,163 | 14,355 | 7.0 | 7.0 | 7.4 | 6.7 | 6.7 |
|
At closing establishments |
2,766 | 3,666 | 3,288 | 3,608 | 2,668 | 1.3 | 1.7 | 1.5 | 1.7 | 1.3 |
|
Net employment change (2) |
1,246 | -1,435 | -1,412 | -1,362 | 2,174 | 0.6 | -0.6 | -0.6 | -0.7 | 1.0 |
|
Construction |
||||||||||
|
Gross job gains |
3,016 | 3,111 | 2,691 | 1,982 | 3,363 | 12.7 | 12.7 | 11.3 | 8.8 | 14.7 |
|
At expanding establishments |
2,247 | 2,545 | 2,199 | 1,509 | 2,590 | 9.5 | 10.4 | 9.2 | 6.7 | 11.3 |
|
At opening establishments |
769 | 566 | 492 | 473 | 773 | 3.2 | 2.3 | 2.1 | 2.1 | 3.4 |
|
Gross job losses |
2,783 | 2,935 | 3,130 | 3,008 | 2,188 | 11.7 | 12.0 | 13.1 | 13.4 | 9.6 |
|
At contracting establishments |
2,379 | 2,393 | 2,526 | 2,499 | 1,855 | 10.0 | 9.8 | 10.6 | 11.1 | 8.1 |
|
At closing establishments |
404 | 542 | 604 | 509 | 333 | 1.7 | 2.2 | 2.5 | 2.3 | 1.5 |
|
Net employment change (2) |
233 | 176 | -439 | -1,026 | 1,175 | 1.0 | 0.7 | -1.8 | -4.6 | 5.1 |
|
Retail trade |
||||||||||
|
Gross job gains |
1,884 | 1,802 | 1,688 | 1,638 | 1,569 | 6.3 | 5.9 | 5.5 | 5.5 | 5.2 |
|
At expanding establishments |
1,467 | 1,566 | 1,498 | 1,467 | 1,336 | 4.9 | 5.1 | 4.9 | 4.9 | 4.4 |
|
At opening establishments |
417 | 236 | 190 | 171 | 233 | 1.4 | 0.8 | 0.6 | 0.6 | 0.8 |
|
Gross job losses |
1,640 | 1,627 | 1,915 | 1,778 | 1,632 | 5.4 | 5.3 | 6.3 | 5.9 | 5.4 |
|
At contracting establishments |
1,476 | 1,411 | 1,734 | 1,539 | 1,500 | 4.9 | 4.6 | 5.7 | 5.1 | 5.0 |
|
At closing establishments |
164 | 216 | 181 | 239 | 132 | 0.5 | 0.7 | 0.6 | 0.8 | 0.4 |
|
Net employment change (2) |
244 | 175 | -227 | -140 | -63 | 0.9 | 0.6 | -0.8 | -0.4 | -0.2 |
|
Financial activities |
||||||||||
|
Gross job gains |
717 | 608 | 685 | 739 | 673 | 6.4 | 5.4 | 6.1 | 6.5 | 5.9 |
|
At expanding establishments |
504 | 474 | 458 | 500 | 464 | 4.5 | 4.2 | 4.1 | 4.4 | 4.1 |
|
At opening establishments |
213 | 134 | 227 | 239 | 209 | 1.9 | 1.2 | 2.0 | 2.1 | 1.8 |
|
Gross job losses |
640 | 646 | 767 | 610 | 719 | 5.7 | 5.7 | 6.8 | 5.4 | 6.3 |
|
At contracting establishments |
464 | 448 | 543 | 448 | 534 | 4.1 | 4.0 | 4.8 | 4.0 | 4.7 |
|
At closing establishments |
176 | 198 | 224 | 162 | 185 | 1.6 | 1.7 | 2.0 | 1.4 | 1.6 |
|
Net employment change (2) |
77 | -38 | -82 | 129 | -46 | 0.7 | -0.3 | -0.7 | 1.1 | -0.4 |
|
Professional and business services |
||||||||||
|
Gross job gains |
2,089 | 2,110 | 2,461 | 2,253 | 2,332 | 9.5 | 9.6 | 11.3 | 10.4 | 10.6 |
|
At expanding establishments |
1,302 | 1,448 | 1,584 | 1,483 | 1,581 | 5.9 | 6.6 | 7.3 | 6.8 | 7.2 |
|
At opening establishments |
787 | 662 | 877 | 770 | 751 | 3.6 | 3.0 | 4.0 | 3.6 | 3.4 |
|
Gross job losses |
2,485 | 2,233 | 2,284 | 2,468 | 2,175 | 11.3 | 10.3 | 10.5 | 11.3 | 9.9 |
|
At contracting establishments |
1,851 | 1,586 | 1,571 | 1,680 | 1,513 | 8.4 | 7.3 | 7.2 | 7.7 | 6.9 |
|
At closing establishments |
634 | 647 | 713 | 788 | 662 | 2.9 | 3.0 | 3.3 | 3.6 | 3.0 |
|
Net employment change (2) |
-396 | -123 | 177 | -215 | 157 | -1.8 | -0.7 | 0.8 | -0.9 | 0.7 |
|
Leisure and hospitality |
||||||||||
|
Gross job gains |
5,876 | 4,452 | 4,897 | 4,406 | 5,876 | 15.0 | 11.3 | 12.8 | 11.6 | 15.0 |
|
At expanding establishments |
5,284 | 3,594 | 4,340 | 3,758 | 5,040 | 13.5 | 9.1 | 11.3 | 9.9 | 12.9 |
|
At opening establishments |
592 | 858 | 557 | 648 | 836 | 1.5 | 2.2 | 1.5 | 1.7 | 2.1 |
|
Gross job losses |
5,275 | 5,672 | 5,383 | 4,305 | 5,018 | 13.4 | 14.5 | 14.0 | 11.3 | 12.9 |
|
At contracting establishments |
4,749 | 5,091 | 4,950 | 3,513 | 4,661 | 12.1 | 13.0 | 12.9 | 9.2 | 12.0 |
|
At closing establishments |
526 | 581 | 433 | 792 | 357 | 1.3 | 1.5 | 1.1 | 2.1 | 0.9 |
|
Net employment change (2) |
601 | -1,220 | -486 | 101 | 858 | 1.6 | -3.2 | -1.2 | 0.3 | 2.1 |
|
(1) Includes unclassified sector not shown separately. |
||||||||||
| Category | Gross job gains as a percent of employment (3 months ended) |
Gross job losses as a percent of employment (3 months ended) |
||||||||
|---|---|---|---|---|---|---|---|---|---|---|
| Dec. 2024 |
Mar. 2025 |
June 2025 |
Sept. 2025 |
Dec. 2025 |
Dec. 2024 |
Mar. 2025 |
June 2025 |
Sept. 2025 |
Dec. 2025 |
|
|
United States(1) |
5.9 | 5.6 | 5.7 | 5.6 | 5.9 | 5.7 | 5.4 | 6.0 | 5.7 | 5.5 |
|
Alabama |
5.8 | 5.3 | 5.5 | 5.4 | 6.1 | 5.3 | 5.6 | 5.6 | 5.5 | 5.4 |
|
Alaska |
10.3 | 10.0 | 9.9 | 7.5 | 11.8 | 9.5 | 8.1 | 10.3 | 10.0 | 9.3 |
|
Arizona |
6.1 | 5.8 | 5.3 | 5.8 | 5.7 | 5.9 | 5.3 | 6.3 | 5.5 | 5.4 |
|
Arkansas |
5.8 | 5.1 | 5.1 | 5.3 | 6.0 | 4.8 | 5.1 | 5.5 | 5.3 | 5.0 |
|
California |
6.7 | 6.0 | 6.6 | 6.2 | 6.8 | 6.4 | 6.2 | 6.7 | 6.0 | 6.1 |
|
Colorado |
6.2 | 6.2 | 6.4 | 6.5 | 6.2 | 6.5 | 6.8 | 7.1 | 6.5 | 6.4 |
|
Connecticut |
5.5 | 5.6 | 5.8 | 5.3 | 5.5 | 5.5 | 5.3 | 5.8 | 5.9 | 5.5 |
|
Delaware |
6.1 | 5.9 | 5.9 | 5.3 | 5.5 | 6.3 | 5.3 | 6.1 | 6.1 | 5.5 |
|
District of Columbia |
5.0 | 4.8 | 5.7 | 4.6 | 5.2 | 5.5 | 5.8 | 5.9 | 5.9 | 5.0 |
|
Florida |
6.0 | 5.8 | 5.7 | 5.9 | 5.9 | 6.2 | 5.5 | 5.8 | 6.0 | 5.7 |
|
Georgia |
6.0 | 5.5 | 5.5 | 5.7 | 5.9 | 5.4 | 5.7 | 5.6 | 5.8 | 5.5 |
|
Hawaii |
5.3 | 4.9 | 4.8 | 5.1 | 5.0 | 5.0 | 5.0 | 5.2 | 4.8 | 4.7 |
|
Idaho |
8.2 | 7.3 | 7.7 | 6.7 | 8.1 | 6.8 | 7.3 | 7.2 | 7.6 | 6.3 |
|
Illinois |
5.1 | 5.0 | 5.2 | 4.7 | 5.3 | 5.1 | 5.0 | 5.2 | 5.0 | 5.3 |
|
Indiana |
5.5 | 5.4 | 5.0 | 5.1 | 5.5 | 5.1 | 5.2 | 5.6 | 5.1 | 5.1 |
|
Iowa |
5.6 | 5.8 | 5.6 | 4.8 | 6.3 | 5.6 | 5.5 | 5.8 | 5.9 | 5.4 |
|
Kansas |
5.9 | 5.5 | 5.4 | 5.8 | 5.7 | 5.2 | 5.4 | 6.3 | 5.8 | 5.3 |
|
Kentucky |
5.3 | 5.2 | 5.0 | 5.3 | 5.2 | 5.5 | 4.8 | 5.4 | 5.6 | 5.0 |
|
Louisiana |
6.2 | 5.6 | 5.5 | 5.9 | 6.0 | 5.5 | 5.6 | 6.3 | 6.0 | 5.9 |
|
Maine |
7.0 | 7.4 | 7.2 | 6.2 | 6.8 | 7.1 | 6.3 | 7.4 | 7.0 | 7.0 |
|
Maryland |
6.0 | 5.9 | 5.7 | 5.7 | 6.0 | 5.9 | 5.7 | 6.2 | 6.5 | 5.6 |
|
Massachusetts |
5.3 | 5.0 | 5.5 | 5.3 | 5.4 | 5.5 | 5.1 | 5.8 | 5.9 | 5.6 |
|
Michigan |
5.4 | 5.2 | 5.8 | 4.9 | 5.6 | 5.9 | 5.3 | 5.5 | 5.9 | 5.3 |
|
Minnesota |
5.5 | 5.1 | 5.8 | 5.3 | 5.6 | 5.1 | 5.5 | 5.5 | 5.6 | 5.5 |
|
Mississippi |
6.3 | 5.7 | 6.3 | 6.4 | 6.4 | 6.2 | 6.1 | 6.5 | 6.1 | 5.8 |
|
Missouri |
5.7 | 5.4 | 5.5 | 5.6 | 6.1 | 5.3 | 5.2 | 6.1 | 5.9 | 5.5 |
|
Montana |
8.4 | 8.0 | 7.7 | 7.0 | 8.4 | 7.8 | 7.5 | 8.3 | 7.9 | 7.4 |
|
Nebraska |
5.6 | 5.2 | 5.4 | 5.5 | 5.7 | 5.5 | 5.3 | 5.5 | 5.8 | 5.2 |
|
Nevada |
6.1 | 5.4 | 6.2 | 6.9 | 6.2 | 5.6 | 5.9 | 6.3 | 5.2 | 5.4 |
|
New Hampshire |
6.3 | 6.5 | 6.3 | 5.6 | 6.2 | 5.9 | 6.1 | 6.7 | 6.8 | 5.7 |
|
New Jersey |
6.0 | 5.6 | 5.8 | 5.3 | 5.7 | 5.5 | 5.4 | 5.5 | 5.8 | 5.3 |
|
New Mexico |
6.1 | 5.9 | 5.9 | 5.8 | 6.1 | 5.9 | 5.8 | 6.0 | 6.2 | 6.0 |
|
New York |
5.7 | 6.6 | 5.9 | 5.9 | 5.6 | 5.5 | 5.0 | 7.0 | 5.8 | 5.6 |
|
North Carolina |
6.1 | 5.4 | 5.6 | 5.4 | 6.0 | 5.5 | 5.5 | 5.4 | 5.7 | 5.1 |
|
North Dakota |
6.5 | 6.7 | 6.4 | 6.2 | 6.9 | 6.6 | 6.5 | 6.7 | 6.6 | 6.4 |
|
Ohio |
5.4 | 5.2 | 5.3 | 5.1 | 5.3 | 5.1 | 4.9 | 5.4 | 5.3 | 5.0 |
|
Oklahoma |
6.0 | 5.5 | 5.5 | 6.0 | 6.2 | 5.5 | 5.3 | 6.2 | 6.4 | 5.1 |
|
Oregon |
6.2 | 5.8 | 6.4 | 5.7 | 6.0 | 6.6 | 6.2 | 6.5 | 6.7 | 6.0 |
|
Pennsylvania |
5.2 | 5.0 | 4.9 | 5.0 | 5.1 | 4.8 | 4.7 | 5.2 | 5.2 | 4.7 |
|
Rhode Island |
7.3 | 6.6 | 6.3 | 6.0 | 6.6 | 6.3 | 5.9 | 6.7 | 6.7 | 6.2 |
|
South Carolina |
6.4 | 6.1 | 5.8 | 6.3 | 6.7 | 5.9 | 5.5 | 6.6 | 6.5 | 5.5 |
|
South Dakota |
6.7 | 6.2 | 6.0 | 5.9 | 6.0 | 5.9 | 6.5 | 6.1 | 6.0 | 5.6 |
|
Tennessee |
5.5 | 5.4 | 5.1 | 5.7 | 6.2 | 6.2 | 5.1 | 5.9 | 5.2 | 5.2 |
|
Texas |
5.8 | 5.1 | 5.2 | 5.3 | 5.6 | 5.2 | 5.1 | 5.4 | 5.3 | 4.9 |
|
Utah |
6.8 | 6.6 | 6.6 | 6.7 | 6.5 | 6.3 | 6.0 | 6.6 | 6.4 | 6.1 |
|
Vermont |
6.7 | 6.9 | 6.9 | 6.6 | 6.9 | 6.7 | 6.8 | 7.5 | 7.8 | 7.0 |
|
Virginia |
5.8 | 5.6 | 5.8 | 5.9 | 5.8 | 5.5 | 5.1 | 5.8 | 6.1 | 5.1 |
|
Washington |
5.8 | 5.7 | 6.0 | 5.2 | 5.6 | 5.7 | 5.5 | 5.4 | 5.6 | 5.3 |
|
West Virginia |
6.5 | 6.4 | 5.5 | 5.8 | 5.9 | 6.1 | 5.7 | 6.3 | 6.0 | 6.0 |
|
Wisconsin |
5.3 | 5.0 | 5.3 | 4.9 | 5.6 | 5.2 | 4.9 | 5.5 | 5.6 | 5.1 |
|
Wyoming |
8.9 | 8.1 | 8.3 | 7.7 | 9.0 | 8.3 | 8.7 | 8.9 | 8.4 | 8.0 |
|
Puerto Rico |
4.3 | 6.3 | 7.0 | 5.4 | 4.4 | 5.4 | 5.4 | 6.1 | 5.7 | 5.2 |
|
Virgin Islands |
5.2 | 5.4 | 15.0 | 7.1 | 9.1 | 10.8 | 7.6 | 9.5 | 8.4 | 7.2 |
|
(1) Totals for the United States do not include data for Puerto Rico or the Virgin Islands. The sum of the states will not necessarily add to the U.S. total because of the independent seasonal adjustment of each state. |
||||||||||
Last Modified Date: Friday, July 31, 2026