An official website of the United States government
An official website of the United States government
The .gov means it's official.
Federal government websites often end in .gov or .mil. Before sharing sensitive information,
make sure you're on a federal government site.
The site is secure.
The
https:// ensures that you are connecting to the official website and that any
information you provide is encrypted and transmitted securely.
26-638-KAN
Friday, April 10, 2026
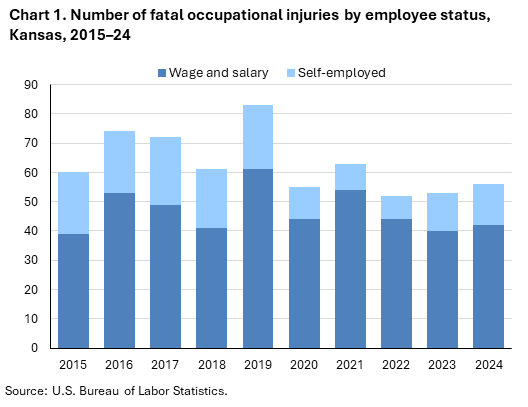
Fatal work injuries totaled 56 in 2024 for Kansas, the U.S. Bureau of Labor Statistics reported today. Acting Regional Commissioner Jerome Watters noted that the number of work-related fatalities in Kansas was up 5.7 percent from 53 in 2023. (See chart 1.) The fatal work injury rate was 4.1 fatalities per 100,000 full-time equivalent (FTE) workers in 2024, an increase from a rate of 3.8 in 2023. Nationwide, a total of 5,070 fatal work injuries were recorded in 2024, a 4.0-percent decrease from 5,283 in 2023. These data are from the Census of Fatal Occupational Injuries (CFOI).
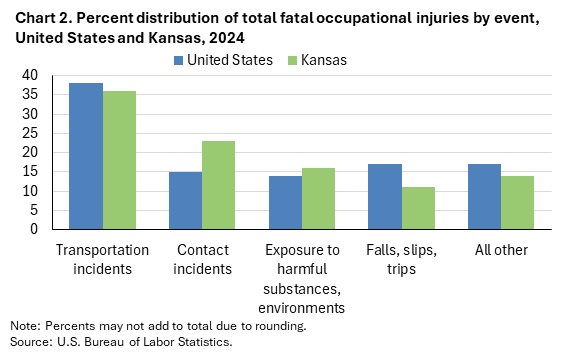
Transportation incidents (20) were the most frequent type of fatal event in Kansas, accounting for 36 percent of all fatal work injuries in the state. Nationally the share was 38 percent. Worker deaths from transportation incidents were down from 37 over the year. (See chart 2 and table 1.)
Contact incidents, up from 3 in 2023 to 13 in 2024, accounted for 23 percent of Kansas worker fatalities; nationally the share was 15 percent.
The agriculture, forestry, fishing, and hunting sector had the highest number of work fatalities with 14, up from 9 the previous year. (See table 2.)
Transportation incidents resulted in 9 of the 14 agriculture, forestry, fishing, and hunting sector fatalities.
The animal production and aquaculture subsector accounted for eight of the sector’s fatal workplace injuries.
The construction and extraction occupational group had the largest increase (+10) from the previous year; it also had the highest number of fatal workplace injuries with 14. (See table 3.) Transportation incidents and contact incidents each resulted in four fatalities among these workers. Construction trades workers accounted for 8 of the major group’s 14 fatal workplace injuries.
Transportation and material moving workers experienced the largest decrease (-16) in fatal work injuries over the year among the major occupational groups.
Wage and salary workers accounted for 75 percent of fatal workplace injuries in Kansas; the self-employed comprised the remaining 25 percent. (See chart 1 and table 4.) Nationally, wage and salary workers comprised 82 percent of fatalities.
Fatalities among Hispanic or Latino workers increased by three from eight the previous year.
White non-Hispanics accounted for 71 percent of those who died from a workplace injury. Nationwide, this group accounted for 56 percent of work-related deaths.
Workers 25-34 years old accounted for 27 percent of workplace fatalities in Kansas in 2024. Nationally, this age group accounted for 17 percent of workplace deaths.
Work-related fatalities for those aged 25-54 years rose to 34 in 2024 from 24 in 2023. Workers aged 55 years and older had a decrease in workplace fatalities over the year, with 17 in 2024 and 26 in 2023.
Background of the program. The Census of Fatal Occupational Injuries (CFOI), part of the Bureau of Labor Statistics (BLS) Occupational Safety and Health Statistics (OSHS) program, is a count of all fatalities resulting from workplace injuries occurring in the U.S. during the calendar year. For technical information and definitions for the CFOI, see the national CFOI release Technical notes, the BLS Handbook of Methods, and the CFOI definitions.
Acknowledgments. BLS thanks the Kansas Labor Market Information Services for their efforts in collecting accurate, comprehensive, and useful data on fatal work injuries. BLS also appreciates the efforts of all federal, state, local, and private sector entities that provided source documents used to identify fatal work injuries nationally. See the national CFOI release Technical Notes for details on cooperating entities.
If you are deaf, hard of hearing, or have a speech disability, please dial 7-1-1 to access telecommunications relay services.
| Event or Exposure (1) | 2023 | 2024 | |
|---|---|---|---|
| Number | Number | Percent (%) | |
|
All events and exposures |
53 | 56 | 100 |
|
Violent acts |
-- | 3 | 5 |
|
Transportation incidents |
37 | 20 | 36 |
|
Roadway incidents involving motorized land vehicle |
24 | 14 | 25 |
|
Roadway collision with other vehicle(s) |
7 | 7 | 13 |
|
Roadway collision with other vehicle(s)-moving in same direction |
-- | 4 | 7 |
|
Nonroadway incidents involving motorized land vehicles |
5 | 3 | 5 |
|
Explosions and fires |
-- | 5 | 9 |
|
Falls, slips, trips |
6 | 6 | 11 |
|
Fall to lower level |
6 | 6 | 11 |
|
Exposure to harmful substances, environments |
5 | 9 | 16 |
|
Exposure to electricity |
-- | 5 | 9 |
|
Indirect exposure to electricity |
-- | 4 | 7 |
|
Indirect exposure to electricity- greater than 220 volts |
-- | 4 | 7 |
|
Exposure to harmful substances |
-- | 4 | 7 |
|
Drug, alcohol overdose |
-- | 3 | 5 |
|
Exposure to harmful substance-multiple routes of exposure |
-- | 1 | 2 |
|
Contact incidents |
3 | 13 | 23 |
|
Struck by propelled, falling, or suspended object |
-- | 3 | 5 |
|
Struck by falling object |
-- | 3 | 5 |
|
Struck, caught, or compressed by running powered equipment |
-- | 7 | 13 |
|
Struck by rolling powered vehicle or machinery |
-- | 3 | 5 |
|
Contact with non-running objects or equipment |
-- | 3 | 5 |
|
(1) Based on the BLS Occupational Injury and Illness Classification System (OIICS) version 3 implemented for 2023 data forward. |
|||
|
Note: The Census of Fatal Occupational Injuries (CFOI) has published data on fatal occupational injuries for the United States since 1992. During this time, the classification systems and definitions of many data elements have changed. See the CFOI Definitions page (www.bls.gov/iif/definitions/census-of-fatal-occupational-injuries-definitions.htm) for a more detailed description of each data element. Data for all years are revised and final. Totals for major categories may include subcategories not shown separately. Dashes indicate no data reported or data that do not meet publication criteria. CFOI fatal injury counts exclude illness-related deaths unless precipitated by an injury event. |
|||
| Industry | 2023 | 2024 | |
|---|---|---|---|
| Number | Number | Percent (%) | |
|
Total |
53 | 56 | 100 |
|
Private industry (1) |
46 | 52 | 93 |
|
Natural resources and mining |
-- | 19 | 34 |
|
Agriculture, forestry, fishing and hunting |
9 | 14 | 25 |
|
Crop production |
5 | 6 | 11 |
|
Oilseed and grain farming |
-- | 3 | 5 |
|
Corn farming |
-- | 1 | 2 |
|
Other grain farming |
-- | 2 | 4 |
|
Oilseed and grain combination farming |
-- | 1 | 2 |
|
Other crop farming |
5 | 3 | 5 |
|
All other crop farming |
4 | 3 | 5 |
|
Animal production and aquaculture |
-- | 8 | 14 |
|
Mining, quarrying, and oil and gas extraction |
-- | 5 | 9 |
|
Support activities for mining |
-- | 3 | 5 |
|
Support activities for mining |
-- | 3 | 5 |
|
Support activities for mining |
-- | 3 | 5 |
|
Construction |
8 | 9 | 16 |
|
Construction |
8 | 9 | 16 |
|
Specialty trade contractors |
-- | 5 | 9 |
|
Manufacturing |
3 | 4 | 7 |
|
Manufacturing |
3 | 4 | 7 |
|
Trade, transportation, and utilities |
-- | -- | -- |
|
Information |
-- | -- | -- |
|
Financial activities |
-- | -- | -- |
|
Professional and business services |
4 | 7 | 13 |
|
Administrative and support and waste management and remediation services |
4 | 7 | 13 |
|
Administrative and support services |
-- | 6 | 11 |
|
Waste management and remediation services |
-- | 1 | 2 |
|
Waste collection |
-- | 1 | 2 |
|
Waste collection |
-- | 1 | 2 |
|
Solid waste collection |
-- | 1 | 2 |
|
Educational and health services |
-- | -- | -- |
|
Leisure and hospitality |
-- | -- | -- |
|
Other services (except public administration) |
3 | 4 | 7 |
|
Other services (except public administration) |
3 | 4 | 7 |
|
Repair and maintenance |
3 | 4 | 7 |
|
Personal and household goods repair and maintenance |
-- | 1 | 2 |
|
Other personal and household goods repair and maintenance |
-- | 1 | 2 |
|
Government (2) |
7 | 4 | 7 |
|
Federal government |
-- | -- | -- |
|
State government |
-- | 1 | 2 |
|
Local government |
3 | 3 | 5 |
|
(1) CFOI has used several versions of the North American Industry Classification System (NAICS) since 2003 to define industry. For complete information on the version of NAICS used in this year, see our concepts page at https://www.bls.gov/opub/hom/cfoi/concepts.htm#industry. |
|||
|
Note: The Census of Fatal Occupational Injuries (CFOI) has published data on fatal occupational injuries for the United States since 1992. During this time, the classification systems and definitions of many data elements have changed. See the CFOI Definitions page (www.bls.gov/iif/definitions/census-of-fatal-occupational-injuries-definitions.htm) for a more detailed description of each data element. Data for all years are revised and final. Totals for major categories may include subcategories not shown separately. Dashes indicate no data reported or data that do not meet publication criteria. CFOI fatal injury counts exclude illness-related deaths unless precipitated by an injury event. |
|||
| Occupation (1) | 2023 | 2024 | |
|---|---|---|---|
| Number | Number | Percent (%) | |
|
All occupations |
53 | 56 | 100 |
|
Management occupations |
7 | 10 | 18 |
|
Other management occupations |
7 | 10 | 18 |
|
Arts, design, entertainment, sports, and media occupations |
-- | 1 | 2 |
|
Media and communication equipment workers |
-- | 1 | 2 |
|
Building and grounds cleaning and maintenance occupations |
-- | 4 | 7 |
|
Farming, fishing, and forestry occupations |
1 | 5 | 9 |
|
Agricultural workers |
-- | 5 | 9 |
|
Miscellaneous agricultural workers |
-- | 5 | 9 |
|
Agricultural equipment operators |
-- | 1 | 2 |
|
Construction and extraction occupations |
4 | 14 | 25 |
|
Construction trades workers |
-- | 8 | 14 |
|
Installation, maintenance, and repair occupations |
7 | 8 | 14 |
|
Production occupations |
3 | 4 | 7 |
|
Transportation and material moving occupations |
23 | 7 | 13 |
|
(1) CFOI has used several versions of the Standard Occupation Classification (SOC) system since 2003 to define occupation. For complete information on the version of SOC used in these years, see the CFOI definitions page (www.bls.gov/iif/definitions/census-of-fatal-occupational-injuries-definitions.htm). Cases where occupation is unknown are included in the total. |
|||
|
Note: The Census of Fatal Occupational Injuries (CFOI) has published data on fatal occupational injuries for the United States since 1992. During this time, the classification systems and definitions of many data elements have changed. See the CFOI Definitions page (www.bls.gov/iif/definitions/census-of-fatal-occupational-injuries-definitions.htm) for a more detailed description of each data element. Data for all years are revised and final. Totals for major categories may include subcategories not shown separately. Dashes indicate no data reported or data that do not meet publication criteria. CFOI fatal injury counts exclude illness-related deaths unless precipitated by an injury event. |
|||
| Demographic | 2023 | 2024 | |
|---|---|---|---|
| Number | Number | Percent (%) | |
|
Total |
53 | 56 | 100 |
|
Employee status |
|||
|
Wage and salary workers (1) |
40 | 42 | 75 |
|
Self-employed (2) |
13 | 14 | 25 |
|
Sex |
|||
|
Male |
50 | 52 | 93 |
|
Female |
3 | 4 | 7 |
|
Age (3) |
|||
|
Under 16 years |
-- | -- | -- |
|
16 to 17 years |
-- | -- | -- |
|
18 to 19 years |
-- | -- | -- |
|
20 to 24 years |
3 | -- | -- |
|
25 to 34 years |
10 | 15 | 27 |
|
35 to 44 years |
7 | 9 | 16 |
|
45 to 54 years |
7 | 10 | 18 |
|
55 to 64 years |
12 | 9 | 16 |
|
65 years and over |
14 | 8 | 14 |
|
Race or ethnic origin (4) |
|||
|
White, non-Hispanic |
40 | 40 | 71 |
|
Black or African-American, non-Hispanic |
-- | -- | -- |
|
Hispanic or Latino |
8 | 11 | 20 |
|
American Indian or Alaska Native, non-Hispanic |
-- | -- | -- |
|
Asian, non-Hispanic |
-- | -- | -- |
|
Native Hawaiian or Pacific Islander, non-Hispanic |
-- | -- | -- |
|
Person of multiple races, non-Hispanic |
-- | -- | -- |
|
Other or not reported, non-Hispanic |
-- | -- | -- |
|
(1) May include volunteers and workers receiving other types of compensation. Cases where employment status is unknown are included in the counts of wage and salary workers. |
|||
|
Note: The Census of Fatal Occupational Injuries (CFOI) has published data on fatal occupational injuries for the United States since 1992. During this time, the classification systems and definitions of many data elements have changed. See the CFOI Definitions page (www.bls.gov/iif/definitions/census-of-fatal-occupational-injuries-definitions.htm) for a more detailed description of each data element. Data for all years are revised and final. Totals for major categories may include subcategories not shown separately. Dashes indicate no data reported or data that do not meet publication criteria. CFOI fatal injury counts exclude illness-related deaths unless precipitated by an injury event. |
|||
Last Modified Date: Friday, April 10, 2026