An official website of the United States government
An official website of the United States government
The .gov means it's official.
Federal government websites often end in .gov or .mil. Before sharing sensitive information,
make sure you're on a federal government site.
The site is secure.
The
https:// ensures that you are connecting to the official website and that any
information you provide is encrypted and transmitted securely.
25-425-KAN
Tuesday, March 25, 2025
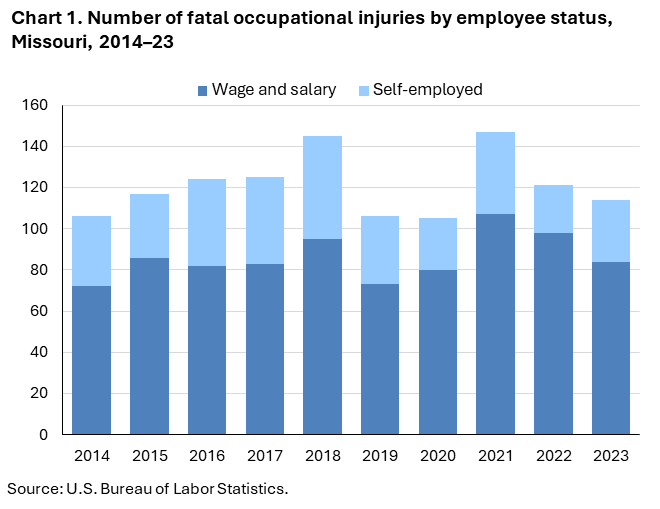
Fatal work injuries totaled 114 in 2023 for Missouri, the U.S. Bureau of Labor Statistics reported today. Assistant Commissioner for Regional Operations Michael Hirniak noted that the number of work-related fatalities in Missouri was down from the previous year. (See chart 1.) Fatal occupational injuries in the state have ranged from a high of 185 in 2005 to a low of 88 in 2012. Nationwide, a total of 5,283 fatal work injuries were recorded in 2023, a 3.7-percent decrease from 5,486 in 2022, according to the results from the Census of Fatal Occupational Injuries (CFOI).
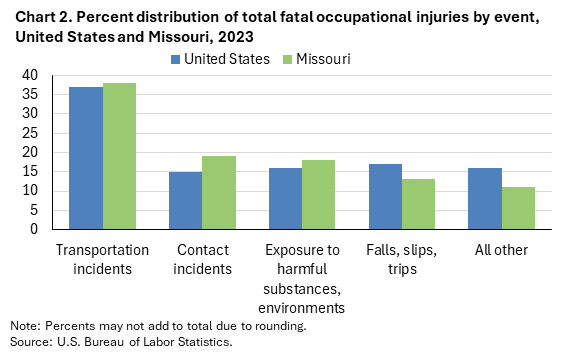
Transportation incidents (43) were the most frequent type of fatal event in Missouri, accounting for 38 percent of all fatal work injuries in the state. Nationally the share was 37 percent. (See chart 2 and table 1.)
Contact incidents (22) accounted for 19 percent of Missouri workplace fatalities; nationally the share was 15 percent.
The agriculture, forestry, fishing, and hunting sector had the highest number of fatalities with 28. (See table 2.)
Contact incidents resulted in 18 of the 28 agriculture, forestry, and fishing sector fatalities.
The crop production subsector accounted for 12 of the sector’s fatal workplace injuries.
The transportation and material moving occupational group had the highest number of fatal workplace injuries with 26. (See table 3.)
Transportation incidents resulted in 20 of the transportation and material moving fatalities.
Heavy and tractor-trailer truck drivers accounted for 15 of the major group’s fatal workplace injuries.
Wage and salary workers accounted for 74 percent of workplace fatalities in Missouri; the self-employed comprised the remaining 26 percent. (See chart 1 and table 4.) Nationally, wage and salary workers comprised 83 percent of fatalities. The most frequent fatal event for wage and salary workers in Missouri was transportation incidents; contact incidents were the most frequent fatal event for self-employed workers.
Males accounted for 90 percent of the work-related fatalities in Missouri and 91 percent nationally.
Workers 25-54 years old accounted for 52 percent of the state’s work-related fatalities, compared to 57 percent of on-the-job fatalities nationally.
White non-Hispanics accounted for 82 percent of fatal workplace injuries. Nationwide, this group accounted for 56 percent of work-related deaths.
The 2022 North American Industry Classification System (NAICS) and the updated Occupational Injury and Illness Classification System (OIICS) were implemented with the release of 2023 data. As a result of these changes, comparisons between 2023 CFOI data and previous years should be made with caution. Refer to the national release technical note for more information.
Background of the program. The Census of Fatal Occupational Injuries (CFOI), part of the Bureau of Labor Statistics (BLS) Occupational Safety and Health Statistics (OSHS) program, is a count of all fatalities resulting from workplace injuries occurring in the U.S. during the calendar year. For technical information and definitions for the CFOI, see the national CFOI release Technical notes, the BLS Handbook of Methods, and the CFOI definitions.
Acknowledgments. BLS thanks the Missouri Department of Labor & Industrial Relations for their efforts in collecting accurate, comprehensive, and useful data on fatal work injuries. BLS also appreciates the efforts of all federal, state, local, and private sector entities that provided source documents used to identify fatal work injuries nationally. See the national CFOI release Technical Notes for details on cooperating entities.
Information in this release will be made available to individuals with sensory impairments upon request. Voice phone: (202) 691-5200; Telecommunications Relay Service: 7-1-1.
| Event or Exposure (1) | Number | Percent (%) |
|---|---|---|
|
All events and exposures |
114 | 100 |
|
Violent acts |
13 | 11 |
|
Transportation incidents |
43 | 38 |
|
Pedestrian incidents involving motorized land vehicles |
5 | 4 |
|
Roadway incidents involving motorized land vehicle |
30 | 26 |
|
Roadway collision with other vehicle(s) |
16 | 14 |
|
Roadway collision with other vehicle(s)-moving in same direction |
4 | 4 |
|
Roadway collision with other vehicle(s)-moving in opposite directions, oncoming |
5 | 4 |
|
Roadway collision with object other than vehicle |
6 | 5 |
|
Collision with object or animal on side of roadway |
3 | 3 |
|
Roadway noncollision incident |
7 | 6 |
|
Roadway noncollision- vehicle overturn |
5 | 4 |
|
Nonroadway incidents involving motorized land vehicles |
4 | 4 |
|
Falls, slips, trips |
15 | 13 |
|
Exposure to harmful substances, environments |
21 | 18 |
|
Exposure to electricity |
3 | 3 |
|
Direct exposure to electricity |
3 | 3 |
|
Exposure to harmful substances |
16 | 14 |
|
Contact incidents |
22 | 19 |
|
Struck by propelled, falling, or suspended object |
12 | 11 |
|
Struck, caught, or compressed by running powered equipment |
6 | 5 |
|
(1) Based on the BLS Occupational Injury and Illness Classification System (OIICS) 3.02 implemented for 2023 data forward. |
||
|
NOTE: Data for all years are revised and final. Totals for major categories may include subcategories not shown separately. Dashes indicate no data reported or data that do not meet publication criteria. CFOI fatal injury counts exclude illness-related deaths unless precipitated by an injury event. |
||
| Industry | Number | Percentage (%) |
|---|---|---|
|
Total |
114 | 100 |
|
Private industry (1) |
103 | 90 |
|
Natural resources and mining |
-- | -- |
|
Agriculture, forestry, fishing and hunting |
28 | 25 |
|
Crop production |
12 | 11 |
|
Animal production and aquaculture |
3 | 3 |
|
Forestry and logging |
10 | 9 |
|
Logging |
10 | 9 |
|
Logging |
10 | 9 |
|
Support activities for agriculture and forestry |
3 | 3 |
|
Construction |
16 | 14 |
|
Construction |
16 | 14 |
|
Specialty trade contractors |
10 | 9 |
|
Foundation, structure, and building exterior contractors |
6 | 5 |
|
Manufacturing |
4 | 4 |
|
Manufacturing |
4 | 4 |
|
Trade, transportation, and utilities |
29 | 25 |
|
Wholesale trade |
4 | 4 |
|
Retail trade |
8 | 7 |
|
General merchandise retailers |
3 | 3 |
|
Gasoline stations and fuel dealers |
3 | 3 |
|
Gasoline stations |
3 | 3 |
|
Gasoline stations with convenience stores |
3 | 3 |
|
Transportation and warehousing |
17 | 15 |
|
Truck transportation |
12 | 11 |
|
Information |
-- | -- |
|
Financial activities |
3 | 3 |
|
Real estate and rental and leasing |
3 | 3 |
|
Real estate |
3 | 3 |
|
Professional and business services |
-- | -- |
|
Administrative and support and waste management and remediation services |
4 | 4 |
|
Educational and health services |
-- | -- |
|
Leisure and hospitality |
5 | 4 |
|
Accommodation and food services |
5 | 4 |
|
Other services (except public administration) |
6 | 5 |
|
Other services (except public administration) |
6 | 5 |
|
Government (2) |
11 | 10 |
|
Federal government |
-- | -- |
|
State government |
-- | -- |
|
Local government |
7 | 6 |
|
(1) CFOI has used several versions of the North American Industry Classification System (NAICS) since 2003 to define industry. For complete information on the version of NAICS used in this year, see our concepts page at https://www.bls.gov/opub/hom/cfoi/concepts.htm#industry. |
||
|
NOTE: Data for all years are revised and final. Totals for major categories may include subcategories not shown separately. Dashes indicate no data reported or data that do not meet publication criteria. CFOI fatal injury counts exclude illness-related deaths unless precipitated by an injury event. |
||
| Occupation (1) | Number | Percentage (%) |
|---|---|---|
|
All occupations |
114 | 100 |
|
Management occupations |
18 | 16 |
|
Other management occupations |
17 | 15 |
|
Farmers, ranchers, and other agricultural managers |
14 | 12 |
|
Farmers, ranchers, and other agricultural managers |
14 | 12 |
|
Sales and related occupations |
8 | 7 |
|
Retail sales workers |
6 | 5 |
|
Farming, fishing, and forestry occupations |
11 | 10 |
|
Forest, conservation, and logging workers |
10 | 9 |
|
Logging workers |
10 | 9 |
|
Fallers |
10 | 9 |
|
Construction and extraction occupations |
17 | 15 |
|
Construction trades workers |
15 | 13 |
|
Roofers |
5 | 4 |
|
Roofers |
5 | 4 |
|
Installation, maintenance, and repair occupations |
14 | 12 |
|
Vehicle and mobile equipment mechanics, installers, and repairers |
8 | 7 |
|
Automotive technicians and repairers |
6 | 5 |
|
Automotive service technicians and mechanics |
6 | 5 |
|
Other installation, maintenance, and repair occupations |
4 | 4 |
|
Production occupations |
4 | 4 |
|
Transportation and material moving occupations |
26 | 23 |
|
Motor vehicle operators |
19 | 17 |
|
Driver/sales workers and truck drivers |
19 | 17 |
|
Heavy and tractor-trailer truck drivers |
15 | 13 |
|
(1) Occupational data are based on the 2018 Standard Occupation Classification (SOC). Cases where occupation is unknown are included in the total. |
||
|
NOTE: Data for all years are revised and final. Totals for major categories may include subcategories not shown separately. Dashes indicate no data reported or data that do not meet publication criteria. CFOI fatal injury counts exclude illness-related deaths unless precipitated by an injury event. |
||
| Demographic | Number | Percentage (%) |
|---|---|---|
|
Total |
114 | 100 |
|
Employee status |
||
|
Wage and salary workers (1) |
84 | 74 |
|
Self-employed (2) |
30 | 26 |
|
Sex |
||
|
Male |
103 | 90 |
|
Female |
11 | 10 |
|
Age (3) |
||
|
Under 16 years |
-- | -- |
|
16 to 17 years |
-- | -- |
|
18 to 19 years |
3 | 3 |
|
20 to 24 years |
10 | 9 |
|
25 to 34 years |
25 | 22 |
|
35 to 44 years |
15 | 13 |
|
45 to 54 years |
19 | 17 |
|
55 to 64 years |
21 | 18 |
|
65 years and over |
19 | 17 |
|
Race or ethnic origin (4) |
||
|
White, non-Hispanic |
94 | 82 |
|
Black or African-American, non-Hispanic |
9 | 8 |
|
Hispanic or Latino |
-- | -- |
|
American Indian or Alaska Native, non-Hispanic |
-- | -- |
|
Asian, non-Hispanic |
-- | -- |
|
Native Hawaiian or Pacific Islander, non-Hispanic |
-- | -- |
|
(1) May include volunteers and workers receiving other types of compensation. Cases where employment status is unknown are included in the counts of wage and salary workers. |
||
|
NOTE: Data for all years are revised and final. Totals for major categories may include subcategories not shown separately. Dashes indicate no data reported or data that do not meet publication criteria. CFOI fatal injury counts exclude illness-related deaths unless precipitated by an injury event. |
||
Last Modified Date: Tuesday, March 25, 2025