An official website of the United States government
An official website of the United States government
The .gov means it's official.
Federal government websites often end in .gov or .mil. Before sharing sensitive information,
make sure you're on a federal government site.
The site is secure.
The
https:// ensures that you are connecting to the official website and that any
information you provide is encrypted and transmitted securely.
15-89-BOS
Wednesday, January 21, 2015
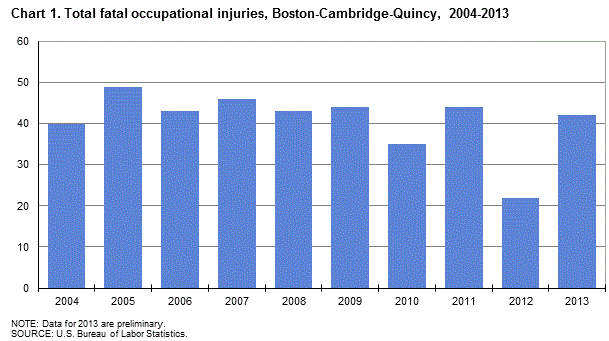
Fatal work injuries totaled 42 in 2013 for the Boston-Cambridge-Quincy, Mass.-N.H., metropolitan area, the U.S. Bureau of Labor Statistics reported today. Regional Commissioner Deborah A. Brown noted that while the 2013 count was preliminary, the number of work-related fatalities in Boston increased by 20 over the year. Since 2003, fatal occupational injuries in the metropolitan area have ranged from a high of 49 in 2005 to a low of 22 in 2012. (See chart 1.)
Nationwide, a preliminary total of 4,405 fatal work injuries were recorded in 2013, down from a final count of 4,628 fatalities recorded in 2012, according to results from the Census of Fatal Occupational Injuries (CFOI) program. Final 2013 CFOI data will be released in late spring of 2015.
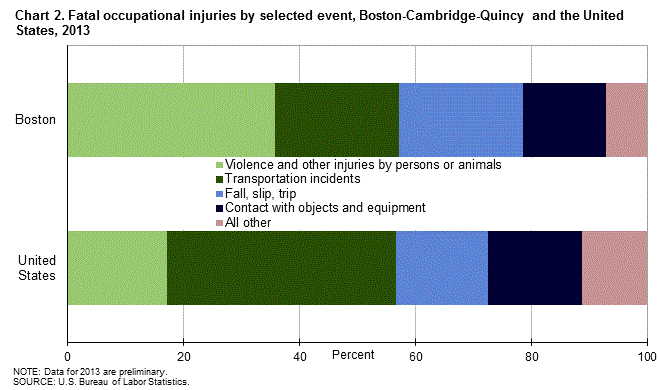
Of the 42 fatal work injuries reported in Boston in 2013, violence and other injuries by persons or animals resulted in 15 deaths. Transportation incidents and falls, slips, and trips were responsible for nine deaths each. (See table 1). Seven of the fatalities within the violence and other injuries by persons or animals category were self-inflicted intentional injuries and six were intentional injuries by other persons. Within the falls, slips, and trips category, 8 of the 9 fatalities were due to falls to a lower level. (Note that transportation counts presented in this release are expected to rise when updated 2013 data are released in spring of 2015 because key source documentation detailing specific transportation-related incidents has not yet been received.)
In the United States, transportation incidents were the most frequent fatal workplace event in 2013, accounting for 40 percent of fatal work injuries. Boston’s share of on-the-job fatalities due to this event was 21 percent. (See chart 2.) Violence and other injuries by persons or animals was the second-most frequent type of event nationally, with 17 percent of work-related fatalities; the share in the Boston area was 36 percent. Contact with objects or equipment and falls, slips, and trips each accounted for 16 percent of the nation’s workplace fatalities.
Additional key characteristics:
The construction sector had the largest number of workplace fatalities in the local area with 12. Five of these worker deaths were caused by a fall to a lower level. (See table 2.)
The trade, transportation, and utilities sector accounted for the second-highest count of workplace deaths in the Boston area with 11, up from the 2 recorded in 2012.
Workplace deaths in the government sector totaled four in 2013, down from the seven recorded in 2012. Violence and other injuries by persons or animals accounted for two of the worker deaths within this sector in 2013.
Construction and extraction occupations had the highest number of fatal work injuries with 11. (See table 3.) Ten of these fatalities were construction trades workers. Workers in transportation and material moving occupations had the next highest fatality count at six.
Men accounted for 38, or 90 percent, of the work-related fatalities in the Boston area. (See table 4.)
In Boston, 83 percent of those who died from a workplace injury were white non-Hispanics, compared to the national share of 68 percent. Asians (non-Hispanic) accounted for 7 percent of those who died from a workplace injury in the local area. Nationwide, this group accounted for 3 percent of work-related deaths.
Nearly two-thirds of the on-the-job fatalities in the Boston area in 2013 were among workers 25-54 years old, the prime working age group. This was similar to the national share. In 2012, workers in this age group accounted for more than three-quarters of the local area’s workplace fatalities.
Of the 42 persons that suffered fatal work injuries in Boston, 83 percent worked for wages and salaries, the remaining were self-employed.
Background of the program. The Census of Fatal Occupational Injuries, part of the BLS occupational safety and health statistics program, compiles a count of all fatal work injuries occurring in the United States during the calendar year. The program uses diverse state, federal, and independent data sources to identify, verify, and describe fatal work injuries. This assures counts are as complete and accurate as possible.
For technical information about the CFOI program, please go to the BLS Handbook of Methods on the BLS web site at www.bls.gov/opub/hom/soii/home.htm.
Federal/State agency coverage. The Census of Fatal Occupational Injuries includes data for all fatal work injuries, whether the decedent was working in a job covered by the Occupational Safety and Health Administration (OSHA) or other federal or state agencies or was outside the scope of regulatory coverage. Thus, any comparison between the BLS fatality census counts and those released by other agencies should take into account the different coverage requirements and definitions being used by each agency.
Acknowledgments. The Bureau of Labor Statistics appreciates the efforts of all federal, state, local, and private sector entities that submitted source documents used to identify fatal work injuries, in particular the Massachusetts Department of Public Health.
The Boston-Cambridge-Quincy, Mass.-N.H. Metropolitan Statistical Area (MSA) includes Essex, Middlesex, Norfolk, Plymouth, and Suffolk Counties in Massachusetts and Rockingham and Strafford Counties in New Hampshire.
Information in this release will be made available to sensory impaired individuals upon request. Voice phone: 202-691-5200; Federal Relay Service: 800-877-8339.
| Event or Exposure(1) | 2012(2) | 2013(p) | |
|---|---|---|---|
| Number | Number | Percent | |
|
Total |
22 | 42 | 100 |
|
Violence and other injuries by persons or animals |
7 | 15 | 36 |
|
Intentional injury by person |
7 | 13 | 31 |
|
Intentional injury by other person |
-- | 6 | 14 |
|
Self-inflicted injury--intentional |
6 | 7 | 17 |
|
Injury by person-unintentional or intent unknown |
-- | 1 | 2 |
|
Animal and insect related incidents |
-- | 1 | 2 |
|
Transportation incidents |
6 | 9 | 21 |
|
Pedestrian vehicular incident |
-- | 2 | 5 |
|
Pedestrian struck by vehicle on side of road |
-- | 1 | 2 |
|
Pedestrian struck by vehicle in nonroadway area |
-- | 1 | 2 |
|
Water vehicle incident |
1 | 3 | 7 |
|
Capsized or sinking water vehicle |
1 | 1 | 2 |
|
Fall or jump from water vehicle |
-- | 2 | 5 |
|
Roadway incidents involving motorized land vehicle |
-- | 3 | 7 |
|
Roadway noncollision incident |
-- | 2 | 5 |
|
Fire or explosion |
1 | 1 | 2 |
|
Fall, slip, trip |
4 | 9 | 21 |
|
Fall on same level |
-- | 1 | 2 |
|
Fall to lower level |
4 | 8 | 19 |
|
Fall from collapsing structure or equipment |
-- | 1 | 2 |
|
Other fall to lower level |
3 | 7 | 17 |
|
Exposure to harmful substances or environments |
1 | 2 | 5 |
|
Exposure to electricity |
-- | 1 | 2 |
|
Exposure to temperature extremes |
-- | 1 | 2 |
|
Contact with objects and equipment |
2 | 6 | 14 |
|
Struck by object or equipment |
2 | 3 | 7 |
|
Struck by powered vehicle--nontransport |
1 | 1 | 2 |
|
Struck by rolling object or equipment--other than powered vehicle |
1 | -- | -- |
|
Struck by falling object or equipment-other than powered vehicle |
-- | 2 | 5 |
|
Caught in or compressed by equipment or objects |
-- | 3 | 7 |
|
Footnotes: |
|||
|
NOTE: Totals for major categories may include subcategories not shown separately. Percentages may not add to totals because of rounding. CFOI fatality counts exclude illness-related deaths unless precipitated by an injury event. |
|||
| Industry(1) | 2012(2) | 2013(p) | |
|---|---|---|---|
| Number | Number | Percent | |
|
Total |
22 | 42 | 100 |
|
Private industry |
15 | 38 | 90 |
|
Goods producing |
9 | 19 | 45 |
|
Natural resources and mining |
2 | 3 | 7 |
|
Agriculture, forestry, fishing and hunting |
2 | 3 | 7 |
|
Crop production |
1 | 1 | 2 |
|
Fishing, hunting and trapping |
1 | 2 | 5 |
|
Construction |
6 | 12 | 29 |
|
Construction |
6 | 12 | 29 |
|
Construction of buildings |
1 | -- | -- |
|
Heavy and civil engineering construction |
-- | 2 | 5 |
|
Specialty trade contractors |
4 | 8 | 19 |
|
Manufacturing |
1 | 4 | 10 |
|
Manufacturing |
1 | 4 | 10 |
|
Beverage and tobacco product manufacturing |
1 | -- | -- |
|
Chemical manufacturing |
-- | 1 | 2 |
|
Fabricated metal product manufacturing |
-- | 1 | 2 |
|
Computer and electronic product manufacturing |
-- | 1 | 2 |
|
Service providing |
6 | 19 | 45 |
|
Trade, transportation, and utilities |
2 | 11 | 26 |
|
Wholesale trade |
1 | 3 | 7 |
|
Merchant wholesalers, durable goods |
-- | 2 | 5 |
|
Merchant wholesalers, nondurable goods |
1 | 1 | 2 |
|
Retail trade |
-- | 2 | 5 |
|
Electronics and appliance stores |
-- | 1 | 2 |
|
Sporting goods, hobby, book, and music stores |
-- | 1 | 2 |
|
Transportation and warehousing |
1 | 6 | 14 |
|
Water transportation |
-- | 1 | 2 |
|
Truck transportation |
-- | 2 | 5 |
|
Transit and ground passenger transportation |
-- | 1 | 2 |
|
Support activities for transportation |
1 | 1 | 2 |
|
Financial activities |
-- | 1 | 2 |
|
Real estate and rental leasing |
-- | 1 | 2 |
|
Real estate |
-- | 1 | 2 |
|
Professional and business services |
3 | 4 | 10 |
|
Professional and technical services |
-- | 1 | 2 |
|
Professional, scientific and technical services |
-- | 1 | 2 |
|
Administrative and waste services |
3 | 3 | 7 |
|
Administrative and support services |
3 | 3 | 7 |
|
Education and health services |
-- | 1 | 2 |
|
Educational services |
-- | 1 | 2 |
|
Educational services |
-- | 1 | 2 |
|
Leisure and hospitality |
-- | 1 | 2 |
|
Accommodation and food services |
-- | 1 | 2 |
|
Accommodation |
-- | 1 | 2 |
|
Other services, except public administration |
-- | 1 | 2 |
|
Other services, except public administration |
-- | 1 | 2 |
|
Personal and laundry services |
-- | 1 | 2 |
|
Government(3) |
7 | 4 | 10 |
|
Federal government |
-- | 3 | 7 |
|
Local government |
5 | 1 | 2 |
|
Footnotes: |
|||
|
NOTE: Totals for major categories may include subcategories not shown separately. Percentages may not add to totals because of rounding. Dashes indicate no data reported or data that do not meet publication criteria. CFOI fatality counts exclude illness-related deaths unless precipitated by an injury event. |
|||
| Occupation(1) | 2012(2) | 2013(p) | |
|---|---|---|---|
| Number | Number | Percent | |
|
Total |
22 | 42 | 100 |
|
Management occupations |
-- | 2 | 5 |
|
Other management occupations |
-- | 2 | 5 |
|
Business and financial operation occupations |
-- | 1 | 2 |
|
Financial specialists |
-- | 1 | 2 |
|
Life, physical, and social science occupations |
-- | 2 | 5 |
|
Life scientists |
-- | 1 | 2 |
|
Life, physical, and social science technicians |
-- | 1 | 2 |
|
Education, training, and library occupations |
-- | 1 | 2 |
|
Preschool, primary, secondary, and special education school teachers |
-- | 1 | 2 |
|
Protective service occupations |
5 | 1 | 2 |
|
Law enforcement workers |
3 | 1 | 2 |
|
Other protective service workers |
1 | -- | -- |
|
Building and grounds cleaning and maintenance occupations |
3 | 3 | 7 |
|
Supervisors of building and grounds cleaning and maintenance workers |
-- | 1 | 2 |
|
Building cleaning and pest control workers |
-- | 1 | 2 |
|
Personal care and service occupations |
-- | 1 | 2 |
|
Funeral service workers |
-- | 1 | 2 |
|
Sales and related occupations |
-- | 2 | 5 |
|
Supervisors of sales workers |
-- | 1 | 2 |
|
Retail sales workers |
-- | 1 | 2 |
|
Construction and extraction occupations |
3 | 11 | 26 |
|
Construction trades workers |
3 | 10 | 24 |
|
Other construction and related workers |
-- | 1 | 2 |
|
Installation, maintenance, and repair occupations |
-- | 4 | 10 |
|
Vehicle and mobile equipment mechanics, installers, and repairers |
-- | 2 | 5 |
|
Other installation, maintenance, and repair occupations |
-- | 1 | 2 |
|
Transportation and material moving occupations |
3 | 6 | 14 |
|
Motor vehicle operators |
1 | 4 | 10 |
|
Water transportation workers |
1 | 1 | 2 |
|
Other transportation workers |
-- | 1 | 2 |
|
Military specific occupations(3) |
-- | 1 | 2 |
|
Footnotes: |
|||
|
NOTE: Totals for major categories may include subcategories not shown separately. Percentages may not add to totals because of rounding. Dashes indicate no data reported or data that do not meet publication criteria. CFOI fatality counts exclude illness-related deaths unless precipitated by an injury event. |
|||
| Worker characteristics | 2012(1) | 2013(p) | |
|---|---|---|---|
| Number | Number | Percent | |
|
Total |
22 | 42 | 100 |
| Employee status | |||
|
Wage and salary workers(2) |
18 | 35 | 83 |
|
Self-employed(3) |
4 | 7 | 17 |
| Gender | |||
|
Women |
3 | 4 | 10 |
|
Men |
19 | 38 | 90 |
| Age(4) | |||
|
18 to 19 years |
-- | 1 | 2 |
|
20 to 24 years |
-- | 1 | 2 |
|
25 to 34 years |
4 | 6 | 14 |
|
35 to 44 years |
5 | 5 | 12 |
|
45 to 54 years |
8 | 15 | 36 |
|
55 to 64 years |
3 | 8 | 19 |
|
65 years and over |
-- | 6 | 14 |
| Race or ethnic origin(5) | |||
|
White (non-Hispanic) |
18 | 35 | 83 |
|
Black or African-American (non-Hispanic) |
3 | -- | -- |
|
Hispanic or Latino |
1 | 1 | 2 |
|
Asian (non-Hispanic) |
-- | 3 | 7 |
|
Footnotes: |
|||
|
NOTE: Totals for major categories may include subcategories not shown separately. Percentages may not add to totals because of rounding. CFOI fatality counts exclude illness-related deaths unless precipitated by an injury event. |
|||
Last Modified Date: Wednesday, January 21, 2015