An official website of the United States government
An official website of the United States government
The .gov means it's official.
Federal government websites often end in .gov or .mil. Before sharing sensitive information,
make sure you're on a federal government site.
The site is secure.
The
https:// ensures that you are connecting to the official website and that any
information you provide is encrypted and transmitted securely.
15-1580-NEW
Friday, August 14, 2015
Among the 12 metropolitan areas in New York, 8 had annual wages that were significantly above the national average for elementary and middle school teachers, and 6 had significantly higher than average wages for secondary school teachers, the U.S. Bureau of Labor Statistics reported today. Chief Regional Economist Martin Kohli noted that except for secondary school teachers in Utica-Rome, no metropolitan area in New York had wages that fell measurably below those for the nation in any of the three teaching occupations. Nationwide, the average (mean) wage for elementary school teachers was $56,830; for middle school teachers, $57,620; and for secondary school teachers, $59,330. (See table A. For comprehensive definitions of metropolitan areas in New York, please see Technical Note.)
| Area | Elementary school teachers, except special education | Middle school teachers, except special and career/technical education | Secondary school teachers, except special and career/technical education |
|---|---|---|---|
|
United States |
$56,830 | $57,620 | $59,330 |
|
New York |
74,830* | 75,470* | 76,680* |
|
Albany-Schenectady-Troy |
60,000 | 63,610* | 61,770 |
|
Binghamton |
56,060 | 57,030 | 65,330* |
|
Buffalo-Niagara Falls |
59,750* | 60,370* | 61,120 |
|
Elmira |
55,200 | 65,150 | 63,710 |
|
Glens Falls |
61,890* | 68,220* | 64,310* |
|
Ithaca |
52,250 | 58,380 | 64,950 |
|
Kingston |
88,700* | 93,090* | 74,010* |
|
New York-Northern New Jersey-Long Island |
75,930* | 76,540* | 81,640* |
|
Nassau-Suffolk |
96,910* | 98,410* | 98,950* |
|
New York-White Plains-Wayne |
75,280* | 75,110* | 79,490* |
|
Poughkeepsie-Newburgh-Middletown |
79,380* | 79,630* | 80,760* |
|
Rochester |
59,580* | 59,970 | 58,160 |
|
Syracuse |
62,940* | 66,760* | 67,310* |
|
Utica-Rome |
62,740* | 62,230* | 57,040* |
|
Note: An asterisk indicates that the mean annual wage for this area is significantly different from the national average of all areas at the 90-percent confidence level. |
|||
Of the 12 metropolitan areas located entirely or partially in the state, the New York-Northern New Jersey-Long Island area had the largest number of elementary, middle, and secondary school teachers (184,980 in the three teaching occupations combined). Over half (102,240) of those positions were located in one of the area’s four divisions, New York-White Plains-Wayne. Another division, Nassau-Suffolk, had an additional 30,530 jobs in the highlighted occupations. (See table B. The New York metropolitan area’s other divisions, Newark-Union and Edison-New Brunswick, contain no counties in New York State, and their data have not been presented in this release.) Buffalo-Niagara Falls and Rochester were the two other metropolitan areas in New York state where the sum total of elementary, middle, and secondary school teachers was at least 10,000 employees.
| Area | Elementary school teachers, except special education | Middle school teachers, except special and career/technical education | Secondary school teachers, except special and career/technical education |
|---|---|---|---|
|
United States |
1,353,020 | 630,620 | 960,380 |
|
New York |
73,280 | 39,220 | 67,320 |
|
Albany-Schenectady-Troy |
3,430 | 1,440 | 3,150 |
|
Binghamton |
760 | 600 | 770 |
|
Buffalo-Niagara Falls |
4,280 | 2,210 | 4,550 |
|
Elmira |
320 | 140 | (1) |
|
Glens Falls |
400 | 200 | 540 |
|
Ithaca |
330 | 50 | 650 |
|
Kingston |
770 | 400 | 710 |
|
New York-Northern New Jersey-Long Island |
78,850 | 42,300 | 63,830 |
|
Nassau-Suffolk |
11,700 | 6,270 | 12,560 |
|
New York-White Plains-Wayne |
44,060 | 24,020 | 34,160 |
|
Poughkeepsie-Newburgh-Middletown |
2,620 | 1,740 | 2,920 |
|
Rochester |
4,610 | 2,170 | 5,420 |
|
Syracuse |
2,780 | 1,680 | 2,230 |
|
Utica-Rome |
1,370 | 520 | 1,070 |
|
Footnotes: |
|||
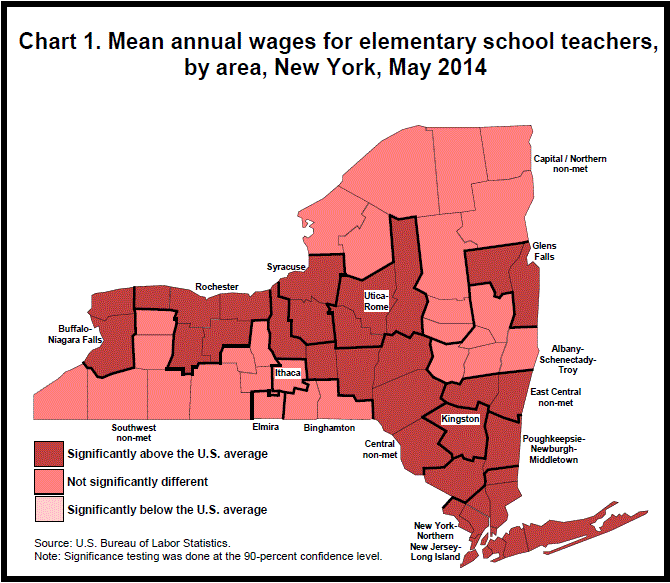
Eight metropolitan areas reported average wages for elementary school teachers that were significantly higher than the $56,830 national average, including Kingston ($88,700), Poughkeepsie-Newburgh-Middletown ($79,380), and the New York metropolitan area ($75,930). Four localities had wages for elementary school teachers that were not measurably different from the U.S. average. (For the purpose of completeness, the chart also includes nonmetropolitan areas.) (See chart 1.)
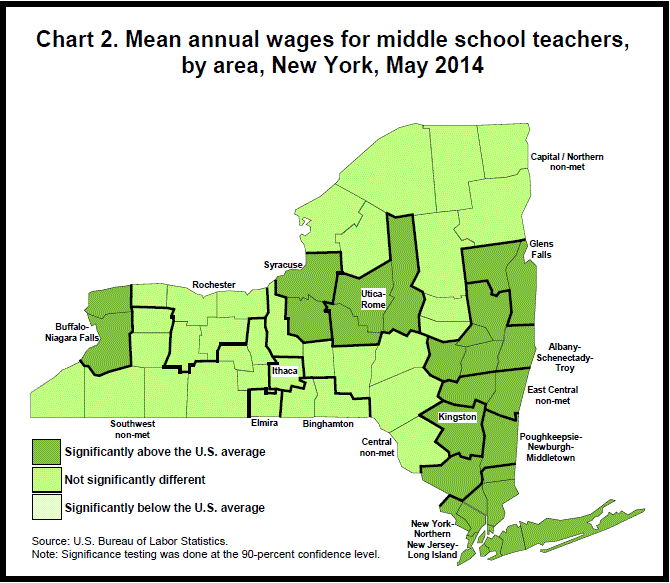
Wages for middle school teachers in metropolitan areas in New YorkKingston ($93,090), Poughkeepsie ($79,630), and the New York metropolitan area ($76,540) were among the highest paying areas for middle school teachers. Four areas in New York State had wages that were not measurably different from the U.S. average of $57,620. (See chart 2.)
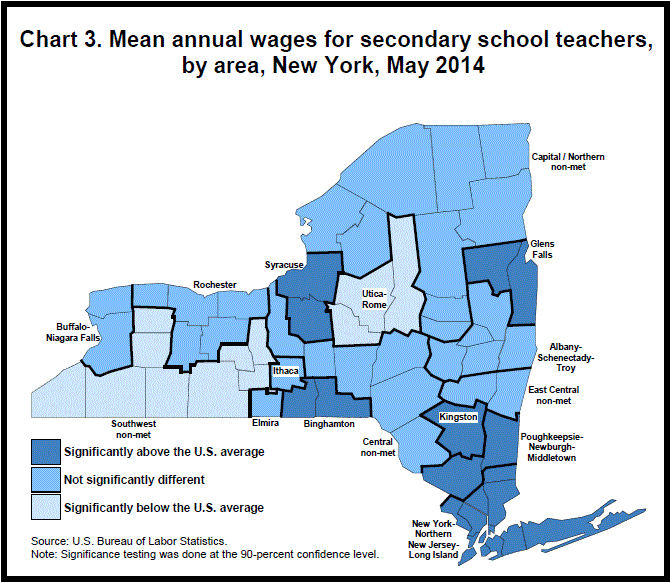
Wages for secondary school teachers in metropolitan areas in New YorkNew York-Northern New Jersey-Long Island ($81,640) and Poughkeepsie ($80,760) were the highest-paying metropolitan areas in the state for secondary school teachers. Wages in both of these areas were measurably higher than the national rate of $59,330. Four other areas had wages that were significantly above average, including Kingston ($74,010), Syracuse ($67,310), Binghamton ($65,330), and Glens Falls ($64,310). Five other areas had wages that were not measurably different from the national average. Utica-Rome ($57,040) was the only metropolitan area in New York State to report wages that were significantly below the national average for this occupation. (See chart 3.)
These statistics are from the Occupational Employment Statistics (OES) survey, a federal-state cooperative program between BLS and State Workforce Agencies, in this case, the New York State Department of Labor and the New Jersey Department of Labor and Workforce Development.
A value that is statistically different from another does not necessarily mean that the difference has economic or practical significance. Statistical significance is concerned with the ability to make confident statements about a universe based on a sample. It is entirely possible that a large difference between two values is not significantly different statistically, while a small difference is, since both the size and heterogeneity of the sample affect the relative error of the data being tested.
The Occupational Employment Statistics (OES) survey is a semiannual mail survey measuring occupational employment and wage rates for wage and salary workers in nonfarm establishments in the United States. Guam, Puerto Rico, and the Virgin Islands are also surveyed, but their data are not included in the national estimates. OES estimates are constructed from a sample of about 1.2 million establishments. Forms are mailed to approximately 200,000 sampled establishments in May and November each year. May 2014 estimates are based on responses from six semiannual panels collected over a 3-year period: May 2014, November 2013, May 2013, November 2012, May 2012, and November 2011. The overall national response rate for the six panels is 74.3 percent based on establishments and 70.5 percent based on weighted sampled employment. The unweighted employment of sampled establishments across all six semiannual panels represents approximately 57.1 percent of total national employment. (Response rates are slightly lower for these estimates due to the federal shutdown in October 2013.) For more information about OES concepts and methodology, go to www.bls.gov/news.release/ocwage.tn.htm.
The OES survey provides estimates of employment and hourly and annual wages for wage and salary workers in 22 major occupational groups and 821 detailed occupations for the nation, states, metropolitan statistical areas, metropolitan divisions, and nonmetropolitan areas. In addition, employment and wage estimates for 94 minor groups and 458 broad occupations are available in the national data. OES data by state and metropolitan/nonmetropolitan area are available from www.bls.gov/oes/current/oessrcst.htm and www.bls.gov/oes/current/oessrcma.htm, respectively.
The May 2014 OES estimates are based on the 2010 Standard Occupational Classification (SOC) system and the 2012 North American Industry Classification System (NAICS). Information about the 2010 SOC is available on the BLS website at www.bls.gov/soc and information about the 2012 NAICS is available at www.bls.gov/bls/naics.htm.
Metropolitan area definitions
The substate area data published in this release reflect the standards and definitions established by the U.S. Office of Management and Budget.
Information in this release will be made available to sensory impaired individuals upon request. Voice phone: 202-691-5200; Federal Relay Service: 800-877-8339.
Last Modified Date: Friday, August 14, 2015