An official website of the United States government
An official website of the United States government
The .gov means it's official.
Federal government websites often end in .gov or .mil. Before sharing sensitive information,
make sure you're on a federal government site.
The site is secure.
The
https:// ensures that you are connecting to the official website and that any
information you provide is encrypted and transmitted securely.
16-236-BOS
Wednesday, February 04, 2015
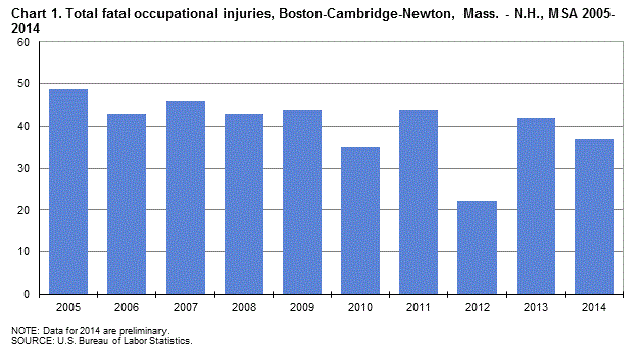
Fatal work injuries totaled 37 in 2014 for the Boston-Cambridge-Newton, Mass.-N.H. Metropolitan Statistical Area (MSA), the U.S. Bureau of Labor Statistics reported today. Regional Commissioner Deborah A. Brown noted that while the 2014 count was preliminary, the number of work-related fatalities in Boston decreased by five over the year. Since local area data became available in 2000 fatal occupational injuries in the metropolitan area have ranged from a high of 49 in 2005 to a low of 22 in 2012. (See chart 1.)
Nationwide, a preliminary total of 4,679 fatal work injuries were recorded in 2014, up from the revised count of 4,585 fatalities recorded in 2013, according to results from the Census of Fatal Occupational Injuries (CFOI) program. Final 2014 data are scheduled to be released in the late spring of 2016.
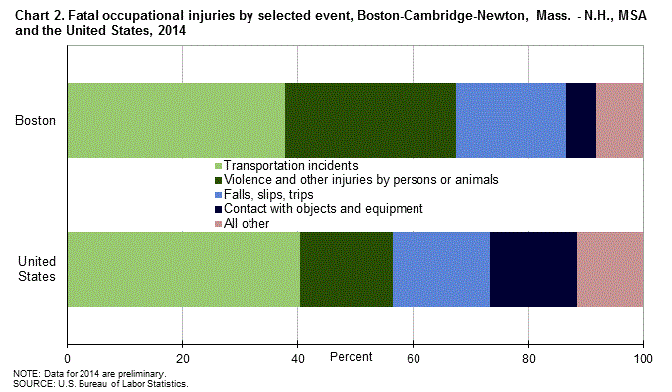
Of the 37 fatal work injuries reported in the Boston metropolitan area in 2014, transportation incidents resulted in 14 deaths. Violence and other injuries by persons or animals were responsible for 11 deaths, while falls, slips, and trips accounted for 7 fatal work injuries. (See table 1). Six of the fatalities within the transportation incidents category were the result of aircraft incidents and five were roadway incidents involving motorized land vehicles. Within the violence and other injuries by persons or animals category, 8 of the 11 fatalities were due to suicides. (Note that roadway incident counts presented in this release are expected to rise when updated 2014 data are released in the late spring of 2016 because key source documentation detailing specific transportation-related incidents has not yet been received.)
In the United States, transportation incidents was the most frequent fatal workplace event in 2014, accounting for 40 percent of fatal work injuries. Boston’s share of on-the-job fatalities due to this event was 38 percent. (See chart 2.) Falls, slips, and trips was the second-most frequent event nationally, with 17 percent of work-related fatalities; the share in the Boston area was 19 percent. Violence and other injuries by persons or animals accounted for 16 percent of workplace deaths nationally; this event accounted for 30 percent of the workplace fatalities in the Boston area.
Additional key characteristics:
The trade, transportation, and utilities sector had 8 fatal work injuries in the local area in 2014, compared to 11 the previous year. Three of the worker deaths in this sector were caused by aircraft incidents. (See table 2.)
The other services, except public administration sector also had eight workplace deaths in the Boston area in 2014, up from one recorded the previous year. Two of the fatal work injuries in this sector were the result of homicides.
Construction and extraction occupations and transportation and material moving occupations had eight on-the-job deaths each in the Boston area, the highest number among all occupational groups. (See table 3.)
Men accounted for 33, or 89 percent, of the work-related fatalities in the Boston area. (See table 4.)
In the Boston area, 84 percent of those who died from a workplace injury were white non-Hispanics, compared to the national share of 68 percent.
Workers 25-54 years old, the prime working age group, accounted for 70 percent of the local area’s workplace fatalities. Nationally, workers in this age group accounted for a 58-percent share of on-the-job fatalities. Workers 55 years of age and older accounted for 30 percent of workplace deaths locally, compared to 35 percent nationally.
Of the 37 persons that suffered fatal work injuries in Boston, 86 percent worked for wages and salaries, the remaining were self-employed.
Background of the program. The Census of Fatal Occupational Injuries, part of the BLS occupational safety and health statistics program, compiles a count of all fatal work injuries occurring in the United States during the calendar year. The program uses diverse state, federal, and independent data sources to identify, verify, and describe fatal work injuries. This assures counts are as complete and accurate as possible.
For technical information about the CFOI program, please go to the BLS Handbook of Methods on the BLS web site at www.bls.gov/opub/hom/pdf/homch9.pdf.
Federal/State agency coverage. The Census of Fatal Occupational Injuries includes data for all fatal work injuries, whether the decedent was working in a job covered by the Occupational Safety and Health Administration (OSHA) or other federal or state agencies or was outside the scope of regulatory coverage. Thus, any comparison between the BLS fatality census counts and those released by other agencies should take into account the different coverage requirements and definitions being used by each agency.
Acknowledgments. The Bureau of Labor Statistics appreciates the efforts of all federal, state, local, and private sector entities that submitted source documents used to identify fatal work injuries, in particular the Massachusetts Department of Public Health.
The Boston-Cambridge-Newton, Mass.-N.H. Metropolitan Statistical Area (MSA) includes Essex, Middlesex, Norfolk, Plymouth, and Suffolk Counties in Massachusetts and Rockingham and Strafford Counties in New Hampshire.
Information in this release will be made available to sensory impaired individuals upon request. Voice phone: 202-691-5200; Federal Relay Service: 800-877-8339.
| Event or exposure[1] | 2013[2] | 2014[p] | |
|---|---|---|---|
| Number | Number | Percent | |
|
Total |
42 | 37 | 100 |
|
Violence and other injuries by persons or animals |
15 | 11 | 30 |
|
Intentional injury by person |
13 | 11 | 30 |
|
(Homicides) Intentional injury by other person |
6 | 3 | 8 |
|
(Suicides) Self-inflicted injury-intentional |
7 | 8 | 22 |
|
Transportation incidents |
9 | 14 | 38 |
|
Aircraft incidents |
-- | 6 | 16 |
|
Pedestrian vehicular incidents |
2 | 2 | 5 |
|
Pedestrian struck by vehicle in nonroadway area |
1 | 1 | 3 |
|
Water vehicle incidents |
3 | 1 | 3 |
|
Roadway incident involving motorized land vehicle |
3 | 5 | 14 |
|
Roadway collision with object other than vehicle |
-- | 1 | 3 |
|
Roadway noncollision incident |
2 | 2 | 5 |
|
Fires and explosions |
1 | 2 | 5 |
|
Falls, slips, trips |
9 | 7 | 19 |
|
Fall to lower level |
8 | 6 | 16 |
|
Fall through surface or existing opening |
-- | 3 | 8 |
|
Other fall to lower level |
7 | 3 | 8 |
|
Contact with objects and equipment |
6 | 2 | 5 |
|
Struck by object or equipment |
3 | 1 | 3 |
|
Caught in or compressed by equipment or objects |
3 | 1 | 3 |
|
(1) Based on the BLS Occupational Injury and Illness Classification System (OIICS) 2.01 implemented for 2011 data forward. |
|||
|
(2) Data for 2013 are revised and final. |
|||
|
(p) Data for 2014 are preliminary. Revised and final 2014 data are scheduled to be released in spring 2016. |
|||
|
Note: Totals for major categories may include subcategories not shown separately. Percentages may not add to totals because of rounding. CFOI fatality counts exclude illness-related deaths unless precipitated by an injury event. Dashes indicate no data reported or data that do not meet publication guidelines. |
|||
| Industry[1] | 2013[2] | 2014[p] | |
|---|---|---|---|
| Number | Number | Percent | |
|
Total |
42 | 37 | 100 |
|
Private industry |
38 | 32 | 86 |
|
Goods producing |
19 | 7 | 19 |
|
Natural resources and mining |
3 | 1 | 3 |
|
Agriculture, forestry, fishing and hunting |
3 | 1 | 3 |
|
Construction |
12 | 6 | 16 |
|
Construction |
12 | 6 | 16 |
|
Construction of buildings |
-- | 3 | 8 |
|
Specialty trade contractors |
8 | 3 | 8 |
|
Service providing |
19 | 25 | 68 |
|
Trade, transportation, and utilities |
11 | 8 | 22 |
|
Retail Trade |
2 | 2 | 5 |
|
Food and beverage stores |
-- | 2 | 5 |
|
Transportation and warehousing |
6 | 6 | 16 |
|
Air transportation |
- | 3 | 8 |
|
Truck transportation |
2 | 1 | 3 |
|
Transit and ground passenger transportation |
1 | 1 | 3 |
|
Support activities for transportation |
1 | 1 | 3 |
|
Information |
-- | 1 | 3 |
|
Professional and business services |
4 | 6 | 16 |
|
Administrative and waste services |
3 | 6 | 16 |
|
Administrative and support services |
3 | 4 | 11 |
|
Educational and health services |
1 | 1 | 3 |
|
Health care and social assistance |
-- | 1 | 3 |
|
Social assistance |
-- | 1 | 3 |
|
Leisure and hospitality |
1 | 1 | 3 |
|
Accommodation and food services |
1 | 1 | 3 |
|
Food service and drinking places |
-- | 1 | 3 |
|
Other services, except public administration |
1 | 8 | 22 |
|
Other services, except public administration |
1 | 8 | 22 |
|
Repair and maintenance |
-- | 4 | 11 |
|
Personal and laundry services |
1 | 2 | 5 |
|
Religious, grantmaking, civic, professional, and similar organizations |
-- | 2 | 5 |
|
Government[3] |
4 | 5 | 14 |
|
Local government |
1 | 5 | 14 |
|
[1] Industry data for 2013 are based on the North American Industry Classification System, 2007. Industry data for 2014 are based on the North American Industry Classification System, 2012 |
|||
|
[2] Data for 2013 are revised and final. |
|||
|
[3] Includes fatal injuries to workers employed by governmental organizations regardless of industry. |
|||
|
[p] Data for 2014 are preliminary. Revised and final 2014 data are scheduled to be released in spring 2015. |
|||
|
Note: Totals for major categories may include subcategories not shown separately. Percentages may not add to totals because of rounding. CFOI fatality counts exclude illness-related deaths unless precipitated by an injury event. Dashes indicate no data reported or data that do not meet publication criteria. |
|||
| Occupation[1] | 2013[2] | 2014[p] | |
|---|---|---|---|
| Number | Number | Percent | |
|
Total |
42 | 37 | 100 |
|
Management occupations |
2 | 4 | 11 |
|
Top executives |
-- | 3 | 8 |
|
Other management occupations |
2 | 1 | 3 |
|
Protective service occupations |
1 | 4 | 11 |
|
Supervisors of protective service workers |
-- | 1 | 3 |
|
Fire fighting and prevention workers |
-- | 1 | 3 |
|
Law enforcement workers |
1 | 2 | 5 |
|
Building and grounds cleaning and maintenance occupations |
3 | 4 | 11 |
|
Supervisors of building and grounds cleaning and maintenance workers |
1 | 1 | 3 |
|
Grounds maintenance workers |
-- | 2 | 5 |
|
Personal care and service occupations |
1 | 2 | 5 |
|
Personal appearance workers |
-- | 2 | 5 |
|
Sales and related occupations |
2 | 1 | 3 |
|
Supervisors of sales workers |
1 | 1 | 3 |
|
Farming, fishing, and forestry occupations |
-- | 1 | 3 |
|
Fishing and hunting workers |
-- | 1 | 3 |
|
Construction and extraction occupations |
11 | 8 | 22 |
|
Supervisors of construction and extraction workers |
-- | 2 | 5 |
|
Construction trades workers |
10 | 5 | 14 |
|
Other construction and related workers |
1 | 1 | 3 |
|
Installation, maintenance, and repair occupations |
4 | 5 | 14 |
|
Supervisors of installation, maintenance, and repair workers |
-- | 2 | 5 |
|
Vehicle and mobile equipment mechanics, installers, and repairers |
2 | 2 | 5 |
|
Other installation, maintenance, and repair occupations |
1 | 1 | 3 |
|
Transportation and material moving occupations |
6 | 8 | 22 |
|
Air transportation workers |
-- | 3 | 8 |
|
Motor vehicle operators |
4 | 4 | 11 |
|
Material moving workers |
-- | 1 | 3 |
|
[1] Occupation data are based on the Standard Occupational Classification system, 2010. |
|||
|
[2] Totals for 2013 are revised and final |
|||
|
[p] Data for 2014 are preliminary. Revised and final 2014 data are scheduled to be released in spring 2016. |
|||
|
Note: Totals for major categories may include subcategories not shown separately. Percentages may not add to totals because of rounding. CFOI fatality counts exclude illness-related deaths unless precipitated by an injury event. Dashes indicate no data reported or data that do not meet publication criteria. |
|||
| Worker characteristics | 2013[1] | 2014[p] | |
|---|---|---|---|
| Number | Number | Percent | |
|
Total |
42 | 37 | 100 |
| Employee status | |||
|
Wage and salary workers[2] |
35 | 32 | 86 |
|
Self-employed[3] |
7 | 5 | 14 |
| Gender | |||
|
Women |
4 | 4 | 11 |
|
Men |
38 | 33 | 89 |
| Age[4] | |||
|
25 to 34 years |
6 | 5 | 14 |
|
35 to 44 years |
5 | 9 | 24 |
|
45 to 54 years |
15 | 12 | 32 |
|
55 to 64 years |
8 | 6 | 16 |
|
65 years and over |
6 | 5 | 14 |
| Race or ethnic origin[5] | |||
|
White (non-Hispanic) |
35 | 31 | 84 |
|
Black or African-American (non-Hispanic) |
-- | 3 | 8 |
|
Hispanic or Latino |
1 | 1 | 3 |
|
Asian (non-Hispanic) |
3 | 2 | 5 |
|
[1] Totals for 2013 are revised and final. |
|||
|
[2] May include volunteers and workers receiving other types of compensation. |
|||
|
[3] Includes self-employed workers, owners of unincorporated businesses and farms, paid and unpaid family workers, and may include some owners of incorporated businesses or members of partnerships. |
|||
|
[4] Information may not be available for all age groups. |
|||
|
[5] Persons identified as Hispanic or Latino may be of any race. The racial categories shown exclude data for Hispanics and Latinos. |
|||
|
[p] Data for 2014 are preliminary. Revised and final 2014 data are scheduled to be released in spring 2016. |
|||
|
Note: Totals for major categories may include subcategories not shown separately. CFOI fatality counts exclude illness-related deaths unless precipitated by an injury event. Dashes indicate no data reported or data that do not meet publication criteria. |
|||
Last Modified Date: Wednesday, February 04, 2015