An official website of the United States government
An official website of the United States government
The .gov means it's official.
Federal government websites often end in .gov or .mil. Before sharing sensitive information,
make sure you're on a federal government site.
The site is secure.
The
https:// ensures that you are connecting to the official website and that any
information you provide is encrypted and transmitted securely.
19-420-NEW
Wednesday, March 13, 2019
Gasoline prices averaged $2.477 per gallon in the New York-Newark-Jersey City area in February 2019, the U.S. Bureau of Labor Statistics reported today. Chief Regional Economist Martin Kohli noted that gasoline prices were down $0.273 compared to last February when area households paid $2.750 per gallon. Electricity prices averaged 19.6 cents per kilowatt hour (kWh), similar to the 19.8 cents per kWh paid in February 2018. The average price of utility (piped) gas, at $1.296 per therm, was greater than last February’s price of $1.241. (Data in this release are not seasonally adjusted; accordingly, over-the-year-analysis is used throughout.)
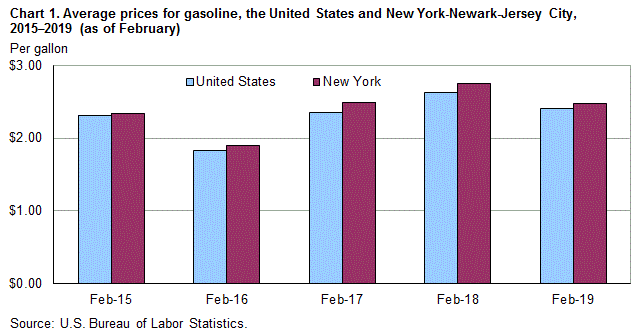
At $2.477 a gallon, the price of gasoline in the New York area compared to a $2.412 national average in February 2019. One year earlier, New York area gasoline prices were 4.5 percent above than the national average. For four of the past five years, the local price of a gallon of gasoline in February has been within 5 percent of the national average. (See chart 1.)
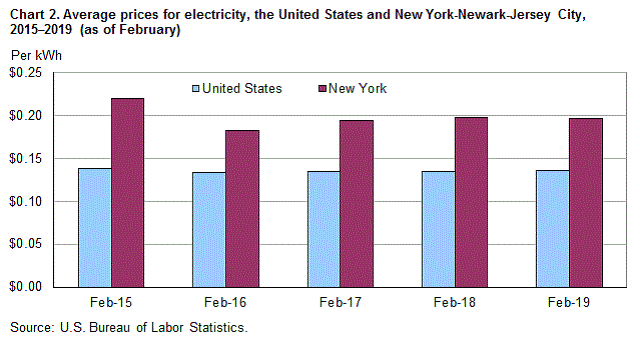
The 19.6 cents per kWh New York households paid for electricity in February 2019 was 44 percent greater than the national average of 13.6 cents per kWh. Last February, electricity prices were 47 percent higher in New York compared to the nation. In the past five years, electricity charges for local area consumers in February were 36 to 59 percent higher than the national average. (See chart 2.)
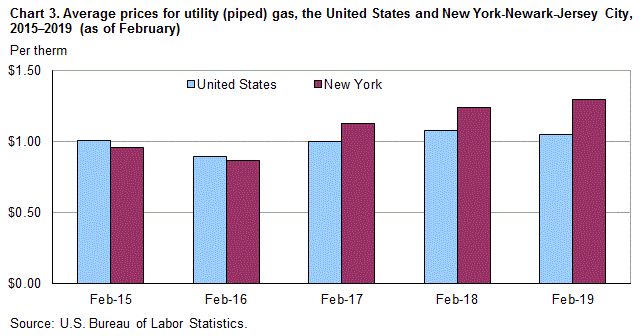
The average price paid in February 2019 by New York area consumers for utility (piped) gas, commonly referred to as natural gas, was $1.296 per therm, 23 percent higher than the national average of $1.051. In 2018, area natural gas prices were 15 percent above than the national average. In contrast, the per-therm cost for natural gas in the New York in February 2015 and 2016 was within 5 percent of the U.S. average. (See chart 3.)
The New York-Newark-Jersey City, N.Y.-N.J.-Pa., Core Based Statistical Area includes Bronx, Dutchess, Kings, Nassau, New York, Orange, Putnam, Queens, Richmond, Rockland, Suffolk, and Westchester Counties in New York; Bergen, Essex, Hudson, Hunterdon, Middlesex, Monmouth, Morris, Ocean, Passaic, Somerset, Sussex, and Union Counties in New Jersey; and Pike County in Pennsylvania.
The Consumer Price Index for March 2019 is scheduled to be released on Wednesday, April 10, 2019 at 8:30 a.m. (ET).
Average prices are estimated from Consumer Price Index (CPI) data for selected commodity series to support the research and analytic needs of CPI data users. Average prices for electricity, utility (piped) gas, and gasoline are published monthly for the U.S. city average, the 4 regions, 9 divisions, 2 population size classes, 8 region/size-class cross-classifications, and the 23 largest local index areas. For electricity, average prices per kilowatt-hour (kWh) are published. For utility (piped) gas, average prices per therm, are published. For gasoline, the average price per gallon is published. Average prices for commonly available grades of gasoline are published as well as the average price across all grades.
All eligible prices are converted to a price per normalized quantity. These prices are then used to estimate a price for a defined fixed quantity. The average price per kilowatt-hour represents the total bill divided by the kilowatt-hour usage. The total bill is the sum of all items applicable to all consumers appearing on an electricity bill including, but not limited to, variable rates per kWh, fixed costs, taxes, surcharges, and credits. This calculation also applies to the average price per therm for utility (piped) gas.
Information in this release will be made available to sensory impaired individuals upon request. Voice phone: 202-691-5200; Federal Relay Service: 800-877-8339.
| Year and month | Gasoline per gallon | Electricity per kWh | Utility (piped) gas per therm | |||
|---|---|---|---|---|---|---|
| New York | United States | New York | United States | New York | United States | |
2018 | ||||||
February | $2.750 | $2.632 | $0.198 | $0.135 | $1.241 | $1.077 |
March | 2.682 | 2.631 | 0.206 | 0.135 | 1.225 | 1.054 |
April | 2.814 | 2.795 | 0.203 | 0.134 | 1.212 | 1.044 |
May | 3.020 | 2.963 | 0.210 | 0.136 | 1.262 | 1.050 |
June | 3.065 | 2.970 | 0.217 | 0.139 | 1.244 | 1.042 |
July | 3.003 | 2.930 | 0.216 | 0.139 | 1.258 | 1.038 |
August | 2.988 | 2.919 | 0.208 | 0.139 | 1.220 | 1.055 |
September | 2.975 | 2.930 | 0.212 | 0.138 | 1.183 | 1.030 |
October | 2.974 | 2.945 | 0.206 | 0.136 | 1.154 | 1.023 |
November | 2.845 | 2.733 | 0.194 | 0.134 | 1.226 | 1.020 |
December | 2.655 | 2.479 | 0.193 | 0.135 | 1.294 | 1.085 |
2019 | ||||||
January | 2.507 | 2.352 | 0.202 | 0.135 | 1.337 | 1.082 |
February | 2.477 | 2.412 | 0.196 | 0.136 | 1.296 | 1.051 |
Last Modified Date: Wednesday, March 13, 2019