An official website of the United States government
An official website of the United States government
The .gov means it's official.
Federal government websites often end in .gov or .mil. Before sharing sensitive information,
make sure you're on a federal government site.
The site is secure.
The
https:// ensures that you are connecting to the official website and that any
information you provide is encrypted and transmitted securely.
23-756-NEW
Wednesday, April 19, 2023
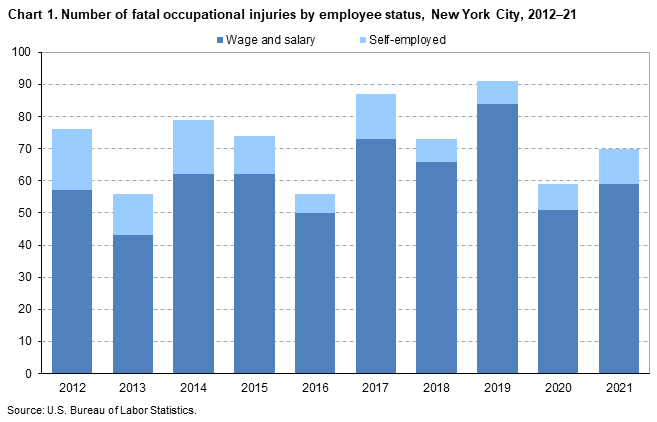
Fatal work injuries totaled 70 in 2021 for New York City, the U.S. Bureau of Labor Statistics reported today. Regional Commissioner William J. Sibley noted that the number of work-related fatalities in New York City was up from the previous year. (See chart 1.) Fatal occupational injuries in the city have ranged from a high of 191 in 1993 to a low of 56 in 2013 and 2016. Nationwide, a total of 5,190 fatal work injuries were recorded in 2021, a 9-percent increase from 4,764 in 2020, according to the results from the Census of Fatal Occupational Injuries (CFOI).
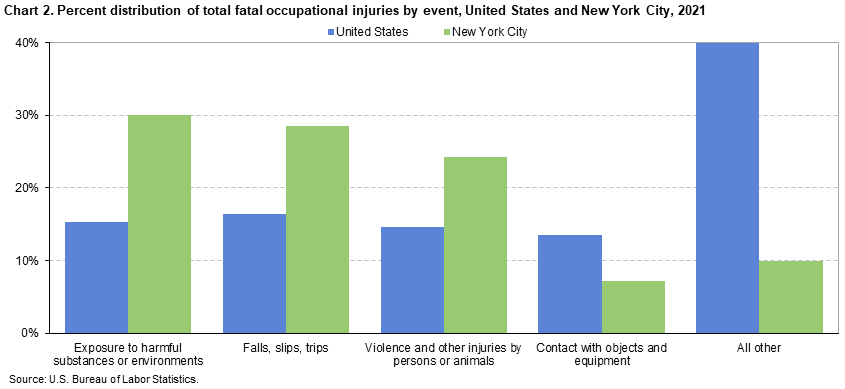
Fatal event or exposureIn New York City, exposure to harmful substances or environments resulted in 21 fatal work injuries, and falls, slips, and trips accounted for 20 fatalities. These two major categories accounted for 59 percent of all fatal workplace injuries in the city. (See chart 2 and table 1.) Worker deaths from exposure to harmful substances or environments were up from 17 in 2020. Of the 21 fatalities resulting from harmful exposures in 2021, 17 involved nonmedical use of drugs or alcohol—unintentional overdose. Worker fatalities due to falls, slips, or trips were up from 13 during the previous year.
Violence and other injuries by persons or animals was the third-most frequent fatal work event with 17 fatalities, up from 13 in the prior year. Contact with objects or equipment resulted in five work-related deaths, down from seven in 2020.
Nationally, transportation incidents were the most frequent fatal event in 2021, accounting for 38 percent of fatal work injuries. Falls, slips, and trips was the second-most common fatal event (16 percent), followed by both exposure to harmful substances or environments and violence and other injuries by persons or animals (15 percent each) and contact with objects and equipment (14 percent).
IndustryThe private construction industry sector had the highest number of fatal work injuries in New York City with 22, up from 13 in the previous year. (See table 2.) Falls, slips, or trips resulted in 12 of the 22 fatalities in the industry.
The second highest total among private industry sectors occurred in administrative and waste services, with seven fatal workplace injuries, up from four in the previous year.
Two sectors—retail trade and other services, except public administration—each had six work fatalities in 2021. For retail trade, the total number of fatalities decreased from seven in the previous year. The fatality count for other services was up from three in 2020.
OccupationThe construction and extraction occupational group had the highest number of fatal workplace injuries with 20. (See table 3.) Transportation and material moving occupations had the second-highest number of fatal workplace injuries with eight.
Additional highlightsMen accounted for 96 percent of the work-related fatalities in New York City, compared to their national share of 91 percent. (See table 4.)
Hispanic or Latino workers accounted for 34 percent of New York City’s fatal injuries. Nationwide, this group accounted for 22 percent of work-related deaths.
Of the 70 fatally injured workers in New York City, 84 percent worked for wages and salaries; the remainder were self-employed. Nationwide, 83 percent of occupational fatalities involved wage and salary workers.
Background of the program. The Census of Fatal Occupational Injuries (CFOI), part of the Bureau of Labor Statistics (BLS) Occupational Safety and Health Statistics (OSHS) program, is a count of all fatalities resulting from workplace injuries occurring in the U.S. during the calendar year. The CFOI uses a variety of state, federal, and independent data sources to identify, verify, and describe fatal work injuries. This ensures counts are as complete and accurate as possible. For the 2021 national data, over 23,900 unique source documents were reviewed as part of the data collection process. For technical information and definitions for the CFOI, see the BLS Handbook of Methods at www.bls.gov/opub/hom/cfoi/home.htm and the CFOI definitions at www.bls.gov/iif/definitions/occupational-safety-and-health-definitions.htm.
Federal/State agency coverage. The CFOI includes data for all fatal work injuries, some of which may be outside the scope of other agencies or regulatory coverage. Comparisons between CFOI counts and those released by other agencies should account for the different coverage requirements and definitions used by each agency. For more information on the scope of CFOI, see www.bls.gov/iif/overview/cfoi-scope.htm and www.bls.gov/opub/hom/cfoi/concepts.htm.
Latency Cases. Latent fatal occupational injury cases occur when the date of injury differs from the date of death. In some cases, the death occurs in a different year than the occupational injury and are known as cross-year latent cases. In 2021, there were 197 cases nationally where this occurred, and 174 of these latent cases occurred more than 30 days prior to the start of 2021. For more information on latent cases, see www.bls.gov/opub/btn/volume-10/latency-in-fatal-occupational-injuries.htm.
Coronavirus (COVID-19) Pandemic and the Census of Fatal Occupational Injuries. CFOI reports fatal workplace injuries only. These may include fatal workplace injuries complicated by an illness such as COVID-19. Fatal workplace illnesses not precipitated by an injury are not in scope for CFOI. CFOI does not report any illness related information, including COVID-19. Additional information is available at www.bls.gov/covid19/effects-of-covid-19-on-workplace-injuries-and-illnesses-compensation-and-occupational-requirements.htm.
Acknowledgments. BLS thanks the New York City government for their efforts in collecting accurate, comprehensive, and useful data on fatal work injuries. BLS also appreciates the efforts of all federal, state, local, and private sector entities that provided source documents used to identify fatal work injuries. Among these agencies are the Occupational Safety and Health Administration; the National Transportation Safety Board; the U.S. Coast Guard; the Mine Safety and Health Administration; the Office of Workers’ Compensation Programs (Federal Employees' Compensation and Longshore and Harbor Workers' Compensation divisions); the Federal Railroad Administration; the National Highway Traffic Safety Administration; state vital statistics registrars, coroners, and medical examiners; state departments of health, labor, and industrial relations and workers' compensation agencies; state and local police departments; and state farm bureaus.
Information in this release will be made available to individuals with sensory impairments upon request. Voice phone: (202) 691-5200; Telecommunications Relay Service: 7-1-1.
| Event or exposure (1) | 2020 | 2021 | |
|---|---|---|---|
| Number | Number | Percent | |
Total | 59 | 70 | 100 |
Violence and other injuries by persons or animals | 13 | 17 | 24 |
Intentional injury by person | 13 | 17 | 24 |
Intentional injury by other person | 7 | -- | -- |
Shooting by other person–intentional | 3 | -- | -- |
Self-inflicted injury–intentional | 6 | -- | -- |
Transportation incidents | -- | -- | -- |
Fires and explosions | -- | -- | -- |
Falls, slips, trips | 13 | 20 | 29 |
Falls to lower level | 13 | 20 | 29 |
Fall through surface or existing opening | 3 | -- | -- |
Other fall to lower level | 10 | 15 | 21 |
Other fall to lower level 11 to 15 feet | -- | 3 | 4 |
Other fall to lower level 26 to 30 feet | -- | 3 | 4 |
Other fall to lower level more than 30 feet | 4 | 4 | 6 |
Exposure to harmful substances or environments | 17 | 21 | 30 |
Exposure to other harmful substances | -- | 17 | 24 |
Nonmedical use of drugs or alcohol--unintentional overdose | -- | 17 | 24 |
Contact with objects and equipment | 7 | 5 | 7 |
Struck by object or equipment | 4 | -- | -- |
Overexertion and bodily reaction | -- | -- | -- |
Footnotes: | |||
NOTE: Data for all years are final. Totals for major categories may include subcategories not shown separately. For complete information on how the data are coded and presented see our definitions page at https://www.bls.gov/iif/definitions/census-of-fatal-occupational-injuries-definitions.htm. Dashes indicate no data reported or data that do not meet publication criteria. CFOI fatal injury counts exclude illness-related deaths unless precipitated by an injury event. | |||
| Industry (1) | 2020 | 2021 | |
|---|---|---|---|
| Number | Number | Percent | |
Total | 59 | 70 | 100 |
Private industry (2) | 55 | 65 | 93 |
Goods producing | -- | -- | -- |
Natural resources and mining | -- | -- | -- |
Construction | 13 | 22 | 31 |
Construction | 13 | 22 | 31 |
Specialty trade contractors | 8 | 18 | 26 |
Building equipment contractors | 4 | 6 | 9 |
Plumbing, heating, and air-conditioning contractors | -- | 3 | 4 |
Building finishing contractors | -- | 6 | 9 |
Painting and wall covering contractors | -- | 3 | 4 |
Manufacturing | 3 | 3 | 4 |
Manufacturing | 3 | 3 | 4 |
Service providing (3) | -- | -- | -- |
Trade, transportation, and utilities | -- | -- | -- |
Wholesale trade | -- | -- | -- |
Retail trade | 7 | 6 | 9 |
Food and beverage stores | 5 | -- | -- |
Grocery stores | 5 | -- | -- |
Transportation and warehousing | 6 | 5 | 7 |
Transit and ground passenger transportation | -- | 3 | 4 |
Taxi and limousine service | -- | 3 | 4 |
Information | -- | -- | -- |
Financial activities | -- | -- | -- |
Real estate and rental and leasing | 3 | -- | -- |
Professional and business services | 4 | -- | -- |
Administrative and support and waste management and remediation services | 4 | 7 | 10 |
Administrative and support services | 4 | -- | -- |
Educational and health services | 4 | -- | -- |
Health care and social assistance | 4 | 3 | 4 |
Leisure and hospitality | -- | 3 | 4 |
Accommodation and food services | 6 | 3 | 4 |
Food services and drinking places | -- | 3 | 4 |
Restaurants and other eating places | -- | 3 | 4 |
Restaurants and other eating places | -- | 3 | 4 |
Full-service restaurants | -- | 3 | 4 |
Other services, except public administration | 3 | 6 | 9 |
Other services, except public administration | 3 | 6 | 9 |
Repair and maintenance | -- | 3 | 4 |
Government (4) | 4 | 5 | 7 |
Federal government | -- | -- | -- |
State government | -- | -- | -- |
Local government | 4 | 3 | 4 |
Footnotes: | |||
NOTE: Data for all years are final. Totals for major categories may include subcategories not shown separately. For complete information on how the data are coded and presented see our definitions page at https://www.bls.gov/iif/definitions/census-of-fatal-occupational-injuries-definitions.htm. Dashes indicate no data reported or data that do not meet publication criteria. CFOI fatal injury counts exclude illness-related deaths unless precipitated by an injury event. | |||
| Occupation (1) | 2020 | 2021 | |
|---|---|---|---|
| Number | Number | Percent | |
Total | 59 | 70 | 100 |
Management occupations | -- | 3 | 4 |
Other management occupations | -- | 3 | 4 |
Business and financial operations occupations | -- | -- | -- |
Computer and mathematical occupations | -- | -- | -- |
Architecture and engineering occupations | -- | -- | -- |
Life, physical, and social science occupations | -- | -- | -- |
Community and social service occupations | -- | -- | -- |
Legal occupations | -- | -- | -- |
Educational instruction and library occupations | -- | -- | -- |
Arts, design, entertainment, sports, and media occupations | -- | 3 | 4 |
Healthcare practitioners and technical occupations | -- | -- | -- |
Healthcare support occupations | -- | -- | -- |
Protective service occupations | -- | -- | -- |
Food preparation and serving related occupations | 4 | 3 | 4 |
Building and grounds cleaning and maintenance occupations | 6 | 6 | 9 |
Supervisors of building and grounds cleaning and maintenance workers | 3 | -- | -- |
First-line supervisors of building and grounds cleaning and maintenance workers | 3 | -- | -- |
Building cleaning and pest control workers | -- | 4 | 6 |
Building cleaning workers | -- | 4 | 6 |
Janitors and cleaners, except maids and housekeeping cleaners | -- | 4 | 6 |
Personal care and service occupations | -- | 3 | 4 |
Sales and related occupations | 5 | 5 | 7 |
Retail sales workers | 3 | -- | -- |
Cashiers | 3 | -- | -- |
Office and administrative support occupations | -- | -- | -- |
Farming, fishing, and forestry occupations | -- | -- | -- |
Construction and extraction occupations | 13 | 20 | 29 |
Construction trades workers | -- | 17 | 24 |
Construction laborers | -- | 8 | 11 |
Construction laborers | -- | 8 | 11 |
Painters and paperhangers | -- | 3 | 4 |
Painters, construction and maintenance | -- | 3 | 4 |
Other construction and related workers | -- | 3 | 4 |
Installation, maintenance, and repair occupations | 4 | 7 | 10 |
Vehicle and mobile equipment mechanics, installers, and repairers | -- | 4 | 6 |
Production occupations | 4 | -- | -- |
Transportation and material moving occupations | 10 | 8 | 11 |
Footnotes: | |||
NOTE: Data for all years are final. Totals for major categories may include subcategories not shown separately. For complete information on how the data are coded and presented see our definitions page at https://www.bls.gov/iif/definitions/census-of-fatal-occupational-injuries-definitions.htm. Dashes indicate no data reported or data that do not meet publication criteria. CFOI fatal injury counts exclude illness-related deaths unless precipitated by an injury event. | |||
| Worker characteristics | 2020 | 2021 | |
|---|---|---|---|
| Number | Number | Percent | |
Total | 59 | 70 | 100 |
Employee status | |||
Wage and salary workers (1) | 51 | 59 | 84 |
Self-employed (2) | 8 | 11 | 16 |
Gender | |||
Men | -- | 67 | 96 |
Women | -- | 3 | 4 |
Age (3) | |||
20 to 24 years | 5 | -- | -- |
25 to 34 years | 11 | 12 | 17 |
35 to 44 years | 16 | 15 | 21 |
45 to 54 years | 11 | 20 | 29 |
55 to 64 years | 8 | 16 | 23 |
65 years and over | 8 | -- | -- |
Race or ethnic origin (4) | |||
White, non-Hispanic | 18 | 30 | 43 |
Black or African-American, non-Hispanic | 11 | -- | -- |
Hispanic or Latino | 23 | 24 | 34 |
Asian, non-Hispanic | -- | 9 | 13 |
Footnotes: | |||
NOTE: Data for all years are final. Totals for major categories may include subcategories not shown separately. For complete information on how the data are coded and presented see our definitions page at https://www.bls.gov/iif/definitions/census-of-fatal-occupational-injuries-definitions.htm. Dashes indicate no data reported or data that do not meet publication criteria. CFOI fatal injury counts exclude illness-related deaths unless precipitated by an injury event. | |||
Last Modified Date: Wednesday, April 19, 2023