An official website of the United States government
An official website of the United States government
The .gov means it's official.
Federal government websites often end in .gov or .mil. Before sharing sensitive information,
make sure you're on a federal government site.
The site is secure.
The
https:// ensures that you are connecting to the official website and that any
information you provide is encrypted and transmitted securely.
24-1974-BOS
Thursday, September 19, 2024
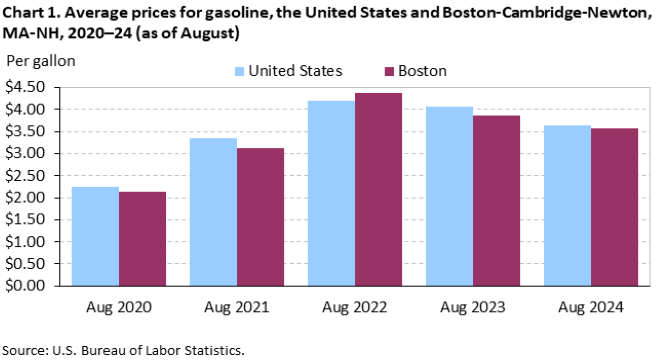
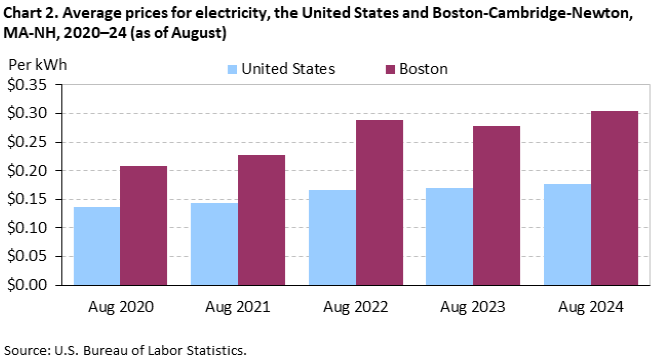
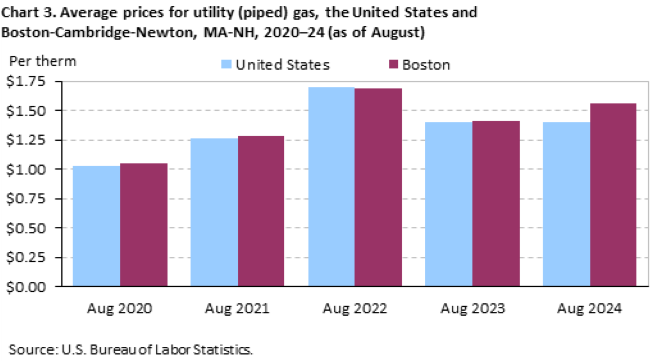
Gasoline prices averaged $3.581 a gallon in the Boston-Cambridge-Newton area in August 2024, the U.S. Bureau of Labor Statistics reported today. Regional Commissioner William J. Sibley noted that area gasoline prices were down 28.6 cents compared to last August. Boston area households paid an average of 30.5 cents per kilowatt hour (kWh) of electricity in August 2024, up from 27.9 cents per kWh in August 2023. The average cost of utility (piped) gas at $1.561 per therm in August was up from $1.411 per therm one year earlier. (Data in this release are not seasonally adjusted; accordingly, over-the-year-analysis is used throughout.)
At $3.581 a gallon, costs for gasoline in the Boston area were similar to the national average of $3.648 a gallon in August 2024. Last August, gasoline costs in Boston were 4.8 percent below the national average. Over the past five Augusts, gasoline prices in the Boston area have ranged from $2.144 to $4.387. (See chart 1.)
The 30.5 cents per kWh that Boston households paid for electricity in August 2024 was 72.3 percent higher than the nationwide average cost of 17.7 cents per kWh. In August 2023, electricity costs in Boston were 27.9 cents per kWh, 64.1 percent above the national average of 17.0 cents. Over the past five years, Boston area electricity prices in August have exceeded the national average by at least 52 percent. (See chart 2.)
Prices paid by Boston area consumers for utility (piped) gas, commonly referred to as natural gas, were $1.561 per therm in August 2024, 11.4 percent higher than the national average of $1.401 per therm. Last August, Boston area natural gas prices were $1.411 per therm, similar to the nationwide average. Over the past five Augusts, natural gas prices in the Boston area have ranged from $1.047 to $1.692. (See chart 3.)
The Boston-Cambridge-Newton, MA-NH Core Based Statistical Area covered in this release is comprised of Essex, Middlesex, Norfolk, Plymouth, and Suffolk Counties in Massachusetts and Rockingham and Strafford Counties in New Hampshire.
The Consumer Price Index for September 2024 is scheduled to be released on Thursday, October 10, 2024, at 8:30 a.m. (ET).
Average prices are estimated from Consumer Price Index (CPI) data for selected commodity series to support the research and analytic needs of CPI data users. Average prices for electricity, utility (piped) gas, and gasoline are published monthly for the U.S. city average, the 4 regions, 9 divisions, 2 population size classes, 8 region/size-class cross-classifications, and the 23 largest local index areas. For electricity, average prices per kilowatt-hour (kWh) are published. For utility (piped) gas, average prices per therm are published. For gasoline, the average price per gallon is published. Average prices for commonly available grades of gasoline are published as well as the average price across all grades.
All eligible prices are converted to a price per normalized quantity. These prices are then used to estimate a price for a defined fixed quantity. The average price per kilowatt-hour represents the total bill divided by the kilowatt-hour usage. The total bill is the sum of all items applicable to all consumers appearing on an electricity bill including, but not limited to, variable rates per kWh, fixed costs, taxes, surcharges, and credits. This calculation also applies to the average price per therm for utility (piped) gas.
Information in this release will be made available to sensory impaired individuals upon request. Voice phone: (202) 691-5200; Telecommunications Relay Service: 7-1-1.
| Year and month | Gasoline per gallon | Electricity per kWh | Utility (piped) gas per therm | |||
|---|---|---|---|---|---|---|
| United States | Boston area | United States | Boston area | United States | Boston area | |
2023 | ||||||
August | $4.064 | $3.867 | $0.170 | $0.279 | $1.402 | $1.411 |
September | 4.107 | 3.885 | 0.171 | 0.279 | 1.377 | 1.369 |
October | 3.910 | 3.792 | 0.169 | 0.282 | 1.388 | 1.369 |
November | 3.623 | 3.617 | 0.168 | 0.286 | 1.442 | 2.200 |
December | 3.411 | 3.473 | 0.169 | 0.285 | 1.429 | 2.202 |
2024 | ||||||
January | 3.353 | 3.356 | 0.173 | 0.297 | 1.452 | 2.171 |
February | 3.486 | 3.354 | 0.173 | 0.291 | 1.465 | 2.171 |
March | 3.707 | 3.412 | 0.174 | 0.297 | 1.429 | 2.171 |
April | 3.907 | 3.613 | 0.173 | 0.297 | 1.375 | 2.153 |
May | 3.885 | 3.740 | 0.175 | 0.297 | 1.369 | 1.588 |
June | 3.729 | 3.645 | 0.178 | 0.297 | 1.407 | 1.588 |
July | 3.747 | 3.666 | 0.178 | 0.301 | 1.408 | 1.588 |
August | 3.648 | 3.581 | 0.177 | 0.305 | 1.401 | 1.561 |
Last Modified Date: Thursday, September 19, 2024