An official website of the United States government
An official website of the United States government
The .gov means it's official.
Federal government websites often end in .gov or .mil. Before sharing sensitive information,
make sure you're on a federal government site.
The site is secure.
The
https:// ensures that you are connecting to the official website and that any
information you provide is encrypted and transmitted securely.
25-384-BOS
Monday, March 17, 2025
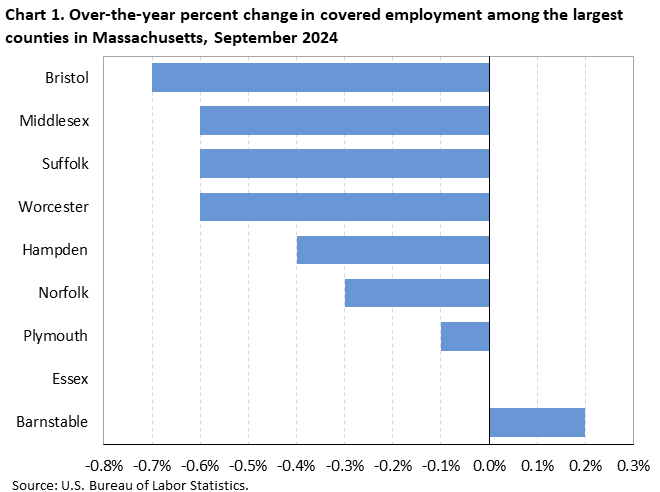
Employment declined in 7 of the 9 largest counties in Massachusetts from September 2023 to September 2024, the U.S. Bureau of Labor Statistics reported today. (Large counties are the 369 U.S. counties or county equivalents with annual average employment levels of 75,000 or more in 2023.) Regional Commissioner William J. Sibley noted that Bristol County had the largest over-the-year decrease in employment (-0.7 percent), followed by Middlesex, Suffolk, and Worcester Counties (-0.6 percent each). (See chart 1 and table 1.)
National employment increased 0.8 percent over the year, with gains recorded in 264 of the 362 largest U.S. counties with published data. Kings, NY, had the largest over-the-year increase in employment, with a gain of 4.9 percent. Elkhart, IN, had the largest over-the-year percentage decrease in employment (-2.7 percent).
Among the nine largest counties in Massachusetts, employment was highest in Middlesex County (920,400) in September 2024. Within Middlesex County’s private industry, professional, scientific, and technical services accounted for the largest employment. Together, the nine largest Massachusetts counties accounted for 92.8 percent of total covered employment within the state. Nationwide, the 369 largest counties comprised 73.1 percent of total covered employment in the United States.
Employment and wage levels (but not over-the-year changes) are also available for the five counties in Massachusetts with employment below 75,000. Wage levels in 4 of the 5 smaller counties were below the national average of $1,394 in the third quarter of 2024. (See table 2.)
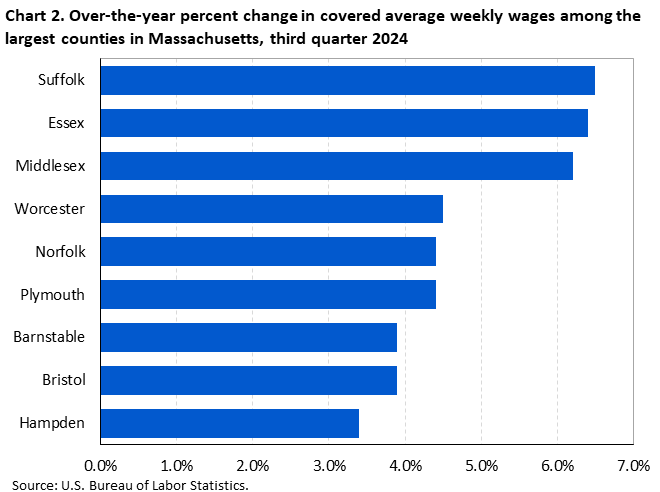
Large county wage changesAll nine large Massachusetts counties reported average weekly wage gains from the third quarter of 2023 to the third quarter of 2024. (See chart 2.) Suffolk County had the largest gain (+6.5 percent), followed by Essex County (+6.4 percent) and Middlesex County (+6.2 percent). Over-the-year wage gains among Massachusetts’s other six large counties ranged from 4.5 percent to 3.4 percent.
Nationwide, wages increased 4.5 percent over the year. Among the 365 largest counties in the United States with published data, 363 had over-the-year wage increases. Benton, AR, had the largest percentage wage increase (+15.5 percent). Weld, CO, had the largest over-the-year percentage decrease (-1.3 percent).
Large county average weekly wagesWeekly wages in 4 of the 9 largest counties in Massachusetts were above the national average of $1,394 in the third quarter of 2024. Average weekly wages in two of these counties ranked among the top 10 nationwide: Suffolk ($2,290, 6th) and Middlesex ($2,066, 9th).
Among the 369 largest U.S. counties, 94 reported average weekly wages at or above the U.S. average in the third quarter of 2024. San Mateo, CA, had the highest average weekly wage ($3,557). Average weekly wages were below the national average in the remaining 275 counties. Hidalgo, TX, had the lowest average weekly wage ($819).
Smaller county average weekly wagesAmong the five smaller counties in Massachusetts—those with employment below 75,000—Nantucket ($1,418) reported an average weekly wage above the national average. Franklin County ($1,037) reported the lowest average weekly wage in the state.
When all 14 counties in Massachusetts were considered, 5 reported average weekly wages of less than $1,225, 3 registered wages from $1,225 to $1,324, 3 had wages from $1,325 to $1,424, and 3 had average weekly wages of $1,425 or higher. (See map 1.) The highest-paying counties were located in the Boston metropolitan area.
QCEW data for states have been included in this release in table 3. For additional information about quarterly employment and wages data, please read the Technical Note for the County Employment and Wages News Release or visit the Quarterly Census of Employment and Wages website.
Employment and Wages Annual Averages Online features comprehensive information by detailed industry on establishments, employment, and wages for the nation and all states. This publication is typically published in September of the following year of the reference period or shortly after the QCEW first quarter full data update.
Information in this release will be made available to individuals with sensory impairments upon request. Voice phone: (202) 691-5200; Telecommunications Relay Service: 7-1-1.
The County Employment and Wages release for the fourth quarter 2024 is scheduled to be released on Wednesday, May 21, 2025. The County Employment and Wages full data update for the fourth quarter 2024 is scheduled to be released on Wednesday, June 4, 2025.
| Area | Establishments, third quarter (thousands) | Employment | Average weekly wage (1) | |||||
|---|---|---|---|---|---|---|---|---|
| September 2024 (thousands) | Percent change, September 2023–24 (2) | National ranking by percent change (3) | Third quarter 2024 ($) | National ranking by level (3) | Percent change, third quarter 2023–24 (2) | National ranking by percent change (3) | ||
United States (4) | 12,297.4 | 155,360.4 | 0.8 | -- | 1,394 | -- | 4.5 | -- |
Massachusetts | 291.3 | 3,647.4 | -0.3 | -- | 1,736 | 3 | 5.6 | 4 |
Barnstable | 10.0 | 100.7 | 0.2 | 241 | 1,186 | 226 | 3.9 | 203 |
Bristol | 18.3 | 228.2 | -0.7 | 338 | 1,211 | 209 | 3.9 | 203 |
Essex | 29.3 | 324.9 | 0.0 | 265 | 1,410 | 86 | 6.4 | 15 |
Hampden | 19.0 | 203.7 | -0.4 | 320 | 1,171 | 239 | 3.4 | 261 |
Middlesex | 60.0 | 920.4 | -0.6 | 330 | 2,066 | 9 | 6.2 | 20 |
Norfolk | 26.6 | 344.6 | -0.3 | 307 | 1,511 | 55 | 4.4 | 138 |
Plymouth | 17.3 | 195.5 | -0.1 | 283 | 1,291 | 151 | 4.4 | 138 |
Suffolk | 34.4 | 713.7 | -0.6 | 330 | 2,290 | 6 | 6.5 | 13 |
Worcester | 28.3 | 351.3 | -0.6 | 330 | 1,334 | 123 | 4.5 | 122 |
Footnotes: | ||||||||
Note: Data are preliminary. Covered employment and wages include workers covered by Unemployment Insurance (UI) and Unemployment Compensation for Federal Employees (UCFE) programs. | ||||||||
| Area | Establishments | Employment September 2024 | Average weekly wage ($) (1) |
|---|---|---|---|
United States (2) | 12,297,414 | 155,360,357 | 1,394 |
Massachusetts | 291,307 | 3,647,391 | 1,736 |
Barnstable | 10,028 | 100,698 | 1,186 |
Berkshire | 5,581 | 57,559 | 1,182 |
Bristol | 18,313 | 228,232 | 1,211 |
Dukes | 1,523 | 10,305 | 1,278 |
Essex | 29,294 | 324,946 | 1,410 |
Franklin | 2,635 | 25,636 | 1,037 |
Hampden | 19,042 | 203,730 | 1,171 |
Hampshire | 5,023 | 65,412 | 1,228 |
Middlesex | 60,038 | 920,449 | 2,066 |
Nantucket | 1,347 | 9,942 | 1,418 |
Norfolk | 26,627 | 344,648 | 1,511 |
Plymouth | 17,292 | 195,534 | 1,291 |
Suffolk | 34,393 | 713,712 | 2,290 |
Worcester | 28,324 | 351,298 | 1,334 |
Footnotes: | |||
Note: Data are preliminary. Covered employment and wages include workers covered by Unemployment Insurance (UI) and Unemployment Compensation for Federal Employees (UCFE) programs. | |||
| State | Establishments, third quarter (thousands) | Employment | Average weekly wage (1) | ||||
|---|---|---|---|---|---|---|---|
| September 2024 (thousands) | Percent change, September 2023–24 | Third quarter 2024 ($) | National ranking by level | Percent change, third quarter 2023–24 | National ranking by percent change | ||
United States (2) | 12,297.4 | 155,360.4 | 0.8 | 1,394 | -- | 4.5 | -- |
Alabama | 162.5 | 2,099.8 | 0.7 | 1,172 | 36 | 4.5 | 19 |
Alaska | 25.5 | 342.0 | 1.3 | 1,382 | 15 | 3.8 | 40 |
Arizona | 222.3 | 3,187.2 | -0.1 | 1,317 | 19 | 5.5 | 6 |
Arkansas | 103.6 | 1,301.1 | 1.0 | 1,094 | 49 | 5.5 | 6 |
California | 1,926.3 | 18,209.7 | 0.5 | 1,694 | 4 | 5.1 | 10 |
Colorado | 250.8 | 2,902.1 | 0.5 | 1,486 | 8 | 3.8 | 40 |
Connecticut | 150.3 | 1,690.7 | 0.7 | 1,545 | 6 | 4.5 | 19 |
Delaware | 44.6 | 479.2 | 1.5 | 1,330 | 17 | 4.0 | 34 |
District of Columbia | 52.3 | 760.3 | -0.1 | 2,290 | 1 | 6.3 | 2 |
Florida | 908.5 | 9,832.1 | 1.6 | 1,276 | 22 | 4.8 | 13 |
Georgia | 394.0 | 4,853.7 | 0.8 | 1,304 | 20 | 4.5 | 19 |
Hawaii | 60.6 | 639.4 | 1.8 | 1,299 | 21 | 5.8 | 3 |
Idaho | 102.8 | 867.9 | 1.9 | 1,126 | 45 | 5.3 | 9 |
Illinois | 410.9 | 6,083.9 | 0.4 | 1,398 | 12 | 3.9 | 39 |
Indiana | 192.8 | 3,191.0 | 0.3 | 1,165 | 37 | 4.5 | 19 |
Iowa | 111.8 | 1,559.5 | -0.3 | 1,154 | 40 | 4.0 | 34 |
Kansas | 102.9 | 1,430.4 | 0.7 | 1,137 | 43 | 4.6 | 15 |
Kentucky | 158.5 | 2,002.1 | 0.8 | 1,129 | 44 | 3.4 | 48 |
Louisiana | 156.2 | 1,908.1 | 0.8 | 1,151 | 41 | 4.0 | 34 |
Maine | 66.0 | 657.8 | 0.9 | 1,176 | 34 | 4.3 | 28 |
Maryland | 213.5 | 2,765.7 | 1.9 | 1,471 | 9 | 3.6 | 47 |
Massachusetts | 291.3 | 3,647.4 | -0.3 | 1,736 | 3 | 5.6 | 4 |
Michigan | 318.0 | 4,440.9 | 0.4 | 1,266 | 24 | 3.0 | 50 |
Minnesota | 214.7 | 2,948.1 | 0.7 | 1,389 | 14 | 4.6 | 15 |
Mississippi | 90.5 | 1,170.9 | 0.5 | 960 | 51 | 3.7 | 45 |
Missouri | 248.0 | 2,911.7 | 0.5 | 1,197 | 31 | 4.0 | 34 |
Montana | 64.5 | 520.2 | 1.4 | 1,125 | 46 | 4.8 | 13 |
Nebraska | 77.9 | 1,022.2 | 0.7 | 1,155 | 38 | 4.1 | 32 |
Nevada | 108.7 | 1,555.6 | 1.0 | 1,260 | 26 | 4.9 | 12 |
New Hampshire | 67.8 | 691.2 | 0.5 | 1,404 | 11 | 4.0 | 34 |
New Jersey | 333.1 | 4,282.0 | 0.7 | 1,503 | 7 | 3.2 | 49 |
New Mexico | 68.6 | 870.5 | 1.1 | 1,155 | 38 | 5.4 | 8 |
New York | 714.8 | 9,678.7 | 1.5 | 1,684 | 5 | 4.5 | 19 |
North Carolina | 379.3 | 4,898.5 | 1.1 | 1,275 | 23 | 4.5 | 19 |
North Dakota | 36.7 | 435.4 | 1.5 | 1,257 | 27 | 4.4 | 26 |
Ohio | 344.5 | 5,524.1 | 0.4 | 1,237 | 30 | 4.5 | 19 |
Oklahoma | 129.8 | 1,699.2 | 0.7 | 1,095 | 48 | 4.2 | 31 |
Oregon | 192.8 | 2,016.9 | 0.3 | 1,353 | 16 | 3.8 | 40 |
Pennsylvania | 395.0 | 6,044.7 | 0.7 | 1,330 | 17 | 3.7 | 45 |
Rhode Island | 49.0 | 501.9 | 1.1 | 1,263 | 25 | 2.5 | 51 |
South Carolina | 192.8 | 2,296.8 | 1.8 | 1,142 | 42 | 5.1 | 10 |
South Dakota | 40.5 | 462.3 | 1.0 | 1,102 | 47 | 4.3 | 28 |
Tennessee | 233.3 | 3,290.0 | 0.8 | 1,256 | 28 | 4.1 | 32 |
Texas | 844.5 | 13,933.5 | 1.4 | 1,396 | 13 | 4.6 | 15 |
Utah | 140.4 | 1,724.3 | 1.1 | 1,248 | 29 | 4.3 | 28 |
Vermont | 33.5 | 308.4 | 0.4 | 1,191 | 32 | 4.6 | 15 |
Virginia | 325.2 | 4,116.1 | 1.4 | 1,444 | 10 | 4.4 | 26 |
Washington | 241.1 | 3,663.9 | 1.3 | 1,781 | 2 | 5.6 | 4 |
West Virginia | 62.6 | 698.4 | 0.6 | 1,085 | 50 | 3.8 | 40 |
Wisconsin | 210.9 | 2,956.4 | 0.4 | 1,175 | 35 | 3.8 | 40 |
Wyoming | 31.1 | 286.9 | 0.4 | 1,183 | 33 | 6.5 | 1 |
Puerto Rico | 52.5 | 949.3 | 0.6 | 668 | (3) | 5.4 | (3) |
Virgin Islands | 3.0 | 35.1 | -0.2 | 983 | (3) | 2.3 | (3) |
Footnotes: | |||||||
Note: Data are preliminary. Covered employment and wages include workers covered by Unemployment Insurance (UI) and Unemployment Compensation for Federal Employees (UCFE) programs. | |||||||
Last Modified Date: Monday, March 17, 2025