An official website of the United States government
An official website of the United States government
The .gov means it's official.
Federal government websites often end in .gov or .mil. Before sharing sensitive information,
make sure you're on a federal government site.
The site is secure.
The
https:// ensures that you are connecting to the official website and that any
information you provide is encrypted and transmitted securely.
21-1437-ATL
Wednesday, August 04, 2021
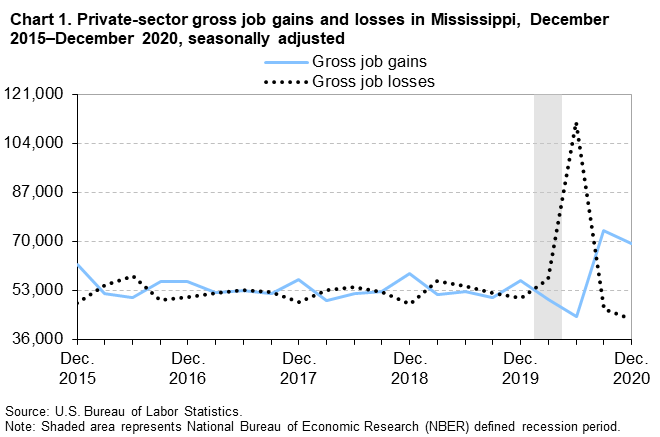
From September 2020 to December 2020, gross job gains from opening and expanding private-sector establishments in Mississippi were 69,255, while gross job losses from closing and contracting private-sector establishments were 42,918, the U.S. Bureau of Labor Statistics reported today. Regional Commissioner Janet S. Rankin noted that the difference between the number of gross job gains and the number of gross job losses yielded a net employment gain of 26,337 jobs in the private sector during the fourth quarter of 2020. During the previous quarter, gross job gains exceeded gross job losses by 27,209. (See chart 1.)
The change in the number of jobs over time is the net result of increases and decreases in employment that occur at all private businesses in the economy. Business Employment Dynamics (BED) statistics track these changes in employment at private-sector establishments from the third month of one quarter to the third month of the next. The difference between the number of gross job gains and the number of gross job losses is the net change in employment. (See Technical Note.)
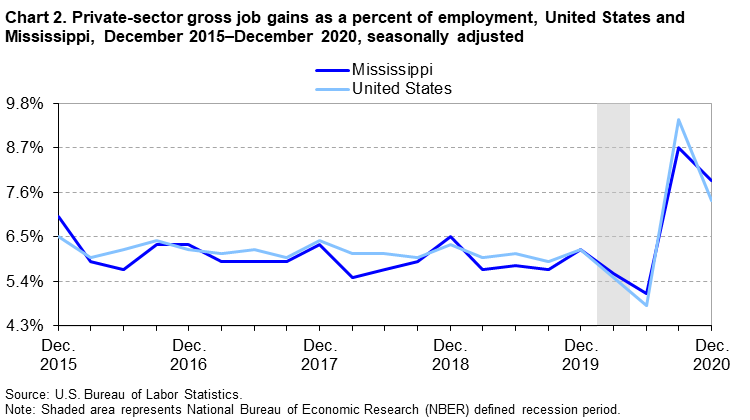
Gross job gainsIn the fourth quarter of 2020, gross job gains represented 7.9 percent of private-sector employment in Mississippi; nationally, gross job gains accounted for 7.4 percent of private-sector employment. (See chart 2.) Gross job gains are the sum of increases in employment due to expansions at existing establishments and the addition of new jobs at opening establishments. In Mississippi, gross job gains at expanding establishments totaled 57,758 in the fourth quarter of 2020, a decrease of 4,965 jobs compared to the previous quarter. (See table 1.) Opening establishments accounted for 11,497 jobs gained in the fourth quarter of 2020, an increase of 411 jobs from the previous quarter.
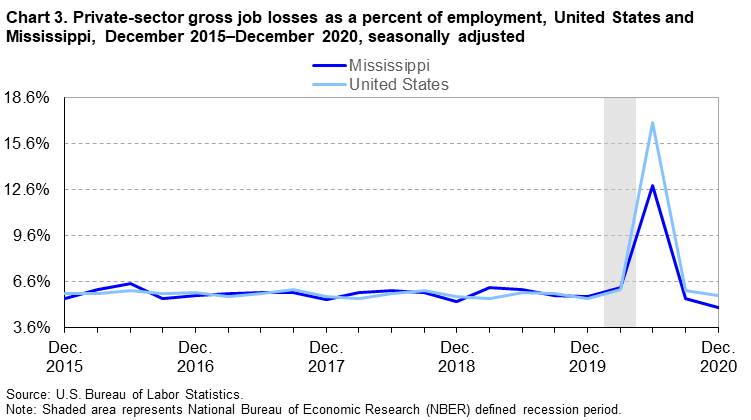
In the fourth quarter of 2020, gross job losses represented 4.9 percent of private-sector employment in Mississippi; nationally, gross job losses accounted for 5.7 percent of private-sector employment. (See chart 3.) Gross job losses are the result of contractions in employment at existing establishments and the loss of jobs at closing establishments. In Mississippi, contracting establishments lost 34,672 jobs in the fourth quarter of 2020, a decrease of 4,384 jobs from the prior quarter. Closing establishments lost 8,246 jobs, an increase of 702 jobs from the previous quarter.
Gross job gains exceeded gross job losses in all 10 industry sectors in Mississippi in the fourth quarter of 2020. Professional and business services had the largest over-the-quarter net job increase, with a gain of 9,247 jobs. This was the result of 15,356 gross job gains and 6,109 gross job losses. The leisure and hospitality industry had a net gain of 6,059 jobs.
For more informationThe BED data series include gross job gains and gross job losses by industry subsector, for the 50 states, the District of Columbia, Puerto Rico, and the Virgin Islands, as well as gross job gains and gross job losses at the firm level by employer size class. BED data for the states have been included in table 2 of this release. Additional information is available online at www.bls.gov/bdm/.
The Business Employment Dynamics for the First Quarter 2021 are scheduled to be released on Wednesday, October 27, 2021 at 10:00 a.m. (ET).
Data collection and processing methods have been impacted because of the COVID-19 pandemic. More detail can be found at www.bls.gov/covid19/effects-of-covid-19-pandemic-on-business-employment-dynamics.htm.
The Business Employment Dynamics (BED) data are a product of a federal-state cooperative program known as Quarterly Census of Employment and Wages (QCEW). The BED data are compiled by the U.S. Bureau of Labor Statistics (BLS) from existing QCEW records. Most employers in the U.S. are required to file quarterly reports on the employment and wages of workers covered by unemployment insurance (UI) laws, and to pay quarterly UI taxes. The QCEW is based largely on quarterly UI reports which are sent by businesses to the State Workforce Agencies (SWAs). These UI reports are supplemented by two additional BLS data collections to render administrative data into economic statistics. Together these data comprise the QCEW and form the basis of the Bureau’s establishment universe sampling frame.
In the BED program, the QCEW records are linked across quarters to provide a longitudinal history for each establishment. The linkage process allows the tracking of net employment changes at the establishment level, which in turn allows the estimation of jobs gained at opening and expanding units and jobs lost at closing and contracting units.
The change in the number of jobs over time is the net result of increases and decreases in employment that occur at all businesses in the economy. BED statistics track these changes in employment at private business establishments from the third month of one quarter to the third month of the next. Gross job gains are the sum of increases in employment from expansions at existing establishments and the addition of new jobs at opening establishments. Gross job losses are the result of contractions in employment at existing establishments and the loss of jobs at closing establishments. The difference between the number of gross jobs gained and the number of gross jobs lost is the net change in employment.
Gross job gains and gross job losses are expressed as rates by dividing their levels by the average of employment in the current and previous quarters. The rates are calculated for the components of gross job gains and gross job losses and then summed to form their respective totals. These rates can be added and subtracted just as their levels can. For instance, the difference between the gross job gains rate and the gross job losses rate is the net growth rate.
The formal definitions of employment changes are as follows:
Openings. These are either units with positive third month employment for the first time in the current quarter, with no links to the prior quarter, or with positive third month employment in the current quarter following zero employment in the previous quarter.
Expansions. These are units with positive employment in the third month in both the previous and current quarters, with a net increase in employment over this period.
Closings. These are either units with positive third month employment in the previous quarter, with no employment or zero employment reported in the current quarter.
Contractions. These are units with positive employment in the third month in both the previous and current quarters, with a net decrease in employment over this period.
The full Technical Note for the Business Employment Dynamics program, which includes information on coverage, concepts, and methodology, can be found in the current quarterly news release online at www.bls.gov/news.release/cewbd.htm.
Information in this release will be made available to sensory impaired individuals upon request. Voice phone: (202) 691-5200; Federal Relay Service: (800) 877-8339.
| Category | Gross job gains and job losses (3 months ended) | Gross job gains and job losses as a percent of employment (3 months ended) | ||||||||
|---|---|---|---|---|---|---|---|---|---|---|
| Dec. 2019 | Mar. 2020 | June 2020 | Sept. 2020 | Dec. 2020 | Dec. 2019 | Mar. 2020 | June 2020 | Sept. 2020 | Dec. 2020 | |
Total private (1) | ||||||||||
Gross job gains | 56,241 | 49,812 | 43,906 | 73,809 | 69,255 | 6.2 | 5.6 | 5.1 | 8.7 | 7.9 |
At expanding establishments | 46,927 | 41,021 | 36,154 | 62,723 | 57,758 | 5.2 | 4.6 | 4.2 | 7.4 | 6.6 |
At opening establishments | 9,314 | 8,791 | 7,752 | 11,086 | 11,497 | 1.0 | 1.0 | 0.9 | 1.3 | 1.3 |
Gross job losses | 50,181 | 56,733 | 111,502 | 46,600 | 42,918 | 5.6 | 6.2 | 12.9 | 5.5 | 4.9 |
At contracting establishments | 39,763 | 49,081 | 97,670 | 39,056 | 34,672 | 4.4 | 5.4 | 11.3 | 4.6 | 4.0 |
At closing establishments | 10,418 | 7,652 | 13,832 | 7,544 | 8,246 | 1.2 | 0.8 | 1.6 | 0.9 | 0.9 |
Net employment change (2) | 6,060 | -6,921 | -67,596 | 27,209 | 26,337 | 0.6 | -0.6 | -7.8 | 3.2 | 3.0 |
Construction | ||||||||||
Gross job gains | 4,863 | 5,200 | 3,309 | 5,042 | 4,299 | 10.8 | 11.3 | 7.6 | 11.7 | 9.8 |
At expanding establishments | 4,054 | 4,490 | 2,670 | 4,021 | 3,389 | 9.0 | 9.8 | 6.1 | 9.3 | 7.7 |
At opening establishments | 809 | 710 | 639 | 1,021 | 910 | 1.8 | 1.5 | 1.5 | 2.4 | 2.1 |
Gross job losses | 3,625 | 4,893 | 6,793 | 3,249 | 3,725 | 8.0 | 10.7 | 15.4 | 7.6 | 8.5 |
At contracting establishments | 3,074 | 3,979 | 5,631 | 2,782 | 3,171 | 6.8 | 8.7 | 12.8 | 6.5 | 7.2 |
At closing establishments | 551 | 914 | 1,162 | 467 | 554 | 1.2 | 2.0 | 2.6 | 1.1 | 1.3 |
Net employment change (2) | 1,238 | 307 | -3,484 | 1,793 | 574 | 2.8 | 0.6 | -7.8 | 4.1 | 1.3 |
Manufacturing | ||||||||||
Gross job gains | 4,841 | 3,410 | 2,501 | 8,593 | 5,810 | 3.2 | 2.3 | 1.8 | 6.2 | 4.1 |
At expanding establishments | 4,629 | 3,227 | 2,349 | 8,294 | 5,622 | 3.1 | 2.2 | 1.7 | 6.0 | 4.0 |
At opening establishments | 212 | 183 | 152 | 299 | 188 | 0.1 | 0.1 | 0.1 | 0.2 | 0.1 |
Gross job losses | 3,977 | 4,660 | 12,290 | 4,044 | 3,126 | 2.7 | 3.1 | 8.7 | 2.9 | 2.2 |
At contracting establishments | 3,499 | 4,305 | 11,889 | 3,839 | 2,887 | 2.4 | 2.9 | 8.4 | 2.8 | 2.0 |
At closing establishments | 478 | 355 | 401 | 205 | 239 | 0.3 | 0.2 | 0.3 | 0.1 | 0.2 |
Net employment change (2) | 864 | -1,250 | -9,789 | 4,549 | 2,684 | 0.5 | -0.8 | -6.9 | 3.3 | 1.9 |
Wholesale trade | ||||||||||
Gross job gains | 1,631 | 1,677 | 1,185 | 1,857 | 2,148 | 4.8 | 4.8 | 3.6 | 5.6 | 6.5 |
At expanding establishments | 1,332 | 1,384 | 965 | 1,546 | 1,610 | 3.9 | 4.0 | 2.9 | 4.7 | 4.9 |
At opening establishments | 299 | 293 | 220 | 311 | 538 | 0.9 | 0.8 | 0.7 | 0.9 | 1.6 |
Gross job losses | 1,594 | 1,515 | 2,889 | 1,974 | 1,363 | 4.7 | 4.4 | 8.6 | 6.0 | 4.1 |
At contracting establishments | 1,188 | 1,162 | 2,566 | 1,596 | 1,187 | 3.5 | 3.4 | 7.6 | 4.9 | 3.6 |
At closing establishments | 406 | 353 | 323 | 378 | 176 | 1.2 | 1.0 | 1.0 | 1.1 | 0.5 |
Net employment change (2) | 37 | 162 | -1,704 | -117 | 785 | 0.1 | 0.4 | -5.0 | -0.4 | 2.4 |
Retail trade | ||||||||||
Gross job gains | 7,843 | 7,709 | 10,763 | 10,902 | 7,992 | 5.8 | 5.7 | 8.0 | 8.1 | 5.9 |
At expanding establishments | 6,996 | 6,801 | 9,837 | 9,640 | 6,523 | 5.2 | 5.0 | 7.3 | 7.2 | 4.8 |
At opening establishments | 847 | 908 | 926 | 1,262 | 1,469 | 0.6 | 0.7 | 0.7 | 0.9 | 1.1 |
Gross job losses | 8,493 | 7,590 | 14,223 | 7,786 | 7,483 | 6.3 | 5.7 | 10.6 | 5.8 | 5.6 |
At contracting establishments | 6,567 | 6,829 | 12,861 | 6,546 | 6,308 | 4.9 | 5.1 | 9.6 | 4.9 | 4.7 |
At closing establishments | 1,926 | 761 | 1,362 | 1,240 | 1,175 | 1.4 | 0.6 | 1.0 | 0.9 | 0.9 |
Net employment change (2) | -650 | 119 | -3,460 | 3,116 | 509 | -0.5 | 0.0 | -2.6 | 2.3 | 0.3 |
Transportation and warehousing | ||||||||||
Gross job gains | 5,099 | 2,575 | 3,658 | 5,637 | 5,523 | 9.8 | 5.0 | 7.2 | 10.9 | 10.0 |
At expanding establishments | 4,639 | 2,181 | 2,594 | 5,122 | 5,170 | 8.9 | 4.2 | 5.1 | 9.9 | 9.4 |
At opening establishments | 460 | 394 | 1,064 | 515 | 353 | 0.9 | 0.8 | 2.1 | 1.0 | 0.6 |
Gross job losses | 2,845 | 4,141 | 4,896 | 2,615 | 1,993 | 5.5 | 7.9 | 9.6 | 5.0 | 3.6 |
At contracting establishments | 2,073 | 3,703 | 4,426 | 2,341 | 1,815 | 4.0 | 7.1 | 8.7 | 4.5 | 3.3 |
At closing establishments | 772 | 438 | 470 | 274 | 178 | 1.5 | 0.8 | 0.9 | 0.5 | 0.3 |
Net employment change (2) | 2,254 | -1,566 | -1,238 | 3,022 | 3,530 | 4.3 | -2.9 | -2.4 | 5.9 | 6.4 |
Financial activities | ||||||||||
Gross job gains | 1,966 | 1,733 | 1,489 | 1,997 | 2,094 | 4.6 | 4.1 | 3.6 | 4.8 | 5.0 |
At expanding establishments | 1,540 | 1,311 | 1,079 | 1,524 | 1,509 | 3.6 | 3.1 | 2.6 | 3.7 | 3.6 |
At opening establishments | 426 | 422 | 410 | 473 | 585 | 1.0 | 1.0 | 1.0 | 1.1 | 1.4 |
Gross job losses | 2,057 | 1,784 | 3,112 | 2,120 | 1,698 | 4.8 | 4.1 | 7.4 | 5.1 | 4.1 |
At contracting establishments | 1,368 | 1,478 | 2,489 | 1,524 | 1,344 | 3.2 | 3.4 | 5.9 | 3.7 | 3.2 |
At closing establishments | 689 | 306 | 623 | 596 | 354 | 1.6 | 0.7 | 1.5 | 1.4 | 0.9 |
Net employment change (2) | -91 | -51 | -1,623 | -123 | 396 | -0.2 | 0.0 | -3.8 | -0.3 | 0.9 |
Professional and business services | ||||||||||
Gross job gains | 9,774 | 9,705 | 8,287 | 12,698 | 15,356 | 9.1 | 8.9 | 7.8 | 12.1 | 13.7 |
At expanding establishments | 8,085 | 7,775 | 6,676 | 10,354 | 12,889 | 7.5 | 7.1 | 6.3 | 9.9 | 11.5 |
At opening establishments | 1,689 | 1,930 | 1,611 | 2,344 | 2,467 | 1.6 | 1.8 | 1.5 | 2.2 | 2.2 |
Gross job losses | 8,712 | 9,641 | 15,646 | 7,062 | 6,109 | 8.0 | 8.8 | 14.8 | 6.7 | 5.5 |
At contracting establishments | 7,317 | 8,551 | 12,677 | 5,489 | 4,799 | 6.7 | 7.8 | 12.0 | 5.2 | 4.3 |
At closing establishments | 1,395 | 1,090 | 2,969 | 1,573 | 1,310 | 1.3 | 1.0 | 2.8 | 1.5 | 1.2 |
Net employment change (2) | 1,062 | 64 | -7,359 | 5,636 | 9,247 | 1.1 | 0.1 | -7.0 | 5.4 | 8.2 |
Education and health services | ||||||||||
Gross job gains | 6,099 | 5,727 | 4,123 | 6,637 | 8,373 | 4.2 | 3.9 | 2.9 | 4.9 | 6.1 |
At expanding establishments | 4,826 | 4,831 | 3,298 | 5,459 | 7,157 | 3.3 | 3.3 | 2.3 | 4.0 | 5.2 |
At opening establishments | 1,273 | 896 | 825 | 1,178 | 1,216 | 0.9 | 0.6 | 0.6 | 0.9 | 0.9 |
Gross job losses | 6,649 | 6,850 | 10,536 | 6,101 | 6,681 | 4.5 | 4.7 | 7.4 | 4.4 | 4.8 |
At contracting establishments | 4,852 | 5,989 | 9,074 | 5,101 | 4,339 | 3.3 | 4.1 | 6.4 | 3.7 | 3.1 |
At closing establishments | 1,797 | 861 | 1,462 | 1,000 | 2,342 | 1.2 | 0.6 | 1.0 | 0.7 | 1.7 |
Net employment change (2) | -550 | -1,123 | -6,413 | 536 | 1,692 | -0.3 | -0.8 | -4.5 | 0.5 | 1.3 |
Leisure and hospitality | ||||||||||
Gross job gains | 9,597 | 8,263 | 5,804 | 16,412 | 13,226 | 7.0 | 6.1 | 4.8 | 14.3 | 10.9 |
At expanding establishments | 7,442 | 6,107 | 4,612 | 13,562 | 10,761 | 5.4 | 4.5 | 3.8 | 11.8 | 8.9 |
At opening establishments | 2,155 | 2,156 | 1,192 | 2,850 | 2,465 | 1.6 | 1.6 | 1.0 | 2.5 | 2.0 |
Gross job losses | 8,563 | 11,326 | 33,867 | 8,138 | 7,167 | 6.3 | 8.4 | 27.6 | 7.1 | 5.9 |
At contracting establishments | 7,245 | 9,714 | 30,143 | 7,084 | 6,280 | 5.3 | 7.2 | 24.6 | 6.2 | 5.2 |
At closing establishments | 1,318 | 1,612 | 3,724 | 1,054 | 887 | 1.0 | 1.2 | 3.0 | 0.9 | 0.7 |
Net employment change (2) | 1,034 | -3,063 | -28,063 | 8,274 | 6,059 | 0.7 | -2.3 | -22.8 | 7.2 | 5.0 |
Other services (3) | ||||||||||
Gross job gains | 1,656 | 1,370 | 1,115 | 1,958 | 1,738 | 8.3 | 6.9 | 5.8 | 10.4 | 9.0 |
At expanding establishments | 1,283 | 1,076 | 820 | 1,503 | 1,312 | 6.4 | 5.4 | 4.3 | 8.0 | 6.8 |
At opening establishments | 373 | 294 | 295 | 455 | 426 | 1.9 | 1.5 | 1.5 | 2.4 | 2.2 |
Gross job losses | 1,382 | 1,570 | 2,757 | 1,256 | 1,312 | 6.9 | 7.9 | 14.3 | 6.7 | 6.8 |
At contracting establishments | 1,042 | 1,198 | 2,161 | 897 | 1,006 | 5.2 | 6.0 | 11.2 | 4.8 | 5.2 |
At closing establishments | 340 | 372 | 596 | 359 | 306 | 1.7 | 1.9 | 3.1 | 1.9 | 1.6 |
Net employment change (2) | 274 | -200 | -1,642 | 702 | 426 | 1.4 | -1.0 | -8.5 | 3.7 | 2.2 |
Footnotes: | ||||||||||
| Category | Gross job gains as a percent of employment (3 months ended) | Gross job losses as a percent of employment (3 months ended) | ||||||||
|---|---|---|---|---|---|---|---|---|---|---|
| Dec. 2019 | Mar. 2020 | June 2020 | Sept. 2020 | Dec. 2020 | Dec. 2019 | Mar. 2020 | June 2020 | Sept. 2020 | Dec. 2020 | |
United States(1) | 6.2 | 5.5 | 4.8 | 9.4 | 7.4 | 5.5 | 6.1 | 17.0 | 6.0 | 5.7 |
Alabama | 6.2 | 5.5 | 4.8 | 7.8 | 7.8 | 5.5 | 5.9 | 12.6 | 5.9 | 5.0 |
Alaska | 10.3 | 9.2 | 6.9 | 12.2 | 13.4 | 10.2 | 9.5 | 24.5 | 9.9 | 7.7 |
Arizona | 6.4 | 5.6 | 5.7 | 7.9 | 7.4 | 5.2 | 5.9 | 11.7 | 6.2 | 4.9 |
Arkansas | 6.5 | 5.1 | 4.8 | 7.5 | 7.1 | 4.9 | 5.5 | 12.0 | 5.6 | 5.1 |
California | 6.8 | 6.1 | 5.2 | 8.7 | 8.4 | 6.0 | 6.7 | 18.6 | 7.3 | 6.2 |
Colorado | 6.7 | 6.3 | 5.8 | 10.0 | 7.5 | 6.2 | 7.0 | 14.9 | 6.3 | 7.2 |
Connecticut | 5.5 | 5.2 | 4.3 | 11.2 | 6.5 | 5.6 | 5.9 | 19.7 | 5.1 | 5.8 |
Delaware | 6.7 | 6.2 | 4.9 | 10.3 | 6.7 | 6.2 | 6.6 | 17.7 | 6.3 | 5.7 |
District of Columbia | 5.4 | 5.2 | 3.3 | 8.3 | 5.2 | 4.7 | 5.3 | 22.4 | 5.8 | 5.5 |
Florida | 6.6 | 5.4 | 6.1 | 9.5 | 7.6 | 5.9 | 6.2 | 13.9 | 6.8 | 5.6 |
Georgia | 6.5 | 5.6 | 5.4 | 9.2 | 7.8 | 5.5 | 5.9 | 15.0 | 6.4 | 5.2 |
Hawaii | 5.7 | 5.2 | 3.6 | 7.4 | 14.7 | 5.2 | 5.8 | 29.8 | 12.7 | 4.6 |
Idaho | 7.7 | 7.6 | 6.4 | 8.4 | 8.7 | 6.3 | 6.1 | 11.2 | 6.5 | 6.1 |
Illinois | 5.6 | 5.0 | 4.6 | 9.7 | 6.5 | 5.2 | 6.0 | 18.4 | 5.6 | 6.1 |
Indiana | 6.0 | 4.9 | 4.7 | 8.3 | 6.9 | 5.1 | 6.0 | 13.7 | 5.4 | 5.0 |
Iowa | 5.8 | 5.2 | 4.4 | 7.4 | 6.8 | 5.5 | 5.9 | 13.0 | 5.6 | 5.1 |
Kansas | 6.3 | 5.4 | 5.0 | 7.9 | 7.0 | 5.7 | 6.0 | 13.3 | 6.0 | 6.0 |
Kentucky | 6.2 | 5.3 | 4.6 | 8.8 | 6.8 | 5.6 | 6.1 | 15.3 | 5.0 | 5.4 |
Louisiana | 5.9 | 5.3 | 4.5 | 8.8 | 8.7 | 5.7 | 6.3 | 16.9 | 7.2 | 5.5 |
Maine | 7.3 | 6.4 | 5.4 | 12.0 | 8.5 | 6.9 | 7.0 | 21.7 | 6.0 | 6.3 |
Maryland | 6.4 | 5.7 | 4.7 | 11.0 | 7.1 | 5.9 | 6.7 | 21.9 | 5.9 | 5.9 |
Massachusetts | 5.8 | 5.2 | 3.7 | 12.5 | 7.0 | 5.6 | 6.0 | 24.2 | 5.6 | 5.6 |
Michigan | 5.8 | 5.0 | 4.0 | 10.9 | 6.8 | 5.3 | 5.7 | 20.7 | 4.8 | 7.0 |
Minnesota | 5.8 | 5.0 | 4.3 | 9.0 | 7.0 | 5.6 | 5.6 | 17.6 | 5.4 | 6.9 |
Mississippi | 6.2 | 5.6 | 5.1 | 8.7 | 7.9 | 5.6 | 6.2 | 12.9 | 5.5 | 4.9 |
Missouri | 6.2 | 5.2 | 4.7 | 8.5 | 7.2 | 5.3 | 5.7 | 14.3 | 5.7 | 5.3 |
Montana | 8.6 | 7.7 | 6.8 | 9.9 | 9.3 | 7.2 | 7.7 | 13.8 | 7.2 | 6.8 |
Nebraska | 6.2 | 5.8 | 4.9 | 8.1 | 6.8 | 5.8 | 6.1 | 12.1 | 5.9 | 5.6 |
Nevada | 6.8 | 5.4 | 5.3 | 12.8 | 8.9 | 5.0 | 6.3 | 29.2 | 6.4 | 5.7 |
New Hampshire | 6.6 | 6.0 | 4.5 | 11.9 | 7.4 | 6.0 | 6.4 | 18.8 | 5.1 | 6.5 |
New Jersey | 6.5 | 5.7 | 4.6 | 15.7 | 8.1 | 5.8 | 6.3 | 28.1 | 5.8 | 5.9 |
New Mexico | 7.0 | 6.1 | 4.5 | 8.3 | 7.1 | 6.3 | 6.5 | 17.6 | 6.0 | 7.6 |
New York | 6.0 | 5.5 | 3.9 | 13.3 | 7.4 | 5.7 | 6.4 | 26.9 | 5.9 | 6.4 |
North Carolina | 6.3 | 5.8 | 4.8 | 8.5 | 7.8 | 5.4 | 5.7 | 14.5 | 5.6 | 5.1 |
North Dakota | 6.7 | 6.8 | 5.2 | 8.8 | 7.2 | 6.6 | 7.0 | 17.2 | 6.9 | 7.1 |
Ohio | 5.7 | 5.1 | 4.5 | 7.7 | 6.6 | 5.3 | 5.6 | 14.4 | 5.3 | 5.2 |
Oklahoma | 6.5 | 5.4 | 5.6 | 6.8 | 7.8 | 6.2 | 6.7 | 12.3 | 6.4 | 5.6 |
Oregon | 6.7 | 6.2 | 5.0 | 9.0 | 7.4 | 5.8 | 6.5 | 18.4 | 6.2 | 6.5 |
Pennsylvania | 5.4 | 4.9 | 3.6 | 10.3 | 6.2 | 4.9 | 5.6 | 18.2 | 5.0 | 5.3 |
Rhode Island | 6.5 | 6.1 | 4.5 | 12.9 | 7.5 | 5.9 | 6.5 | 25.2 | 5.3 | 7.1 |
South Carolina | 6.5 | 5.5 | 5.1 | 8.8 | 8.1 | 5.9 | 6.6 | 14.9 | 6.1 | 5.3 |
South Dakota | 6.4 | 6.0 | 5.1 | 8.6 | 7.2 | 5.8 | 6.6 | 11.6 | 5.5 | 6.2 |
Tennessee | 5.7 | 4.9 | 4.4 | 8.1 | 7.5 | 5.0 | 5.3 | 13.7 | 5.4 | 4.6 |
Texas | 6.0 | 5.0 | 4.7 | 7.2 | 7.5 | 5.1 | 5.5 | 13.6 | 6.0 | 4.8 |
Utah | 6.8 | 6.6 | 6.5 | 9.1 | 8.1 | 6.3 | 6.4 | 10.9 | 6.2 | 5.5 |
Vermont | 6.9 | 5.8 | 4.6 | 12.3 | 7.6 | 6.4 | 7.6 | 18.5 | 5.7 | 7.9 |
Virginia | 6.5 | 5.6 | 4.7 | 10.2 | 7.0 | 5.5 | 6.1 | 18.2 | 5.3 | 5.3 |
Washington | 6.6 | 7.4 | 4.9 | 8.9 | 7.1 | 5.8 | 7.4 | 16.9 | 6.2 | 6.0 |
West Virginia | 6.2 | 6.0 | 5.1 | 8.8 | 7.4 | 7.1 | 6.8 | 13.8 | 7.0 | 6.2 |
Wisconsin | 5.4 | 5.0 | 4.4 | 7.6 | 6.3 | 5.0 | 5.3 | 14.4 | 5.2 | 5.1 |
Wyoming | 9.4 | 8.6 | 6.4 | 10.7 | 10.0 | 8.7 | 9.3 | 18.1 | 7.7 | 7.6 |
Puerto Rico | 5.4 | 5.0 | 4.0 | 11.0 | 6.6 | 4.9 | 5.2 | 16.9 | 5.1 | 4.9 |
Virgin Islands | 10.3 | 7.2 | 5.3 | 8.4 | 8.9 | 7.3 | 8.3 | 19.8 | 12.3 | 5.4 |
Footnotes | ||||||||||
Last Modified Date: Wednesday, August 04, 2021