An official website of the United States government
An official website of the United States government
The .gov means it's official.
Federal government websites often end in .gov or .mil. Before sharing sensitive information,
make sure you're on a federal government site.
The site is secure.
The
https:// ensures that you are connecting to the official website and that any
information you provide is encrypted and transmitted securely.
25-396-ATL
Thursday, March 20, 2025
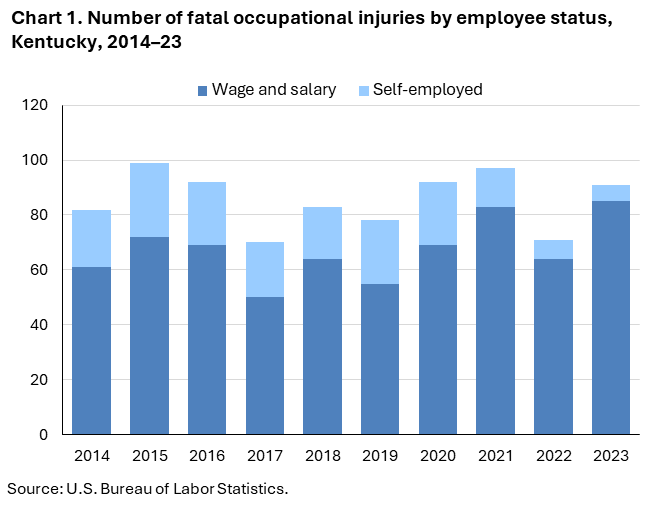
Fatal work injuries totaled 91 in 2023 for Kentucky, the U.S. Bureau of Labor Statistics reported today. Regional Commissioner Victoria G. Lee noted that the number of work-related fatalities in Kentucky was up from the previous year. (See chart 1.) Fatal occupational injuries in the state have ranged from a high of 158 in 1994 to a low of 69 in 2010. Nationwide, a total of 5,283 fatal work injuries were recorded in 2023, a 3.7-percent decrease from 5,486 in 2022, according to the results from the Census of Fatal Occupational Injuries (CFOI).
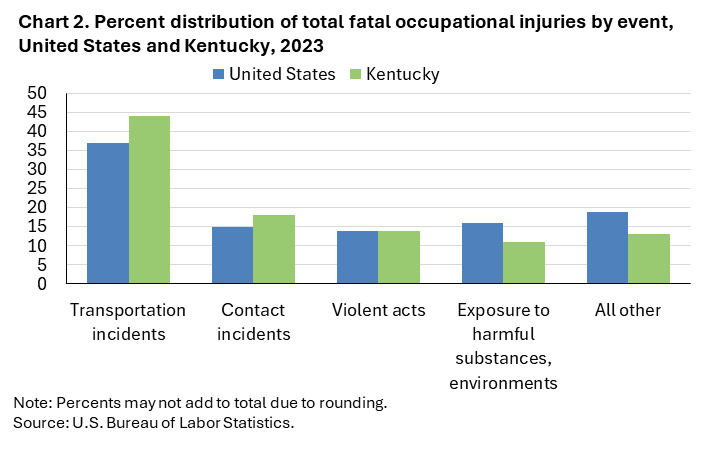
Transportation incidents (40) were the most frequent type of fatal event in Kentucky, accounting for 44 percent of all fatal work injuries in the state. Nationally the share was 37 percent. (See chart 2 and table 1.)
Contact incidents (16) accounted for 18 percent of Kentucky workplace fatalities; nationally the share was 15 percent.
The construction sector accounted for 20 percent of fatal workplace injuries. (See table 2.)
Exposure to harmful substances or environments resulted in 6 of the 18 construction sector fatalities.
The heavy and civil engineering construction subsector accounted for nine of the sector’s fatal workplace injuries.
The construction and extraction occupational group had the highest number of fatal workplace injuries with 20. (See table 3.)
Contact incidents resulted in six of the construction and extraction fatalities.
Construction trades workers accounted for 11 of the major group’s fatal workplace injuries.
Wage and salary workers accounted for 93 percent of workplace fatalities in Kentucky; the self-employed comprised the remaining 7 percent. (See chart 1 and table 4.) Nationally, wage and salary workers comprised 83 percent of fatalities.
Males accounted for 90 percent of the work-related fatalities in Kentucky, compared to 91 percent of workplace fatal injuries nationally.
Workers 25-54 years old accounted for 53 percent of the state’s work-related fatalities, compared to 57 percent of on-the-job fatalities nationally. Workers 55 years and older accounted for 30 percent of the state’s work-related fatalities in 2023, compared to 35 percent of on-the-job fatalities nationally.
White non-Hispanics accounted for 76 percent of those who died from a workplace injury. Nationwide, this group accounted for 56 percent of work-related deaths.
The 2022 North American Industry Classification System (NAICS) and the updated Occupational Injury and Illness Classification System (OIICS) were implemented with the release of 2023 data. As a result of these changes, comparisons between 2023 CFOI data and previous years should be made with caution. Refer to the national release technical note for more information.
Background of the program. The Census of Fatal Occupational Injuries (CFOI), part of the Bureau of Labor Statistics (BLS) Occupational Safety and Health Statistics (OSHS) program, is a count of all fatalities resulting from workplace injuries occurring in the U.S. during the calendar year. For technical information and definitions for the CFOI, see the national CFOI release Technical notes, the BLS Handbook of Methods, and the CFOI definitions.
Acknowledgments. BLS thanks the Kentucky Labor Cabinet for their efforts in collecting accurate, comprehensive, and useful data on fatal work injuries. BLS also appreciates the efforts of all federal, state, local, and private sector entities that provided source documents used to identify fatal work injuries nationally. See the national CFOI release Technical Notes for details on cooperating entities.
Information in this release will be made available to individuals with sensory impairments upon request. Voice phone: (202) 691-5200; Telecommunications Relay Service: 7-1-1.
| Event or Exposure (1) | Number | Percent (%) |
|---|---|---|
All events and exposures | 91 | 100 |
Violent acts | 13 | 14 |
Transportation incidents | 40 | 44 |
Roadway incidents involving motorized land vehicle | 20 | 22 |
Roadway collision with other vehicle(s) | 9 | 10 |
Roadway collision with other vehicle(s)-moving in opposite directions, oncoming | 5 | 5 |
Roadway collision with object other than vehicle | 7 | 8 |
Roadway noncollision incident | 4 | 4 |
Roadway noncollision- jack-knifed or ran off road | 4 | 4 |
Nonroadway incidents involving motorized land vehicles | 4 | 4 |
Nonroadway noncollision incident | 4 | 4 |
Explosions and fires | 5 | 5 |
Explosions | 3 | 3 |
Falls, slips, trips | 7 | 8 |
Exposure to harmful substances, environments | 10 | 11 |
Exposure to electricity | 4 | 4 |
Contact incidents | 16 | 18 |
Struck by propelled, falling, or suspended object | 11 | 12 |
Struck by propelled object or substance | 5 | 5 |
Struck by dislodged or detached object(s) | 5 | 5 |
Struck by falling object | 6 | 7 |
Footnotes: | ||
NOTE: Data for all years are revised and final. Totals for major categories may include subcategories not shown separately. CFOI fatal injury counts exclude illness-related deaths unless precipitated by an injury event. | ||
| Industry | Number | Percentage (%) |
|---|---|---|
Total | 91 | 100 |
Private industry (1) | 75 | 82 |
Natural resources and mining | -- | -- |
Agriculture, forestry, fishing and hunting | 11 | 12 |
Crop production | 6 | 7 |
Forestry and logging | 3 | 3 |
Construction | 18 | 20 |
Construction | 18 | 20 |
Heavy and civil engineering construction | 9 | 10 |
Utility system construction | 4 | 4 |
Highway, street, and bridge construction | 5 | 5 |
Highway, street, and bridge construction | 5 | 5 |
Manufacturing | 5 | 5 |
Manufacturing | 5 | 5 |
Fabricated metal product manufacturing | 1 | 1 |
Coating, engraving, heat treating, and allied activities | 1 | 1 |
Coating, engraving, heat treating, and allied activities | 1 | 1 |
Transportation equipment manufacturing | 1 | 1 |
Motor vehicle parts manufacturing | 1 | 1 |
Trade, transportation, and utilities | -- | -- |
Utilities | 1 | 1 |
Utilities | 1 | 1 |
Electric power generation, transmission and distribution | 1 | 1 |
Electric power transmission, control, and distribution | 1 | 1 |
Electric bulk power transmission and control | 1 | 1 |
Retail trade | 1 | 1 |
Motor vehicle and parts dealers | 1 | 1 |
Automotive parts, accessories, and tire retailers | 1 | 1 |
Transportation and warehousing | 12 | 13 |
Truck transportation | 8 | 9 |
Pipeline transportation | 1 | 1 |
Information | -- | -- |
Financial activities | 6 | 7 |
Finance and insurance | 6 | 7 |
Credit intermediation and related activities | 6 | 7 |
Depository credit intermediation | 6 | 7 |
Professional and business services | -- | -- |
Administrative and support and waste management and remediation services | 7 | 8 |
Educational and health services | -- | -- |
Leisure and hospitality | 3 | 3 |
Accommodation and food services | 3 | 3 |
Other services (except public administration) | -- | -- |
Government (2) | 16 | 18 |
Federal government | 9 | 10 |
State government | -- | -- |
Local government | 6 | 7 |
Footnotes: | ||
NOTE: Data for all years are revised and final. Totals for major categories may include subcategories not shown separately. Dashes indicate no data reported or data that do not meet publication criteria. CFOI fatal injury counts exclude illness-related deaths unless precipitated by an injury event. | ||
| Occupation (1) | Number | Percentage (%) |
|---|---|---|
All occupations | 91 | 100 |
Management occupations | 5 | 5 |
Business and financial operations occupations | -- | -- |
Computer and mathematical occupations | -- | -- |
Architecture and engineering occupations | -- | -- |
Life, physical, and social science occupations | -- | -- |
Community and social service occupations | -- | -- |
Legal occupations | -- | -- |
Educational instruction and library occupations | -- | -- |
Arts, design, entertainment, sports, and media occupations | -- | -- |
Healthcare practitioners and technical occupations | -- | -- |
Healthcare support occupations | -- | -- |
Protective service occupations | 6 | 7 |
Other protective service workers | -- | -- |
Security guards and gambling surveillance officers | 1 | 1 |
Security guards | 1 | 1 |
Food preparation and serving related occupations | -- | -- |
Building and grounds cleaning and maintenance occupations | 4 | 4 |
Personal care and service occupations | -- | -- |
Sales and related occupations | -- | -- |
Office and administrative support occupations | 5 | 5 |
Farming, fishing, and forestry occupations | 9 | 10 |
Agricultural workers | 6 | 7 |
Miscellaneous agricultural workers | 6 | 7 |
Agricultural equipment operators | 1 | 1 |
Farmworkers and laborers, crop, nursery, and greenhouse | 4 | 4 |
Forest, conservation, and logging workers | 3 | 3 |
Logging workers | 3 | 3 |
Fallers | 3 | 3 |
Construction and extraction occupations | 20 | 22 |
Supervisors of construction and extraction workers | 3 | 3 |
First-line supervisors of construction trades and extraction workers | 3 | 3 |
First-line supervisors of construction trades and extraction workers | 3 | 3 |
Construction trades workers | 11 | 12 |
Construction laborers | 5 | 5 |
Construction laborers | 5 | 5 |
Roofers | 1 | 1 |
Roofers | 1 | 1 |
Extraction workers | 1 | 1 |
Roustabouts, oil and gas | 1 | 1 |
Roustabouts, oil and gas | 1 | 1 |
Installation, maintenance, and repair occupations | 6 | 7 |
Other installation, maintenance, and repair occupations | 4 | 4 |
Production occupations | 6 | 7 |
Assemblers and fabricators | 1 | 1 |
Miscellaneous assemblers and fabricators | 1 | 1 |
Plant and system operators | 1 | 1 |
Miscellaneous plant and system operators | 1 | 1 |
Transportation and material moving occupations | 17 | 19 |
Motor vehicle operators | 11 | 12 |
Footnotes: | ||
NOTE: Data for all years are revised and final. Totals for major categories may include subcategories not shown separately. Dashes indicate no data reported or data that do not meet publication criteria. CFOI fatal injury counts exclude illness-related deaths unless precipitated by an injury event. | ||
| Demographic | Number | Percentage (%) |
|---|---|---|
Total | 91 | 100 |
Employee status | ||
Wage and salary workers (1) | 85 | 93 |
Self-employed (2) | 6 | 7 |
Sex | ||
Male | 82 | 90 |
Female | 9 | 10 |
Age (3) | ||
Under 16 years | -- | -- |
16 to 17 years | -- | -- |
18 to 19 years | 3 | 3 |
20 to 24 years | 12 | 13 |
25 to 34 years | 19 | 21 |
35 to 44 years | 17 | 19 |
45 to 54 years | 12 | 13 |
55 to 64 years | 17 | 19 |
65 years and over | 10 | 11 |
Race or ethnic origin (4) | ||
White, non-Hispanic | 69 | 76 |
Black or African-American, non-Hispanic | 7 | 8 |
Hispanic or Latino | 8 | 9 |
American Indian or Alaska Native, non-Hispanic | -- | -- |
Asian, non-Hispanic | -- | -- |
Native Hawaiian or Pacific Islander, non-Hispanic | -- | -- |
Footnotes: | ||
NOTE: Data for all years are revised and final. Totals for major categories may include subcategories not shown separately. Dashes indicate no data reported or data that do not meet publication criteria. CFOI fatal injury counts exclude illness-related deaths unless precipitated by an injury event. | ||
Last Modified Date: Thursday, March 20, 2025