An official website of the United States government
An official website of the United States government
The .gov means it's official.
Federal government websites often end in .gov or .mil. Before sharing sensitive information,
make sure you're on a federal government site.
The site is secure.
The
https:// ensures that you are connecting to the official website and that any
information you provide is encrypted and transmitted securely.
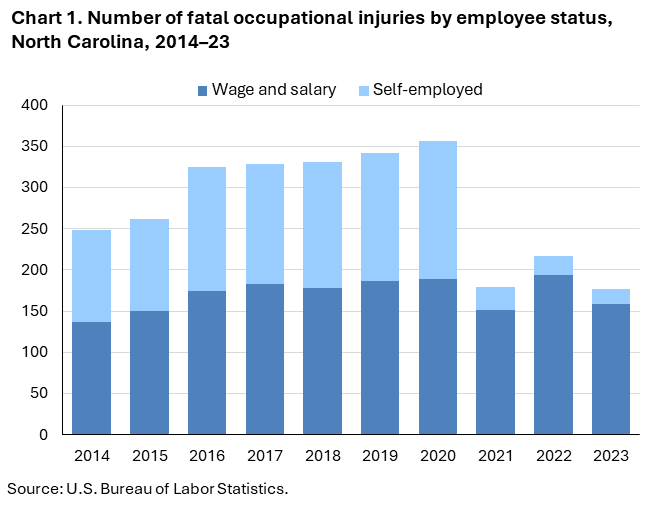
This news release was reissued on March 10, 2026, to correct errors in Chart 1 and the Chart 1 data table for fatal occupational injuries by employee status for years 2014 to 2020. None of the incorrect values appear in the BLS database, news release text, or other published tables.
25-398-ATL
Thursday, March 20, 2025
Fatal work injuries totaled 177 in 2023 for North Carolina, the U.S. Bureau of Labor Statistics reported today. Regional Commissioner Victoria G. Lee noted that the number of work-related fatalities in North Carolina was down from the previous year. (See chart 1.) Fatal occupational injuries in the state have ranged from a high of 234 in 2000 to a low of 109 in 2013. Nationwide, a total of 5,283 fatal work injuries were recorded in 2023, a 3.7-percent decrease from 5,486 in 2022, according to the results from the Census of Fatal Occupational Injuries (CFOI).
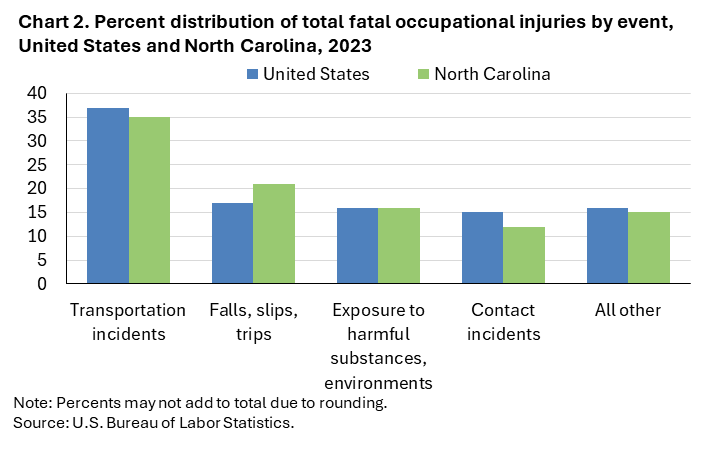
Transportation incidents (62) were the most frequent type of fatal event in North Carolina, accounting for 35 percent of all fatal work injuries in the state. Nationally the share was 37 percent. (See chart 2 and table 1.)
Falls, slips, and trips (38) accounted for 21 percent of North Carolina workplace fatalities; nationally the share was 17 percent.
The construction sector had the highest number of fatalities with 43. (See table 2.)
Falls, slips, and trips resulted in 20 of the 43 construction sector fatalities.
The specialty trade contractors subsector accounted for 32 of the sector’s fatal workplace injuries.
The transportation and material moving occupational group had the highest number of fatal workplace injuries with 45. (See table 3.)
Transportation incidents resulted in 28 of the transportation and material moving fatalities.
Heavy and tractor-trailer truck drivers accounted for 25 of the major group’s fatal workplace injuries.
Wage and salary workers accounted for 90 percent of workplace fatalities in North Carolina; the self-employed comprised the remaining 10 percent. (See chart 1 and table 4.) Nationally, wage and salary workers comprised 83 percent of fatalities.
Males accounted for 93 percent of the work-related fatalities in North Carolina, compared to the national share of 91 percent.
Workers 25-54 years old accounted for 57 percent of the work-related fatalities both in North Carolina and nationally.
White non-Hispanics accounted for 53 percent of those who died from a workplace injury. Nationwide, this group accounted for 56 percent of work-related deaths.
The 2022 North American Industry Classification System (NAICS) and the updated Occupational Injury and Illness Classification System (OIICS) were implemented with the release of 2023 data. As a result of these changes, comparisons between 2023 CFOI data and previous years should be made with caution. Refer to the national release technical note for more information.
Background of the program. The Census of Fatal Occupational Injuries (CFOI), part of the Bureau of Labor Statistics (BLS) Occupational Safety and Health Statistics (OSHS) program, is a count of all fatalities resulting from workplace injuries occurring in the U.S. during the calendar year. For technical information and definitions for the CFOI, see the national CFOI release Technical notes, the BLS Handbook of Methods, and the CFOI definitions.
Acknowledgments. BLS thanks the North Carolina Department of Labor for their efforts in collecting accurate, comprehensive, and useful data on fatal work injuries. BLS also appreciates the efforts of all federal, state, local, and private sector entities that provided source documents used to identify fatal work injuries nationally. See the national CFOI release Technical Notes for details on cooperating entities.
Information in this release will be made available to individuals with sensory impairments upon request. Voice phone: (202) 691-5200; Telecommunications Relay Service: 7-1-1.
| Event or Exposure (1) | Number | Percent (%) |
|---|---|---|
|
All events and exposures |
177 | 100 |
|
Violent acts |
17 | 10 |
|
Homicides (violent acts by other person) |
12 | 7 |
|
Shooting by other person |
10 | 6 |
|
Suicides (intentional self-harm) |
5 | 3 |
|
Transportation incidents |
62 | 35 |
|
Pedestrian incidents involving motorized land vehicles |
17 | 10 |
|
Pedestrian struck by vehicle in road work zone |
4 | 2 |
|
Pedestrian struck by forward-moving vehicle in road work zone |
3 | 2 |
|
Pedestrian struck by vehicle backing up in road work zone |
1 | 1 |
|
Pedestrian struck by vehicle in roadway |
7 | 4 |
|
Pedestrian struck by vehicle in nonroadway area |
6 | 3 |
|
Roadway incidents involving motorized land vehicle |
40 | 23 |
|
Roadway collision with other vehicle(s) |
18 | 10 |
|
Roadway collision with other vehicle(s)-moving in same direction |
4 | 2 |
|
Roadway collision with other vehicle(s)-moving and standing vehicle |
8 | 5 |
|
Roadway collision with object other than vehicle |
15 | 8 |
|
Collision with object or animal on side of roadway |
15 | 8 |
|
Roadway noncollision incident |
7 | 4 |
|
Nonroadway incidents involving motorized land vehicles |
5 | 3 |
|
Nonroadway noncollision incident |
5 | 3 |
|
Explosions and fires |
9 | 5 |
|
Explosions |
4 | 2 |
|
Fires (without explosions) |
5 | 3 |
|
Structural fire without collapse |
2 | 1 |
|
Falls, slips, trips |
38 | 21 |
|
Fall to lower level |
33 | 19 |
|
Other fall to lower level |
23 | 13 |
|
Other fall to lower level- 6 to 30 feet |
18 | 10 |
|
Other fall to lower level- more than 30 feet |
3 | 2 |
|
Exposure to harmful substances, environments |
28 | 16 |
|
Exposure to electricity |
3 | 2 |
|
Exposure to harmful substances |
23 | 13 |
|
Contact incidents |
22 | 12 |
|
Struck by propelled, falling, or suspended object |
7 | 4 |
|
Struck by falling object |
6 | 3 |
|
Struck by falling part of vehicle or machine, still attached |
1 | 1 |
|
Struck, caught, or compressed by running powered equipment |
12 | 7 |
|
Struck by running powered equipment- during maintenance, cleaning, testing |
6 | 3 |
|
Compressed between running equipment and other object(s) |
3 | 2 |
|
Footnotes: |
||
|
NOTE: Data for all years are revised and final. Totals for major categories may include subcategories not shown separately. CFOI fatal injury counts exclude illness-related deaths unless precipitated by an injury event. |
||
| Industry | Number | Percentage (%) |
|---|---|---|
|
Total |
177 | 100 |
|
Private industry (1) |
166 | 94 |
|
Natural resources and mining |
7 | 4 |
|
Agriculture, forestry, fishing and hunting |
7 | 4 |
|
Crop production |
4 | 2 |
|
Other crop farming |
3 | 2 |
|
Tobacco farming |
3 | 2 |
|
Construction |
43 | 24 |
|
Construction |
43 | 24 |
|
Construction of buildings |
7 | 4 |
|
Residential building construction |
3 | 2 |
|
Residential building construction |
3 | 2 |
|
Nonresidential building construction |
3 | 2 |
|
Heavy and civil engineering construction |
4 | 2 |
|
Utility system construction |
1 | 1 |
|
Water and sewer line and related structures construction |
1 | 1 |
|
Specialty trade contractors |
32 | 18 |
|
Foundation, structure, and building exterior contractors |
13 | 7 |
|
Framing contractors |
3 | 2 |
|
Nonresidential framing contractors |
1 | 1 |
|
Roofing contractors |
5 | 3 |
|
Building equipment contractors |
4 | 2 |
|
Building finishing contractors |
8 | 5 |
|
Painting and wall covering contractors |
3 | 2 |
|
Finish carpentry contractors |
2 | 1 |
|
Other specialty trade contractors |
7 | 4 |
|
Site preparation contractors |
4 | 2 |
|
All other specialty trade contractors |
3 | 2 |
|
Manufacturing |
19 | 11 |
|
Manufacturing |
19 | 11 |
|
Food manufacturing |
5 | 3 |
|
Animal food manufacturing |
2 | 1 |
|
Animal food manufacturing |
2 | 1 |
|
Wood product manufacturing |
4 | 2 |
|
Plastics and rubber products manufacturing |
3 | 2 |
|
Plastics product manufacturing |
3 | 2 |
|
Other plastics product manufacturing |
3 | 2 |
|
Nonmetallic mineral product manufacturing |
3 | 2 |
|
Cement and concrete product manufacturing |
3 | 2 |
|
Ready-mix concrete manufacturing |
3 | 2 |
|
Trade, transportation, and utilities |
46 | 26 |
|
Utilities |
4 | 2 |
|
Utilities |
4 | 2 |
|
Electric power generation, transmission and distribution |
3 | 2 |
|
Natural gas distribution |
1 | 1 |
|
Natural gas distribution |
1 | 1 |
|
Wholesale trade |
7 | 4 |
|
Merchant wholesalers, durable goods |
3 | 2 |
|
Merchant wholesalers, nondurable goods |
4 | 2 |
|
Retail trade |
12 | 7 |
|
Motor vehicle and parts dealers |
1 | 1 |
|
Automotive parts, accessories, and tire retailers |
1 | 1 |
|
Tire dealers |
1 | 1 |
|
Food and beverage retailers |
1 | 1 |
|
Grocery and convenience retailers |
1 | 1 |
|
Convenience retailers and vending machine operators |
1 | 1 |
|
Convenience retailers |
1 | 1 |
|
Gasoline stations and fuel dealers |
4 | 2 |
|
Gasoline stations |
4 | 2 |
|
Gasoline stations with convenience stores |
4 | 2 |
|
Transportation and warehousing |
23 | 13 |
|
Rail transportation |
1 | 1 |
|
Rail transportation |
1 | 1 |
|
Rail transportation |
1 | 1 |
|
Line-haul railroads |
1 | 1 |
|
Truck transportation |
17 | 10 |
|
General freight trucking |
10 | 6 |
|
Specialized freight trucking |
7 | 4 |
|
Specialized freight (except used goods) trucking, local |
3 | 2 |
|
Support activities for transportation |
3 | 2 |
|
Information |
-- | -- |
|
Financial activities |
4 | 2 |
|
Real estate and rental and leasing |
4 | 2 |
|
Real estate |
3 | 2 |
|
Rental and leasing services |
1 | 1 |
|
Commercial and industrial machinery and equipment rental and leasing |
1 | 1 |
|
Construction, transportation, mining, and forestry machinery and equipment rental and leasing |
1 | 1 |
|
Construction, mining, and forestry machinery and equipment rental and leasing |
1 | 1 |
|
Professional and business services |
28 | 16 |
|
Professional, scientific, and technical services |
6 | 3 |
|
Professional, scientific, and technical services |
6 | 3 |
|
Architectural, engineering, and related services |
3 | 2 |
|
Administrative and support and waste management and remediation services |
22 | 12 |
|
Administrative and support services |
18 | 10 |
|
Employment services |
3 | 2 |
|
Temporary help services |
3 | 2 |
|
Investigation and security services |
1 | 1 |
|
Security systems services |
1 | 1 |
|
Services to buildings and dwellings |
14 | 8 |
|
Landscaping services |
10 | 6 |
|
Waste management and remediation services |
4 | 2 |
|
Educational and health services |
4 | 2 |
|
Health care and social assistance |
4 | 2 |
|
Leisure and hospitality |
-- | -- |
|
Accommodation and food services |
9 | 5 |
|
Accommodation |
4 | 2 |
|
Traveler accommodation |
3 | 2 |
|
Rv (recreational vehicle) parks and recreational camps |
1 | 1 |
|
Rv (recreational vehicle) parks and recreational camps |
1 | 1 |
|
Food services and drinking places |
5 | 3 |
|
Drinking places (alcoholic beverages) |
1 | 1 |
|
Drinking places (alcoholic beverages) |
1 | 1 |
|
Restaurants and other eating places |
4 | 2 |
|
Restaurants and other eating places |
4 | 2 |
|
Other services (except public administration) |
3 | 2 |
|
Other services (except public administration) |
3 | 2 |
|
Government (2) |
11 | 6 |
|
Federal government |
3 | 2 |
|
State government |
2 | 1 |
|
Local government |
6 | 3 |
|
Footnotes: |
||
|
NOTE: Data for all years are revised and final. Totals for major categories may include subcategories not shown separately. Dashes indicate no data reported or data that do not meet publication criteria. CFOI fatal injury counts exclude illness-related deaths unless precipitated by an injury event. |
||
| Occupation (1) | Number | Percentage (%) |
|---|---|---|
|
All occupations |
177 | 100 |
|
Management occupations |
6 | 3 |
|
Other management occupations |
6 | 3 |
|
Farmers, ranchers, and other agricultural managers |
2 | 1 |
|
Farmers, ranchers, and other agricultural managers |
2 | 1 |
|
Business and financial operations occupations |
-- | -- |
|
Computer and mathematical occupations |
-- | -- |
|
Architecture and engineering occupations |
-- | -- |
|
Life, physical, and social science occupations |
-- | -- |
|
Community and social service occupations |
-- | -- |
|
Legal occupations |
-- | -- |
|
Educational instruction and library occupations |
-- | -- |
|
Arts, design, entertainment, sports, and media occupations |
1 | 1 |
|
Media and communication equipment workers |
1 | 1 |
|
Healthcare practitioners and technical occupations |
-- | -- |
|
Healthcare support occupations |
-- | -- |
|
Protective service occupations |
8 | 5 |
|
Other protective service workers |
5 | 3 |
|
Security guards and gambling surveillance officers |
3 | 2 |
|
Security guards |
3 | 2 |
|
Miscellaneous protective service workers |
2 | 1 |
|
Crossing guards and flaggers |
2 | 1 |
|
Food preparation and serving related occupations |
4 | 2 |
|
Food and beverage serving workers |
1 | 1 |
|
Fast food and counter workers |
1 | 1 |
|
Fast food and counter workers |
1 | 1 |
|
Building and grounds cleaning and maintenance occupations |
17 | 10 |
|
Grounds maintenance workers |
11 | 6 |
|
Grounds maintenance workers |
11 | 6 |
|
Tree trimmers and pruners |
5 | 3 |
|
Personal care and service occupations |
3 | 2 |
|
Sales and related occupations |
10 | 6 |
|
Retail sales workers |
7 | 4 |
|
Office and administrative support occupations |
-- | -- |
|
Farming, fishing, and forestry occupations |
5 | 3 |
|
Construction and extraction occupations |
36 | 20 |
|
Supervisors of construction and extraction workers |
4 | 2 |
|
First-line supervisors of construction trades and extraction workers |
4 | 2 |
|
First-line supervisors of construction trades and extraction workers |
4 | 2 |
|
Construction trades workers |
29 | 16 |
|
Carpenters |
8 | 5 |
|
Carpenters |
8 | 5 |
|
Construction laborers |
5 | 3 |
|
Construction laborers |
5 | 3 |
|
Electricians |
1 | 1 |
|
Electricians |
1 | 1 |
|
Roofers |
5 | 3 |
|
Roofers |
5 | 3 |
|
Extraction workers |
1 | 1 |
|
Surface mining machine operators and earth drillers |
1 | 1 |
|
Excavating and loading machine and dragline operators, surface mining |
1 | 1 |
|
Installation, maintenance, and repair occupations |
23 | 13 |
|
Vehicle and mobile equipment mechanics, installers, and repairers |
6 | 3 |
|
Heavy vehicle and mobile equipment service technicians and mechanics |
3 | 2 |
|
Mobile heavy equipment mechanics, except engines |
3 | 2 |
|
Other installation, maintenance, and repair occupations |
12 | 7 |
|
Maintenance and repair workers, general |
3 | 2 |
|
Maintenance and repair workers, general |
3 | 2 |
|
Miscellaneous installation, maintenance, and repair workers |
3 | 2 |
|
Riggers |
1 | 1 |
|
Signal and track switch repairers |
1 | 1 |
|
Production occupations |
8 | 5 |
|
Plant and system operators |
1 | 1 |
|
Water and wastewater treatment plant and system operators |
1 | 1 |
|
Water and wastewater treatment plant and system operators |
1 | 1 |
|
Transportation and material moving occupations |
45 | 25 |
|
Motor vehicle operators |
31 | 18 |
|
Driver/sales workers and truck drivers |
30 | 17 |
|
Heavy and tractor-trailer truck drivers |
25 | 14 |
|
Miscellaneous motor vehicle operators |
1 | 1 |
|
Footnotes: |
||
|
NOTE: Data for all years are revised and final. Totals for major categories may include subcategories not shown separately. Dashes indicate no data reported or data that do not meet publication criteria. CFOI fatal injury counts exclude illness-related deaths unless precipitated by an injury event. |
||
| Demographic | Number | Percentage (%) |
|---|---|---|
|
Total |
177 | 100 |
|
Employee status |
||
|
Wage and salary workers (1) |
159 | 90 |
|
Self-employed (2) |
18 | 10 |
|
Sex |
||
|
Male |
164 | 93 |
|
Female |
13 | 7 |
|
Age (3) |
||
|
Under 16 years |
-- | -- |
|
16 to 17 years |
-- | -- |
|
18 to 19 years |
7 | 4 |
|
20 to 24 years |
8 | 5 |
|
25 to 34 years |
25 | 14 |
|
35 to 44 years |
43 | 24 |
|
45 to 54 years |
33 | 19 |
|
55 to 64 years |
36 | 20 |
|
65 years and over |
25 | 14 |
|
Race or ethnic origin (4) |
||
|
White, non-Hispanic |
93 | 53 |
|
Black or African-American, non-Hispanic |
36 | 20 |
|
Hispanic or Latino |
41 | 23 |
|
American Indian or Alaska Native, non-Hispanic |
3 | 2 |
|
Asian, non-Hispanic |
-- | -- |
|
Native Hawaiian or Pacific Islander, non-Hispanic |
-- | -- |
|
Footnotes: |
||
|
NOTE: Data for all years are revised and final. Totals for major categories may include subcategories not shown separately. Dashes indicate no data reported or data that do not meet publication criteria. CFOI fatal injury counts exclude illness-related deaths unless precipitated by an injury event. |
||
Last Modified Date: Thursday, March 20, 2025