An official website of the United States government
An official website of the United States government
The .gov means it's official.
Federal government websites often end in .gov or .mil. Before sharing sensitive information,
make sure you're on a federal government site.
The site is secure.
The
https:// ensures that you are connecting to the official website and that any
information you provide is encrypted and transmitted securely.
25-400-ATL
Thursday, March 20, 2025
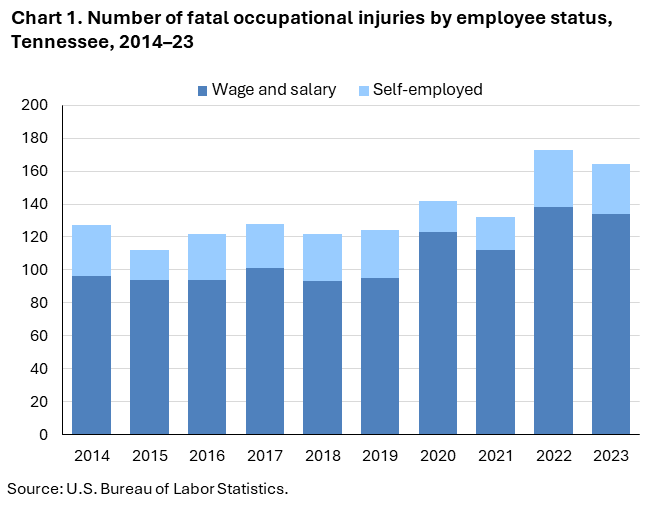
Fatal work injuries totaled 164 in 2023 for Tennessee, the U.S. Bureau of Labor Statistics reported today. Regional Commissioner Victoria G. Lee noted that the number of work-related fatalities in Tennessee was down from the previous year. (See chart 1.) Fatal occupational injuries in the state have ranged from a high of 179 in 1995 to a low of 95 in 2013. Nationwide, a total of 5,283 fatal work injuries were recorded in 2023, a 3.7-percent decrease from 5,486 in 2022, according to the results from the Census of Fatal Occupational Injuries (CFOI).
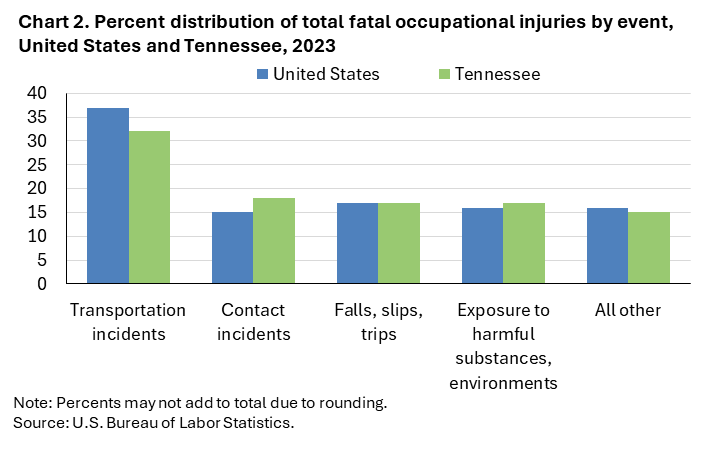
Transportation incidents (53) were the most frequent type of fatal event in Tennessee, accounting for 32 percent of all fatal work injuries in the state. Nationally the share was 37 percent. (See chart 2 and table 1.)
Contact incidents (30) accounted for 18 percent of Tennessee workplace fatalities; nationally the share was 15 percent.
The construction sector had the highest number of fatalities with 42. (See table 2.)
Falls, slips, and trips resulted in 16 of the 42 construction sector fatalities.
The specialty trade contractors subsector accounted for 25 of the sector’s fatal workplace injuries.
The construction and extraction occupational group tied for the highest number of fatal workplace injuries with 41. (See table 3.) Falls, slips, and trips accounted for 15 of the construction and extraction fatalities. Construction laborers accounted for 16 of the major group’s fatal workplace injuries.
The transportation and material moving occupational group also had 41 fatal workplace injuries. Motor vehicle operators accounted for 21 of the transportation and material moving fatalities.
Wage and salary workers accounted for 82 percent of workplace fatalities in Tennessee; the self-employed comprised the remaining 18 percent. (See chart 1 and table 4.) Nationally, wage and salary workers comprised 83 percent of fatalities.
Males accounted for 91 percent of the work-related fatalities both in Tennessee and nationally.
Workers 25-54 years old accounted for 62 percent of the state’s work-related fatalities, compared to 57 percent of on-the-job fatalities nationally. Workers 55 years and older accounted for 29 percent of the state’s work-related fatalities in 2023, compared to 35 percent of on-the-job fatalities nationally.
White non-Hispanics accounted for 64 percent of those who died from a workplace injury. Nationwide, this group accounted for 56 percent of work-related deaths.
The 2022 North American Industry Classification System (NAICS) and the updated Occupational Injury and Illness Classification System (OIICS) were implemented with the release of 2023 data. As a result of these changes, comparisons between 2023 CFOI data and previous years should be made with caution. Refer to the national release technical note for more information.
Background of the program. The Census of Fatal Occupational Injuries (CFOI), part of the Bureau of Labor Statistics (BLS) Occupational Safety and Health Statistics (OSHS) program, is a count of all fatalities resulting from workplace injuries occurring in the U.S. during the calendar year. For technical information and definitions for the CFOI, see the national CFOI release Technical notes, the BLS Handbook of Methods, and the CFOI definitions.
Acknowledgments. BLS thanks the Tennessee Department of Labor and Workforce Development for their efforts in collecting accurate, comprehensive, and useful data on fatal work injuries. BLS also appreciates the efforts of all federal, state, local, and private sector entities that provided source documents used to identify fatal work injuries nationally. See the national CFOI release Technical Notes for details on cooperating entities.
Information in this release will be made available to individuals with sensory impairments upon request. Voice phone: (202) 691-5200; Telecommunications Relay Service: 7-1-1.
| Event or Exposure (1) | Number | Percent (%) |
|---|---|---|
All events and exposures | 164 | 100 |
Violent acts | -- | -- |
Transportation incidents | 53 | 32 |
Aircraft incidents | 1 | 1 |
In-flight crash, collision | 1 | 1 |
Pedestrian incidents involving motorized land vehicles | 15 | 9 |
Pedestrian struck by vehicle in roadway | 9 | 5 |
Pedestrian struck by forward-moving vehicle in roadway | 9 | 5 |
Pedestrian struck by vehicle in nonroadway area | 3 | 2 |
Roadway incidents involving motorized land vehicle | 29 | 18 |
Roadway collision with other vehicle(s) | 16 | 10 |
Roadway collision with other vehicle(s)-moving in same direction | 4 | 2 |
Roadway collision with other vehicle(s)-moving in opposite directions, oncoming | 7 | 4 |
Roadway collision with object other than vehicle | 6 | 4 |
Collision with object or animal on side of roadway | 4 | 2 |
Roadway noncollision incident | 7 | 4 |
Nonroadway incidents involving motorized land vehicles | 8 | 5 |
Explosions and fires | -- | -- |
Falls, slips, trips | 28 | 17 |
Fall to lower level | 23 | 14 |
Other fall to lower level | 20 | 12 |
Other fall to lower level- 6 to 30 feet | 12 | 7 |
Other fall to lower level- more than 30 feet | 3 | 2 |
Slip, trip, stumble or fall on same level | 5 | 3 |
Fall on same level | 5 | 3 |
Exposure to harmful substances, environments | 28 | 17 |
Exposure to temperature extremes | 2 | 1 |
Exposure to harmful substances | 23 | 14 |
Drug, alcohol overdose | 19 | 12 |
Contact incidents | 30 | 18 |
Contact with animals | 3 | 2 |
Collapse, engulfment | 2 | 1 |
Collapse, engulfment- open trench or excavation | 1 | 1 |
Struck by propelled, falling, or suspended object | 14 | 9 |
Struck by propelled object or substance | 1 | 1 |
Struck by dislodged or detached object(s) | 1 | 1 |
Struck by falling object | 13 | 8 |
Struck, caught, or compressed by running powered equipment | 6 | 4 |
Struck by running powered equipment- during maintenance, cleaning, testing | 1 | 1 |
Contact with non-running objects or equipment | 5 | 3 |
Caught or wedged between objects- nonrunning | 2 | 1 |
Footnotes: | ||
NOTE: Data for all years are revised and final. Totals for major categories may include subcategories not shown separately. Dashes indicate no data reported or data that do not meet publication criteria. CFOI fatal injury counts exclude illness-related deaths unless precipitated by an injury event. | ||
| Industry | Number | Percentage (%) |
|---|---|---|
Total | 164 | 100 |
Private industry (1) | 154 | 94 |
Natural resources and mining | 9 | 5 |
Agriculture, forestry, fishing and hunting | 6 | 4 |
Forestry and logging | 4 | 2 |
Logging | 4 | 2 |
Logging | 4 | 2 |
Mining, quarrying, and oil and gas extraction | 3 | 2 |
Mining (except oil and gas) | 2 | 1 |
Nonmetallic mineral mining and quarrying | 2 | 1 |
Stone mining and quarrying | 2 | 1 |
Support activities for mining | 1 | 1 |
Support activities for mining | 1 | 1 |
Support activities for mining | 1 | 1 |
Drilling oil and gas wells | 1 | 1 |
Construction | 42 | 26 |
Construction | 42 | 26 |
Construction of buildings | 15 | 9 |
Residential building construction | 9 | 5 |
Residential building construction | 9 | 5 |
Residential remodelers | 7 | 4 |
Nonresidential building construction | 6 | 4 |
Industrial building construction | 1 | 1 |
Commercial and institutional building construction | 5 | 3 |
Heavy and civil engineering construction | 2 | 1 |
Utility system construction | 2 | 1 |
Water and sewer line and related structures construction | 1 | 1 |
Power and communication line and related structures construction | 1 | 1 |
Specialty trade contractors | 25 | 15 |
Foundation, structure, and building exterior contractors | 13 | 8 |
Poured concrete foundation and structure contractors | 1 | 1 |
Residential poured concrete foundation and structure contractors | 1 | 1 |
Framing contractors | 3 | 2 |
Residential framing contractors | 2 | 1 |
Nonresidential framing contractors | 1 | 1 |
Roofing contractors | 7 | 4 |
Residential roofing contractors | 3 | 2 |
Nonresidential roofing contractors | 3 | 2 |
Building equipment contractors | 4 | 2 |
Electrical contractors and other wiring installation contractors | 1 | 1 |
Nonresidential electrical contractors and other wiring installation contractors | 1 | 1 |
Building finishing contractors | 3 | 2 |
Other specialty trade contractors | 5 | 3 |
Site preparation contractors | 4 | 2 |
Residential site preparation contractors | 1 | 1 |
Nonresidential site preparation contractors | 3 | 2 |
All other specialty trade contractors | 1 | 1 |
Manufacturing | 9 | 5 |
Manufacturing | 9 | 5 |
Wood product manufacturing | 2 | 1 |
Plastics and rubber products manufacturing | 1 | 1 |
Plastics product manufacturing | 1 | 1 |
Miscellaneous manufacturing | 1 | 1 |
Medical equipment and supplies manufacturing | 1 | 1 |
Medical equipment and supplies manufacturing | 1 | 1 |
Trade, transportation, and utilities | -- | -- |
Retail trade | 10 | 6 |
Motor vehicle and parts dealers | 3 | 2 |
Automobile dealers | 3 | 2 |
Used car dealers | 3 | 2 |
Food and beverage retailers | 1 | 1 |
Specialty food retailers | 1 | 1 |
Fruit and vegetable retailers | 1 | 1 |
General merchandise retailers | 3 | 2 |
Warehouse clubs, supercenters, and other general merchandise retailers | 3 | 2 |
Warehouse clubs, supercenters, and other general merchandise retailers | 3 | 2 |
Warehouse clubs and supercenters | 3 | 2 |
Gasoline stations and fuel dealers | 3 | 2 |
Gasoline stations | 3 | 2 |
Gasoline stations with convenience stores | 3 | 2 |
Transportation and warehousing | 23 | 14 |
Truck transportation | 17 | 10 |
General freight trucking | 9 | 5 |
Specialized freight trucking | 8 | 5 |
Warehousing and storage | 3 | 2 |
Warehousing and storage | 3 | 2 |
General warehousing and storage | 3 | 2 |
Information | -- | -- |
Financial activities | 3 | 2 |
Real estate and rental and leasing | 3 | 2 |
Professional and business services | 30 | 18 |
Professional, scientific, and technical services | 2 | 1 |
Professional, scientific, and technical services | 2 | 1 |
Architectural, engineering, and related services | 1 | 1 |
Surveying and mapping (except geophysical) services | 1 | 1 |
Advertising, public relations, and related services | 1 | 1 |
Indoor and outdoor display advertising | 1 | 1 |
Administrative and support and waste management and remediation services | 28 | 17 |
Administrative and support services | 25 | 15 |
Investigation and security services | 4 | 2 |
Investigation, guard, and armored car services | 4 | 2 |
Services to buildings and dwellings | 16 | 10 |
Landscaping services | 14 | 9 |
Waste management and remediation services | 3 | 2 |
Educational and health services | 9 | 5 |
Educational services | 4 | 2 |
Educational services | 4 | 2 |
Elementary and secondary schools | 3 | 2 |
Elementary and secondary schools | 3 | 2 |
Technical and trade schools | 1 | 1 |
Technical and trade schools | 1 | 1 |
Health care and social assistance | 5 | 3 |
Ambulatory health care services | 3 | 2 |
Offices of other health practitioners | 1 | 1 |
Offices of mental health practitioners (except physicians) | 1 | 1 |
Leisure and hospitality | 5 | 3 |
Arts, entertainment, and recreation | 2 | 1 |
Performing arts, spectator sports, and related industries | 1 | 1 |
Museums, historical sites, and similar institutions | 1 | 1 |
Museums, historical sites, and similar institutions | 1 | 1 |
Accommodation and food services | 3 | 2 |
Food services and drinking places | 3 | 2 |
Other services (except public administration) | 11 | 7 |
Other services (except public administration) | 11 | 7 |
Repair and maintenance | 10 | 6 |
Automotive repair and maintenance | 5 | 3 |
Commercial and industrial machinery and equip.(except auto and electronic) repair and maintenance | 5 | 3 |
Commercial and industrial machinery and equip.(except auto and electronic) repair and maintenance | 5 | 3 |
Personal and laundry services | 1 | 1 |
Personal care services | 1 | 1 |
Hair, nail, and skin care services | 1 | 1 |
Beauty salons | 1 | 1 |
Government (2) | 10 | 6 |
Federal government | -- | -- |
State government | -- | -- |
Local government | 9 | 5 |
Footnotes: | ||
NOTE: Data for all years are revised and final. Totals for major categories may include subcategories not shown separately. Dashes indicate no data reported or data that do not meet publication criteria. CFOI fatal injury counts exclude illness-related deaths unless precipitated by an injury event. | ||
| Occupation (1) | Number | Percentage (%) |
|---|---|---|
All occupations | 164 | 100 |
Management occupations | 1 | 1 |
Other management occupations | 1 | 1 |
Business and financial operations occupations | -- | -- |
Computer and mathematical occupations | -- | -- |
Architecture and engineering occupations | -- | -- |
Life, physical, and social science occupations | -- | -- |
Community and social service occupations | -- | -- |
Legal occupations | -- | -- |
Educational instruction and library occupations | 1 | 1 |
Other teachers and instructors | 1 | 1 |
Arts, design, entertainment, sports, and media occupations | 2 | 1 |
Entertainers and performers, sports and related workers | 2 | 1 |
Healthcare practitioners and technical occupations | 2 | 1 |
Healthcare diagnosing or treating practitioners | 2 | 1 |
Registered nurses | 1 | 1 |
Registered nurses | 1 | 1 |
Surgeons | 1 | 1 |
Orthopedic surgeons, except pediatric | 1 | 1 |
Healthcare support occupations | -- | -- |
Protective service occupations | 11 | 7 |
Other protective service workers | 5 | 3 |
Security guards and gambling surveillance officers | 4 | 2 |
Security guards | 4 | 2 |
Miscellaneous protective service workers | 1 | 1 |
Food preparation and serving related occupations | -- | -- |
Building and grounds cleaning and maintenance occupations | 18 | 11 |
Grounds maintenance workers | 12 | 7 |
Grounds maintenance workers | 12 | 7 |
Landscaping and groundskeeping workers | 7 | 4 |
Tree trimmers and pruners | 5 | 3 |
Personal care and service occupations | 2 | 1 |
Personal appearance workers | 1 | 1 |
Tour and travel guides | 1 | 1 |
Tour and travel guides | 1 | 1 |
Tour guides and escorts | 1 | 1 |
Sales and related occupations | 8 | 5 |
Office and administrative support occupations | 4 | 2 |
Farming, fishing, and forestry occupations | 4 | 2 |
Forest, conservation, and logging workers | 2 | 1 |
Logging workers | 2 | 1 |
Fallers | 2 | 1 |
Construction and extraction occupations | 41 | 25 |
Supervisors of construction and extraction workers | 3 | 2 |
First-line supervisors of construction trades and extraction workers | 3 | 2 |
First-line supervisors of construction trades and extraction workers | 3 | 2 |
Construction trades workers | 34 | 21 |
Carpenters | 4 | 2 |
Carpenters | 4 | 2 |
Construction laborers | 16 | 10 |
Construction laborers | 16 | 10 |
Construction equipment operators | 3 | 2 |
Electricians | 2 | 1 |
Electricians | 2 | 1 |
Roofers | 5 | 3 |
Roofers | 5 | 3 |
Extraction workers | 2 | 1 |
Surface mining machine operators and earth drillers | 1 | 1 |
Earth drillers, except oil and gas | 1 | 1 |
Helpers--extraction workers | 1 | 1 |
Helpers--extraction workers | 1 | 1 |
Installation, maintenance, and repair occupations | 12 | 7 |
Electrical and electronic equipment mechanics, installers, and repairers | 1 | 1 |
Radio and telecommunications equipment installers and repairers | 1 | 1 |
Telecommunications equipment installers and repairers, except line installers | 1 | 1 |
Vehicle and mobile equipment mechanics, installers, and repairers | 7 | 4 |
Automotive technicians and repairers | 6 | 4 |
Bus and truck mechanics and diesel engine specialists | 1 | 1 |
Bus and truck mechanics and diesel engine specialists | 1 | 1 |
Other installation, maintenance, and repair occupations | 4 | 2 |
Heating, air conditioning, and refrigeration mechanics and installers | 1 | 1 |
Heating, air conditioning, and refrigeration mechanics and installers | 1 | 1 |
Production occupations | 12 | 7 |
Metal workers and plastic workers | 7 | 4 |
Other production occupations | 3 | 2 |
Painting workers | 1 | 1 |
Transportation and material moving occupations | 41 | 25 |
Supervisors of transportation and material moving workers | 4 | 2 |
First-line supervisors of transportation and material moving workers | 4 | 2 |
First-line supervisors of passenger attendants | 1 | 1 |
Air transportation workers | 1 | 1 |
Aircraft pilots and flight engineers | 1 | 1 |
Commercial pilots | 1 | 1 |
Motor vehicle operators | 21 | 13 |
Material moving workers | 15 | 9 |
Footnotes: | ||
NOTE: Data for all years are revised and final. Totals for major categories may include subcategories not shown separately. Dashes indicate no data reported or data that do not meet publication criteria. CFOI fatal injury counts exclude illness-related deaths unless precipitated by an injury event. | ||
| Demographic | Number | Percentage (%) |
|---|---|---|
Total | 164 | 100 |
Employee status | ||
Wage and salary workers (1) | 134 | 82 |
Self-employed (2) | 30 | 18 |
Sex | ||
Male | 149 | 91 |
Female | 15 | 9 |
Age (3) | ||
Under 16 years | -- | -- |
16 to 17 years | 1 | 1 |
18 to 19 years | 1 | 1 |
20 to 24 years | 14 | 9 |
25 to 34 years | 27 | 16 |
35 to 44 years | 34 | 21 |
45 to 54 years | 40 | 24 |
55 to 64 years | 31 | 19 |
65 years and over | 16 | 10 |
Race or ethnic origin (4) | ||
White, non-Hispanic | 105 | 64 |
Black or African-American, non-Hispanic | 22 | 13 |
Hispanic or Latino | 34 | 21 |
American Indian or Alaska Native, non-Hispanic | -- | -- |
Asian, non-Hispanic | -- | -- |
Native Hawaiian or Pacific Islander, non-Hispanic | -- | -- |
Footnotes: | ||
NOTE: Data for all years are revised and final. Totals for major categories may include subcategories not shown separately. Dashes indicate no data reported or data that do not meet publication criteria. CFOI fatal injury counts exclude illness-related deaths unless precipitated by an injury event. | ||
Last Modified Date: Thursday, March 20, 2025