An official website of the United States government
An official website of the United States government
The .gov means it's official.
Federal government websites often end in .gov or .mil. Before sharing sensitive information,
make sure you're on a federal government site.
The site is secure.
The
https:// ensures that you are connecting to the official website and that any
information you provide is encrypted and transmitted securely.
26-455-ATL
Friday, March 13, 2026
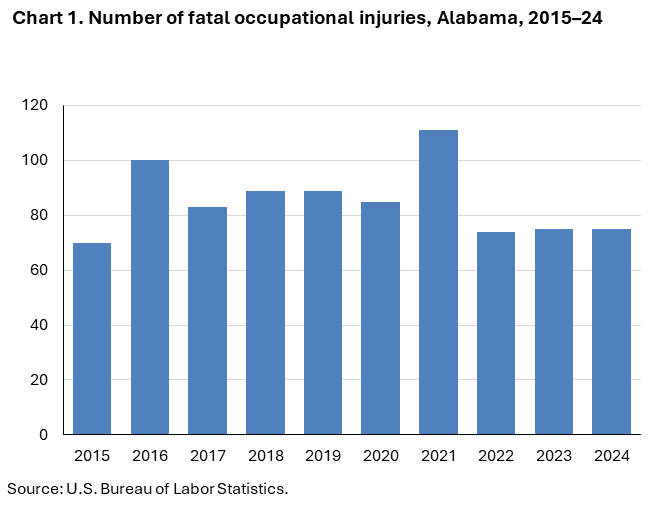
Fatal work injuries totaled 75 in 2024 for Alabama, the U.S. Bureau of Labor Statistics reported today. Regional Commissioner Victoria G. Lee noted that the number of work-related fatalities in Alabama was unchanged from the previous year. (See chart 1.) The fatal work injury rate was 3.6 fatalities per 100,000 full-time equivalent (FTE) workers in 2024, as it was in 2023. Nationwide, a total of 5,070 fatal work injuries were recorded in 2024, a 4.0-percent decrease from 5,283 in 2023. These data are from the Census of Fatal Occupational Injuries (CFOI).
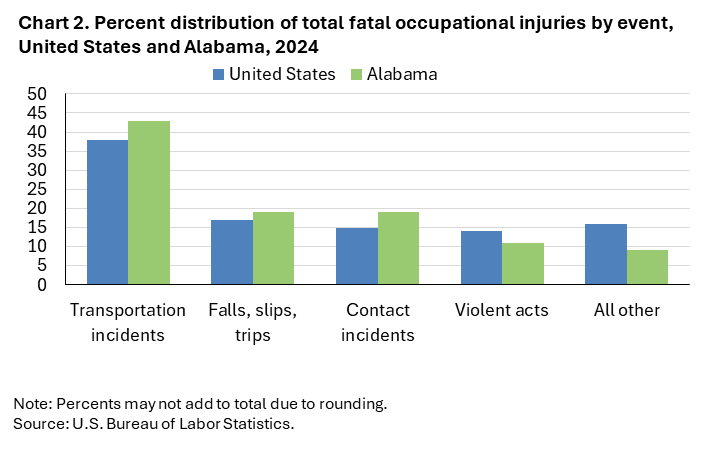
Transportation incidents (32) were the most frequent type of fatal event in Alabama, accounting for 43 percent of all fatal work injuries in the state. Nationally the share was 38 percent. Worker deaths from transportation incidents were down from 34 over the year (See chart 2 and table 1.)
Falls, slips, and trips and contact incidents each accounted for 14 fatal events (19 percent) among Alabama worker fatalities; nationally the share was 17 percent and 15 percent, respectively.
The transportation and warehousing sector had the highest number of fatalities with 22, down from 24 the previous year. (See table 2.)
Fatal transportation incidents resulted in 17 of the 22 transportation and warehousing sector fatalities.
The truck transportation subsector accounted for 15 of the sector’s fatal workplace injuries.
Installation, maintenance, and repair workers experienced the largest increase (6) in fatal work injuries over the year among the major occupational groups. (See table 3.)
The transportation and material moving occupational group had the highest number of fatal workplace injuries with 25. Transportation incidents resulted in 20 fatalities among these workers. Heavy and tractor-trailer truck drivers accounted for 18 of the major group’s 25 fatal workplace injuries.
Wage and salary workers accounted for 85 percent of fatal workplace injuries in Alabama; the self-employed comprised the remaining 15 percent. (See chart 1 and table 4.) Transportation incidents accounted for 44 percent of fatalities among wage and salary workers and 36 percent among the self-employed.
Males accounted for 96 percent of the work-related fatalities in Alabama and 92 percent nationally.
Fatalities among non-Hispanic Black or African American workers accounted for 31 percent of those who died from a workplace injury. Nationwide, this group accounted for 12 percent of work-related deaths.
Workers 35-44 years old had a decrease in worker fatalities from 21 in 2023 to 13 in 2024.
Background of the program. The Census of Fatal Occupational Injuries (CFOI), part of the Bureau of Labor Statistics (BLS) Occupational Safety and Health Statistics (OSHS) program, is a count of all fatalities resulting from workplace injuries occurring in the U.S. during the calendar year. For technical information and definitions for the CFOI, see the national CFOI release Technical notes, the BLS Handbook of Methods, and the CFOI definitions.
Acknowledgments. BLS thanks the Alabama Department of Labor for their efforts in collecting accurate, comprehensive, and useful data on fatal work injuries. BLS also appreciates the efforts of all federal, state, local, and private sector entities that provided source documents used to identify fatal work injuries nationally. See the national CFOI release Technical Notes for details on cooperating entities.
If you are deaf, hard of hearing, or have a speech disability, please dial 7-1-1 to access telecommunications relay services.
| Event or Exposure (1) | 2023 | 2024 | |
|---|---|---|---|
| Number | Number | Percent (%) | |
|
All events and exposures |
75 | 75 | 100 |
|
Violent acts |
7 | 8 | 11 |
|
Transportation incidents |
34 | 32 | 43 |
|
Rail vehicle incidents |
-- | 3 | 4 |
|
Rail vehicle collisions |
-- | 3 | 4 |
|
Roadway incidents involving motorized land vehicle |
24 | 20 | 27 |
|
Roadway collision with other vehicle(s) |
13 | 5 | 7 |
|
Roadway collision with object other than vehicle |
8 | 11 | 15 |
|
Collision with object or animal on side of roadway |
-- | 11 | 15 |
|
Roadway noncollision incident |
3 | 4 | 5 |
|
Roadway noncollision- vehicle overturn |
3 | 4 | 5 |
|
Nonroadway incidents involving motorized land vehicles |
4 | 3 | 4 |
|
Nonroadway noncollision incident |
-- | 3 | 4 |
|
Explosions and fires |
-- | -- | -- |
|
Falls, slips, trips |
13 | 14 | 19 |
|
Fall to lower level |
13 | 10 | 13 |
|
Other fall to lower level |
-- | 6 | 8 |
|
Slip, trip, stumble or fall on same level |
-- | 4 | 5 |
|
Fall on same level |
-- | 4 | 5 |
|
Exposure to harmful substances, environments |
3 | -- | -- |
|
Contact incidents |
16 | 14 | 19 |
|
Struck by propelled, falling, or suspended object |
10 | 10 | 13 |
|
Struck by falling object |
-- | 7 | 9 |
|
Struck, caught, or compressed by running powered equipment |
5 | 4 | 5 |
|
Overexertion, repetitive motion, and bodily condition |
-- | -- | -- |
|
Footnotes: |
|||
|
Note: The Census of Fatal Occupational Injuries (CFOI) has published data on fatal occupational injuries for the United States since 1992. During this time, the classification systems and definitions of many data elements have changed. See the CFOI Definitions page (www.bls.gov/iif/definitions/census-of-fatal-occupational-injuries-definitions.htm) for a more detailed description of each data element. Data for all years are revised and final. Totals for major categories may include subcategories not shown separately. Dashes indicate no data reported or data that do not meet publication criteria. CFOI fatal injury counts exclude illness-related deaths unless precipitated by an injury event. |
|||
| Industry | 2023 | 2024 | |
|---|---|---|---|
| Number | Number | Percent (%) | |
|
Total |
75 | 75 | 100 |
|
Private industry (1) |
69 | 70 | 93 |
|
Natural resources and mining |
-- | -- | -- |
|
Agriculture, forestry, fishing and hunting |
4 | 3 | 4 |
|
Construction |
15 | 14 | 19 |
|
Construction |
15 | 14 | 19 |
|
Heavy and civil engineering construction |
-- | 3 | 4 |
|
Specialty trade contractors |
5 | 9 | 12 |
|
Foundation, structure, and building exterior contractors |
-- | 4 | 5 |
|
Other specialty trade contractors |
-- | 3 | 4 |
|
Manufacturing |
9 | 7 | 9 |
|
Manufacturing |
9 | 7 | 9 |
|
Trade, transportation, and utilities |
-- | 28 | 37 |
|
Wholesale trade |
-- | 3 | 4 |
|
Merchant wholesalers, durable goods |
-- | 3 | 4 |
|
Transportation and warehousing |
24 | 22 | 29 |
|
Truck transportation |
20 | 15 | 20 |
|
General freight trucking |
14 | 5 | 7 |
|
Specialized freight trucking |
3 | 7 | 9 |
|
Support activities for transportation |
-- | 4 | 5 |
|
Information |
-- | -- | -- |
|
Financial activities |
-- | -- | -- |
|
Professional and business services |
3 | 8 | 11 |
|
Administrative and support and waste management and remediation services |
3 | 8 | 11 |
|
Educational and health services |
-- | -- | -- |
|
Leisure and hospitality |
-- | -- | -- |
|
Other services (except public administration) |
6 | 5 | 7 |
|
Other services (except public administration) |
6 | 5 | 7 |
|
Government (2) |
6 | 5 | 7 |
|
Federal government |
-- | -- | -- |
|
State government |
-- | -- | -- |
|
Local government |
4 | -- | -- |
|
Footnotes: |
|||
|
Note: The Census of Fatal Occupational Injuries (CFOI) has published data on fatal occupational injuries for the United States since 1992. During this time, the classification systems and definitions of many data elements have changed. See the CFOI Definitions page (www.bls.gov/iif/definitions/census-of-fatal-occupational-injuries-definitions.htm) for a more detailed description of each data element. Data for all years are revised and final. Totals for major categories may include subcategories not shown separately. Dashes indicate no data reported or data that do not meet publication criteria. CFOI fatal injury counts exclude illness-related deaths unless precipitated by an injury event. |
|||
| Occupation (1) | 2023 | 2024 | |
|---|---|---|---|
| Number | Number | Percent (%) | |
|
All occupations |
75 | 75 | 100 |
|
Management occupations |
-- | -- | -- |
|
Business and financial operations occupations |
-- | -- | -- |
|
Computer and mathematical occupations |
-- | -- | -- |
|
Architecture and engineering occupations |
-- | -- | -- |
|
Life, physical, and social science occupations |
-- | -- | -- |
|
Community and social service occupations |
-- | -- | -- |
|
Legal occupations |
-- | -- | -- |
|
Educational instruction and library occupations |
-- | -- | -- |
|
Arts, design, entertainment, sports, and media occupations |
-- | -- | -- |
|
Healthcare practitioners and technical occupations |
-- | -- | -- |
|
Healthcare support occupations |
-- | -- | -- |
|
Protective service occupations |
-- | -- | -- |
|
Food preparation and serving related occupations |
-- | -- | -- |
|
Building and grounds cleaning and maintenance occupations |
-- | 7 | 9 |
|
Personal care and service occupations |
-- | -- | -- |
|
Sales and related occupations |
3 | -- | -- |
|
Office and administrative support occupations |
-- | -- | -- |
|
Farming, fishing, and forestry occupations |
4 | -- | -- |
|
Construction and extraction occupations |
15 | 16 | 21 |
|
Construction trades workers |
15 | 12 | 16 |
|
Construction laborers |
8 | 5 | 7 |
|
Construction laborers |
8 | 5 | 7 |
|
Installation, maintenance, and repair occupations |
5 | 11 | 15 |
|
Vehicle and mobile equipment mechanics, installers, and repairers |
-- | 3 | 4 |
|
Other installation, maintenance, and repair occupations |
-- | 8 | 11 |
|
Production occupations |
7 | 3 | 4 |
|
Transportation and material moving occupations |
29 | 25 | 33 |
|
Motor vehicle operators |
21 | 20 | 27 |
|
Driver/sales workers and truck drivers |
-- | 20 | 27 |
|
Heavy and tractor-trailer truck drivers |
-- | 18 | 24 |
|
Material moving workers |
5 | 3 | 4 |
|
Footnotes: |
|||
|
Note: The Census of Fatal Occupational Injuries (CFOI) has published data on fatal occupational injuries for the United States since 1992. During this time, the classification systems and definitions of many data elements have changed. See the CFOI Definitions page (www.bls.gov/iif/definitions/census-of-fatal-occupational-injuries-definitions.htm) for a more detailed description of each data element. Data for all years are revised and final. Totals for major categories may include subcategories not shown separately. Dashes indicate no data reported or data that do not meet publication criteria. CFOI fatal injury counts exclude illness-related deaths unless precipitated by an injury event. |
|||
| Demographic | 2023 | 2024 | |
|---|---|---|---|
| Number | Number | Percent (%) | |
|
Total |
75 | 75 | 100 |
|
Employee status |
|||
|
Wage and salary workers (1) |
67 | 64 | 85 |
|
Self-employed (2) |
8 | 11 | 15 |
|
Sex |
|||
|
Male |
68 | 72 | 96 |
|
Female |
7 | 3 | 4 |
|
Age (3) |
|||
|
Under 16 years |
-- | -- | -- |
|
16 to 17 years |
-- | -- | -- |
|
18 to 19 years |
-- | -- | -- |
|
20 to 24 years |
4 | -- | -- |
|
25 to 34 years |
14 | 15 | 20 |
|
35 to 44 years |
21 | 13 | 17 |
|
45 to 54 years |
14 | 14 | 19 |
|
55 to 64 years |
14 | 17 | 23 |
|
65 years and over |
8 | 11 | 15 |
|
Race or ethnic origin (4) |
|||
|
White, non-Hispanic |
46 | 40 | 53 |
|
Black or African-American, non-Hispanic |
22 | 23 | 31 |
|
Hispanic or Latino |
-- | 10 | 13 |
|
American Indian or Alaska Native, non-Hispanic |
-- | -- | -- |
|
Asian, non-Hispanic |
-- | -- | -- |
|
Native Hawaiian or Pacific Islander, non-Hispanic |
-- | -- | -- |
|
Person of multiple races, non-Hispanic |
-- | -- | -- |
|
Other or not reported, non-Hispanic |
-- | -- | -- |
|
Footnotes: |
|||
|
Note: The Census of Fatal Occupational Injuries (CFOI) has published data on fatal occupational injuries for the United States since 1992. During this time, the classification systems and definitions of many data elements have changed. See the CFOI Definitions page (www.bls.gov/iif/definitions/census-of-fatal-occupational-injuries-definitions.htm) for a more detailed description of each data element. Data for all years are revised and final. Totals for major categories may include subcategories not shown separately. Dashes indicate no data reported or data that do not meet publication criteria. CFOI fatal injury counts exclude illness-related deaths unless precipitated by an injury event. |
|||
Last Modified Date: Friday, March 13, 2026