An official website of the United States government
An official website of the United States government
The .gov means it's official.
Federal government websites often end in .gov or .mil. Before sharing sensitive information,
make sure you're on a federal government site.
The site is secure.
The
https:// ensures that you are connecting to the official website and that any
information you provide is encrypted and transmitted securely.
26-456-ATL
Friday, March 13, 2026
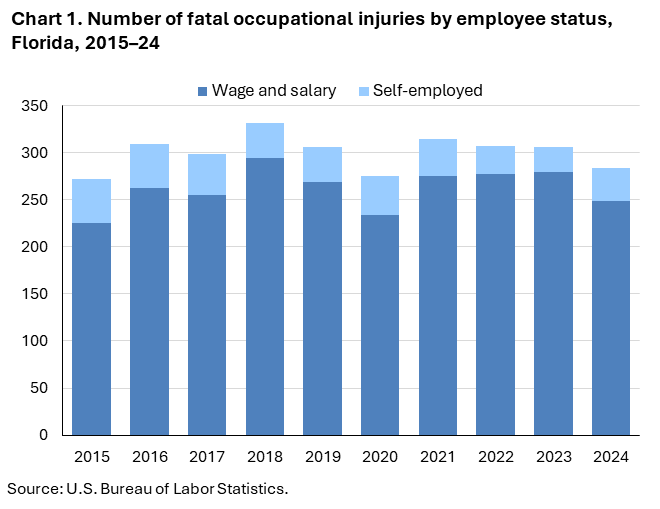
Fatal work injuries totaled 284 in 2024 for Florida, the U.S. Bureau of Labor Statistics reported today. Regional Commissioner Victoria G. Lee noted that the number of work-related fatalities in Florida was down 7.2 percent from 306 in 2023. (See chart 1.) The fatal work injury rate was 2.9 fatalities per 100,000 full-time equivalent (FTE) workers in 2024, a decrease from a rate of 3.1 in 2023. Nationwide, a total of 5,070 fatal work injuries were recorded in 2024, a 4.0-percent decrease from 5,283 in 2023. These data are from the Census of Fatal Occupational Injuries (CFOI).
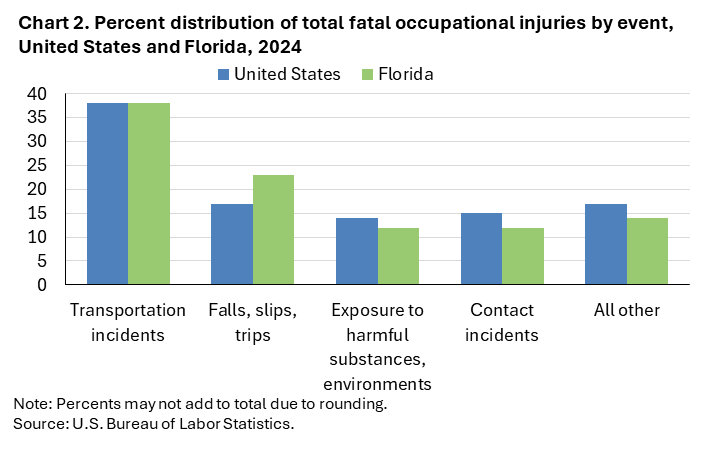
Transportation incidents (109) were the most frequent type of fatal event in Florida, accounting for 38 percent of all fatal work injuries in the state. Nationally the share was also 38 percent. Worker deaths from transportation incidents were up from 104 over the year (See chart 2 and table 1.)
Falls, slips, and trips (66) accounted for 23 percent of Florida worker fatalities; nationally the share was 17 percent.
The construction sector had the highest number of fatalities with 88, down from 92 the previous year. (See table 2.)
Fatal falls, slips, and trips resulted in 39 of the 88 construction sector fatalities.
The foundation, structure, and building exterior contractors industry group accounted for 22 of the sector’s fatal workplace injuries.
Transportation and material moving workers experienced the largest decrease (-9) in fatal work injuries over the year among the major occupational groups. (See table 3.)
The construction and extraction occupational group had the highest number of fatal workplace injuries with 82. Incidents involving falls, slips, and trips resulted in 34 fatalities among these workers. Construction laborers accounted for 18 of the major group’s 82 fatal workplace injuries.
Wage and salary workers accounted for 88 percent of fatal workplace injuries in Florida; the self-employed comprised the remaining 12 percent. (See chart 1 and table 4.) The most frequent fatal event for both wage and salary workers as well as self-employed workers was transportation incidents.
Fatal workplace injuries among female workers decreased from 27 to 16, with transportation incidents accounting for 50 percent of fatal events in 2024.
Hispanic or Latino workers accounted for 42 percent of those who died from a workplace injury. Nationwide, this group accounted for 24 percent of work-related deaths. White non-Hispanics accounted for 35 percent of work-related fatalities in Florida, compared to 56 percent nationally.
Workers 45-54 years old had a decrease in worker fatalities from 66 in 2023 to 53 in 2024.
Background of the program. The Census of Fatal Occupational Injuries (CFOI), part of the Bureau of Labor Statistics (BLS) Occupational Safety and Health Statistics (OSHS) program, is a count of all fatalities resulting from workplace injuries occurring in the U.S. during the calendar year. For technical information and definitions for the CFOI, see the national CFOI release Technical notes, the BLS Handbook of Methods, and the CFOI definitions.
Acknowledgments. BLS appreciates the efforts of all federal, state, local, and private sector entities that provided source documents used to identify fatal work injuries nationally. See the national CFOI release Technical Notes for details on cooperating entities.
If you are deaf, hard of hearing, or have a speech disability, please dial 7-1-1 to access telecommunications relay services.
| Event or Exposure (1) | 2023 | 2024 | |
|---|---|---|---|
| Number | Number | Percent (%) | |
|
All events and exposures |
306 | 284 | 100 |
|
Violent acts |
33 | 33 | 12 |
|
Homicides (violent acts by other person) |
20 | 27 | 10 |
|
Shooting by other person |
13 | 22 | 8 |
|
Suicides (intentional self-harm) |
13 | 6 | 2 |
|
Transportation incidents |
104 | 109 | 38 |
|
Aircraft incidents |
9 | 5 | 2 |
|
Pedestrian incidents involving motorized land vehicles |
16 | 30 | 11 |
|
Pedestrian struck by vehicle in road work zone |
4 | 5 | 2 |
|
Pedestrian struck by vehicle in roadway |
6 | 18 | 6 |
|
Pedestrian struck by forward-moving vehicle in roadway |
6 | 13 | 5 |
|
Pedestrian struck by vehicle backing up in roadway |
-- | 1 | 0 |
|
Pedestrian struck by vehicle in nonroadway area |
5 | 7 | 2 |
|
Pedestrian struck by vehicle or object propelled by another vehicle in nonroadway area |
-- | 1 | 0 |
|
Pedestrian struck by forward-moving vehicle in nonroadway area |
2 | 1 | 0 |
|
Roadway incidents involving motorized land vehicle |
66 | 57 | 20 |
|
Roadway collision with other vehicle(s) |
34 | 37 | 13 |
|
Roadway collision with other vehicle(s)-intersecting, turning |
13 | 10 | 4 |
|
Roadway collision with other vehicle(s)-moving in same direction |
13 | 4 | 1 |
|
Roadway collision with other vehicle(s)-moving in opposite directions, oncoming |
5 | 17 | 6 |
|
Roadway collision with other vehicle(s)-moving and standing vehicle |
3 | 6 | 2 |
|
Roadway collision with object other than vehicle |
25 | 14 | 5 |
|
Collision with object or animal on side of roadway |
20 | 14 | 5 |
|
Roadway noncollision incident |
7 | 5 | 2 |
|
Roadway noncollision- vehicle overturn |
4 | 3 | 1 |
|
Nonroadway incidents involving motorized land vehicles |
11 | 13 | 5 |
|
Explosions and fires |
4 | -- | -- |
|
Falls, slips, trips |
68 | 66 | 23 |
|
Fall to lower level |
60 | 55 | 19 |
|
Fall to lower level resulting from exposure or contact |
1 | 1 | 0 |
|
Fall to lower level resulting from exposure or contact- more than 30 feet |
-- | 1 | 0 |
|
Other fall to lower level |
52 | 50 | 18 |
|
Other fall to lower level- 6 to 30 feet |
30 | 30 | 11 |
|
Other fall to lower level- more than 30 feet |
10 | 8 | 3 |
|
Slip, trip, stumble or fall on same level |
6 | 9 | 3 |
|
Fall on same level |
5 | 9 | 3 |
|
Fall on same level due to slip or trip |
-- | 4 | 1 |
|
Exposure to harmful substances, environments |
60 | 35 | 12 |
|
Exposure to electricity |
21 | 20 | 7 |
|
Direct exposure to electricity |
9 | 10 | 4 |
|
Direct exposure to electricity- 220 volts or less |
4 | 7 | 2 |
|
Direct exposure to electricity- greater than 220 volts |
5 | 2 | 1 |
|
Exposure to harmful substances |
30 | 10 | 4 |
|
Drug, alcohol overdose |
28 | 7 | 2 |
|
Contact incidents |
37 | 34 | 12 |
|
Collapse, engulfment |
-- | 3 | 1 |
|
Collapse, engulfment- building or structure |
-- | 3 | 1 |
|
Struck by propelled, falling, or suspended object |
27 | 17 | 6 |
|
Struck by falling object |
23 | 13 | 5 |
|
Struck, caught, or compressed by running powered equipment |
4 | 10 | 4 |
|
Caught or entangled in running powered equipment |
-- | 3 | 1 |
|
Struck by rolling powered vehicle or machinery |
1 | 4 | 1 |
|
Contact with non-running objects or equipment |
-- | 2 | 1 |
|
Struck by rolling, sliding, or shifting objects-non-running |
-- | 2 | 1 |
|
Overexertion, repetitive motion, and bodily condition |
-- | -- | -- |
|
Footnotes: |
|||
|
Note: The Census of Fatal Occupational Injuries (CFOI) has published data on fatal occupational injuries for the United States since 1992. During this time, the classification systems and definitions of many data elements have changed. See the CFOI Definitions page (www.bls.gov/iif/definitions/census-of-fatal-occupational-injuries-definitions.htm) for a more detailed description of each data element. Data for all years are revised and final. Totals for major categories may include subcategories not shown separately. Dashes indicate no data reported or data that do not meet publication criteria. CFOI fatal injury counts exclude illness-related deaths unless precipitated by an injury event. |
|||
| Industry | 2023 | 2024 | |
|---|---|---|---|
| Number | Number | Percent (%) | |
|
Total |
306 | 284 | 100 |
|
Private industry (1) |
291 | 262 | 92 |
|
Natural resources and mining |
-- | 15 | 5 |
|
Agriculture, forestry, fishing and hunting |
11 | 15 | 5 |
|
Forestry and logging |
-- | 2 | 1 |
|
Logging |
-- | 2 | 1 |
|
Logging |
-- | 2 | 1 |
|
Support activities for agriculture and forestry |
3 | 10 | 4 |
|
Support activities for crop production |
3 | 10 | 4 |
|
Support activities for crop production |
3 | 10 | 4 |
|
Postharvest crop activities (except cotton ginning) |
-- | 1 | 0 |
|
Construction |
92 | 88 | 31 |
|
Construction |
92 | 88 | 31 |
|
Construction of buildings |
6 | 13 | 5 |
|
Residential building construction |
-- | 8 | 3 |
|
Residential building construction |
-- | 8 | 3 |
|
New multifamily housing construction (except for-sale builders) |
-- | 1 | 0 |
|
Residential remodelers |
-- | 7 | 2 |
|
Nonresidential building construction |
3 | 5 | 2 |
|
Industrial building construction |
-- | 1 | 0 |
|
Commercial and institutional building construction |
-- | 4 | 1 |
|
Heavy and civil engineering construction |
16 | 17 | 6 |
|
Highway, street, and bridge construction |
6 | 10 | 4 |
|
Highway, street, and bridge construction |
6 | 10 | 4 |
|
Specialty trade contractors |
66 | 55 | 19 |
|
Foundation, structure, and building exterior contractors |
33 | 22 | 8 |
|
Poured concrete foundation and structure contractors |
2 | 3 | 1 |
|
Residential poured concrete foundation and structure contractors |
2 | 1 | 0 |
|
Nonresidential poured concrete foundation and structure contractors |
-- | 2 | 1 |
|
Structural steel and precast concrete contractors |
2 | 3 | 1 |
|
Nonresidential structural steel and precast concrete contractors |
1 | 1 | 0 |
|
Framing contractors |
3 | 3 | 1 |
|
Residential framing contractors |
2 | 3 | 1 |
|
Masonry contractors |
5 | 3 | 1 |
|
Residential masonry contractors |
-- | 1 | 0 |
|
Nonresidential masonry contractors |
-- | 1 | 0 |
|
Roofing contractors |
19 | 8 | 3 |
|
Residential roofing contractors |
9 | 5 | 2 |
|
Nonresidential roofing contractors |
10 | 3 | 1 |
|
Building equipment contractors |
17 | 11 | 4 |
|
Electrical contractors and other wiring installation contractors |
6 | 5 | 2 |
|
Residential electrical contractors and other wiring installation contractors |
-- | 3 | 1 |
|
Nonresidential electrical contractors and other wiring installation contractors |
-- | 1 | 0 |
|
Plumbing, heating, and air-conditioning contractors |
9 | 5 | 2 |
|
Residential plumbing, heating, and air-conditioning contractors |
4 | 1 | 0 |
|
Nonresidential plumbing, heating, and air-conditioning contractors |
4 | 4 | 1 |
|
Other building equipment contractors |
2 | 1 | 0 |
|
Other nonresidential building equipment contractors |
1 | 1 | 0 |
|
Building finishing contractors |
11 | 12 | 4 |
|
Drywall and insulation contractors |
1 | 4 | 1 |
|
Painting and wall covering contractors |
7 | 5 | 2 |
|
Residential painting and wall covering contractors |
-- | 3 | 1 |
|
Nonresidential painting and wall covering contractors |
-- | 2 | 1 |
|
Other specialty trade contractors |
5 | 9 | 3 |
|
Manufacturing |
15 | 10 | 4 |
|
Manufacturing |
15 | 10 | 4 |
|
Petroleum and coal products manufacturing |
-- | 1 | 0 |
|
Petroleum and coal products manufacturing |
-- | 1 | 0 |
|
Asphalt paving, roofing, and saturated materials manufacturing |
-- | 1 | 0 |
|
Chemical manufacturing |
-- | 4 | 1 |
|
Basic chemical manufacturing |
-- | 1 | 0 |
|
Nonmetallic mineral product manufacturing |
5 | 2 | 1 |
|
Cement and concrete product manufacturing |
3 | 2 | 1 |
|
Ready-mix concrete manufacturing |
-- | 1 | 0 |
|
Other concrete product manufacturing |
-- | 1 | 0 |
|
Trade, transportation, and utilities |
73 | -- | -- |
|
Wholesale trade |
12 | 10 | 4 |
|
Retail trade |
14 | 15 | 5 |
|
Motor vehicle and parts dealers |
-- | 5 | 2 |
|
Other motor vehicle dealers |
-- | 3 | 1 |
|
Motorcycle, boat, and other motor vehicle dealers |
-- | 3 | 1 |
|
Boat dealers |
-- | 2 | 1 |
|
Automotive parts, accessories, and tire retailers |
-- | 2 | 1 |
|
Automotive parts and accessories retailers |
-- | 1 | 0 |
|
Tire dealers |
-- | 1 | 0 |
|
Building material and garden equipment and supplies dealers |
-- | 2 | 1 |
|
Building material and supplies dealers |
-- | 2 | 1 |
|
Home centers |
-- | 1 | 0 |
|
Other building material dealers |
-- | 1 | 0 |
|
Food and beverage retailers |
4 | 3 | 1 |
|
Health and personal care retailers |
-- | 2 | 1 |
|
Health and personal care retailers |
-- | 2 | 1 |
|
Gasoline stations and fuel dealers |
3 | 2 | 1 |
|
Gasoline stations |
3 | 2 | 1 |
|
Clothing, clothing accessories, shoe, and jewelry retailers |
-- | 1 | 0 |
|
Jewelry, luggage, and leather goods retailers |
-- | 1 | 0 |
|
Transportation and warehousing |
46 | 37 | 13 |
|
Truck transportation |
32 | 25 | 9 |
|
General freight trucking |
23 | 14 | 5 |
|
General freight trucking, long-distance |
9 | 5 | 2 |
|
General freight trucking, long-distance, less than truckload |
-- | 1 | 0 |
|
Specialized freight trucking |
9 | 11 | 4 |
|
Specialized freight (except used goods) trucking, local |
-- | 8 | 3 |
|
Support activities for transportation |
7 | 8 | 3 |
|
Support activities for road transportation |
5 | 4 | 1 |
|
Information |
3 | -- | -- |
|
Financial activities |
-- | 2 | 1 |
|
Real estate and rental and leasing |
9 | 2 | 1 |
|
Real estate |
4 | 1 | 0 |
|
Lessors of real estate |
-- | 1 | 0 |
|
Lessors of nonresidential buildings (except miniwarehouses) |
-- | 1 | 0 |
|
Rental and leasing services |
5 | 1 | 0 |
|
Consumer goods rental |
-- | 1 | 0 |
|
Other consumer goods rental |
-- | 1 | 0 |
|
Professional and business services |
42 | 49 | 17 |
|
Administrative and support and waste management and remediation services |
37 | 47 | 17 |
|
Administrative and support services |
34 | 38 | 13 |
|
Investigation and security services |
3 | 6 | 2 |
|
Investigation, guard, and armored car services |
-- | 6 | 2 |
|
Security guards and patrol services |
-- | 6 | 2 |
|
Services to buildings and dwellings |
27 | 29 | 10 |
|
Landscaping services |
22 | 26 | 9 |
|
Waste management and remediation services |
3 | 9 | 3 |
|
Remediation and other waste management services |
-- | 4 | 1 |
|
Remediation services |
-- | 1 | 0 |
|
Educational and health services |
-- | -- | -- |
|
Educational services |
8 | 3 | 1 |
|
Educational services |
8 | 3 | 1 |
|
Technical and trade schools |
7 | 3 | 1 |
|
Technical and trade schools |
7 | 3 | 1 |
|
Flight training |
-- | 3 | 1 |
|
Leisure and hospitality |
16 | 16 | 6 |
|
Arts, entertainment, and recreation |
3 | 5 | 2 |
|
Performing arts, spectator sports, and related industries |
-- | 1 | 0 |
|
Spectator sports |
-- | 1 | 0 |
|
Spectator sports |
-- | 1 | 0 |
|
Amusement, gambling, and recreation industries |
-- | 4 | 1 |
|
Accommodation and food services |
13 | 11 | 4 |
|
Other services (except public administration) |
18 | 12 | 4 |
|
Other services (except public administration) |
18 | 12 | 4 |
|
Repair and maintenance |
12 | 9 | 3 |
|
Automotive repair and maintenance |
7 | 5 | 2 |
|
Government (2) |
15 | 22 | 8 |
|
Federal government |
-- | -- | -- |
|
State government |
-- | 5 | 2 |
|
Local government |
9 | 15 | 5 |
|
Footnotes: |
|||
|
Note: The Census of Fatal Occupational Injuries (CFOI) has published data on fatal occupational injuries for the United States since 1992. During this time, the classification systems and definitions of many data elements have changed. See the CFOI Definitions page (www.bls.gov/iif/definitions/census-of-fatal-occupational-injuries-definitions.htm) for a more detailed description of each data element. Data for all years are revised and final. Totals for major categories may include subcategories not shown separately. Dashes indicate no data reported or data that do not meet publication criteria. CFOI fatal injury counts exclude illness-related deaths unless precipitated by an injury event. |
|||
| Occupation (1) | 2023 | 2024 | |
|---|---|---|---|
| Number | Number | Percent (%) | |
|
All occupations |
306 | 284 | 100 |
|
Management occupations |
5 | 5 | 2 |
|
Other management occupations |
-- | 4 | 1 |
|
Business and financial operations occupations |
-- | -- | -- |
|
Computer and mathematical occupations |
-- | -- | -- |
|
Architecture and engineering occupations |
3 | -- | -- |
|
Life, physical, and social science occupations |
-- | -- | -- |
|
Community and social service occupations |
-- | -- | -- |
|
Legal occupations |
-- | -- | -- |
|
Educational instruction and library occupations |
-- | -- | -- |
|
Arts, design, entertainment, sports, and media occupations |
4 | 2 | 1 |
|
Entertainers and performers, sports and related workers |
1 | 1 | 0 |
|
Athletes, coaches, umpires, and related workers |
1 | 1 | 0 |
|
Media and communication equipment workers |
-- | 1 | 0 |
|
Healthcare practitioners and technical occupations |
3 | -- | -- |
|
Healthcare support occupations |
-- | -- | -- |
|
Protective service occupations |
12 | 14 | 5 |
|
Other protective service workers |
6 | 7 | 2 |
|
Security guards and gambling surveillance officers |
4 | 7 | 2 |
|
Security guards |
4 | 7 | 2 |
|
Food preparation and serving related occupations |
8 | 7 | 2 |
|
Cooks and food preparation workers |
4 | 4 | 1 |
|
Building and grounds cleaning and maintenance occupations |
32 | 30 | 11 |
|
Grounds maintenance workers |
22 | 26 | 9 |
|
Grounds maintenance workers |
22 | 26 | 9 |
|
Landscaping and groundskeeping workers |
-- | 16 | 6 |
|
Tree trimmers and pruners |
-- | 10 | 4 |
|
Personal care and service occupations |
5 | -- | -- |
|
Sales and related occupations |
13 | 9 | 3 |
|
Supervisors of sales workers |
-- | 3 | 1 |
|
First-line supervisors of sales workers |
-- | 3 | 1 |
|
First-line supervisors of retail sales workers |
-- | 3 | 1 |
|
Retail sales workers |
9 | 5 | 2 |
|
Sales representatives, wholesale and manufacturing |
-- | 1 | 0 |
|
Sales representatives, wholesale and manufacturing |
-- | 1 | 0 |
|
Sales representatives, wholesale and manufacturing, technical and scientific products |
-- | 1 | 0 |
|
Office and administrative support occupations |
-- | -- | -- |
|
Farming, fishing, and forestry occupations |
10 | 11 | 4 |
|
Agricultural workers |
5 | 11 | 4 |
|
Agricultural inspectors |
-- | 1 | 0 |
|
Agricultural inspectors |
-- | 1 | 0 |
|
Miscellaneous agricultural workers |
5 | 10 | 4 |
|
Construction and extraction occupations |
81 | 82 | 29 |
|
Supervisors of construction and extraction workers |
6 | 10 | 4 |
|
First-line supervisors of construction trades and extraction workers |
6 | 10 | 4 |
|
First-line supervisors of construction trades and extraction workers |
6 | 10 | 4 |
|
Construction trades workers |
70 | 68 | 24 |
|
Carpenters |
6 | 10 | 4 |
|
Carpenters |
6 | 10 | 4 |
|
Construction laborers |
15 | 18 | 6 |
|
Construction laborers |
15 | 18 | 6 |
|
Construction equipment operators |
-- | 8 | 3 |
|
Paving, surfacing, and tamping equipment operators |
-- | 3 | 1 |
|
Operating engineers and other construction equipment operators |
-- | 5 | 2 |
|
Drywall installers, ceiling tile installers, and tapers |
-- | 1 | 0 |
|
Drywall and ceiling tile installers |
-- | 1 | 0 |
|
Electricians |
5 | 8 | 3 |
|
Electricians |
5 | 8 | 3 |
|
Painters and paperhangers |
7 | 5 | 2 |
|
Painters, construction and maintenance |
7 | 5 | 2 |
|
Pipelayers, plumbers, pipefitters, and steamfitters |
5 | 1 | 0 |
|
Plumbers, pipefitters, and steamfitters |
-- | 1 | 0 |
|
Plasterers and stucco masons |
-- | 2 | 1 |
|
Plasterers and stucco masons |
-- | 2 | 1 |
|
Reinforcing iron and rebar workers |
-- | 1 | 0 |
|
Reinforcing iron and rebar workers |
-- | 1 | 0 |
|
Roofers |
17 | 8 | 3 |
|
Roofers |
17 | 8 | 3 |
|
Structural iron and steel workers |
2 | 1 | 0 |
|
Structural iron and steel workers |
2 | 1 | 0 |
|
Other construction and related workers |
-- | 2 | 1 |
|
Elevator and escalator installers and repairers |
-- | 1 | 0 |
|
Elevator and escalator installers and repairers |
-- | 1 | 0 |
|
Installation, maintenance, and repair occupations |
27 | 29 | 10 |
|
Vehicle and mobile equipment mechanics, installers, and repairers |
13 | 14 | 5 |
|
Automotive technicians and repairers |
2 | 5 | 2 |
|
Automotive glass installers and repairers |
-- | 1 | 0 |
|
Automotive service technicians and mechanics |
2 | 4 | 1 |
|
Small engine mechanics |
-- | 3 | 1 |
|
Production occupations |
14 | 10 | 4 |
|
Metal workers and plastic workers |
6 | 2 | 1 |
|
Welding, soldering, and brazing workers |
-- | 2 | 1 |
|
Other production occupations |
3 | 4 | 1 |
|
Miscellaneous production workers |
2 | 2 | 1 |
|
Transportation and material moving occupations |
81 | 72 | 25 |
|
Air transportation workers |
9 | 5 | 2 |
|
Aircraft pilots and flight engineers |
9 | 5 | 2 |
|
Commercial pilots |
8 | 5 | 2 |
|
Motor vehicle operators |
58 | 52 | 18 |
|
Driver/sales workers and truck drivers |
51 | 52 | 18 |
|
Driver/sales workers |
3 | 5 | 2 |
|
Heavy and tractor-trailer truck drivers |
45 | 36 | 13 |
|
Light truck drivers |
3 | 11 | 4 |
|
Material moving workers |
14 | 13 | 5 |
|
Industrial truck and tractor operators |
4 | 1 | 0 |
|
Industrial truck and tractor operators |
4 | 1 | 0 |
|
Laborers and material movers |
7 | 5 | 2 |
|
Cleaners of vehicles and equipment |
-- | 1 | 0 |
|
Laborers and freight, stock, and material movers, hand |
-- | 4 | 1 |
|
Refuse and recyclable material collectors |
1 | 4 | 1 |
|
Refuse and recyclable material collectors |
1 | 4 | 1 |
|
Footnotes: |
|||
|
Note: The Census of Fatal Occupational Injuries (CFOI) has published data on fatal occupational injuries for the United States since 1992. During this time, the classification systems and definitions of many data elements have changed. See the CFOI Definitions page (www.bls.gov/iif/definitions/census-of-fatal-occupational-injuries-definitions.htm) for a more detailed description of each data element. Data for all years are revised and final. Totals for major categories may include subcategories not shown separately. Dashes indicate no data reported or data that do not meet publication criteria. CFOI fatal injury counts exclude illness-related deaths unless precipitated by an injury event. |
|||
| Demographic | 2023 | 2024 | |
|---|---|---|---|
| Number | Number | Percent (%) | |
|
Total |
306 | 284 | 100 |
|
Employee status |
|||
|
Wage and salary workers (1) |
280 | 249 | 88 |
|
Self-employed (2) |
26 | 35 | 12 |
|
Sex |
|||
|
Male |
279 | 268 | 94 |
|
Female |
27 | 16 | 6 |
|
Age (3) |
|||
|
Under 16 years |
-- | -- | -- |
|
16 to 17 years |
-- | -- | -- |
|
18 to 19 years |
7 | -- | -- |
|
20 to 24 years |
24 | -- | -- |
|
25 to 34 years |
48 | 54 | 19 |
|
35 to 44 years |
56 | 54 | 19 |
|
45 to 54 years |
66 | 53 | 19 |
|
55 to 64 years |
59 | 64 | 23 |
|
65 years and over |
45 | 38 | 13 |
|
Race or ethnic origin (4) |
|||
|
White, non-Hispanic |
129 | 100 | 35 |
|
Black or African-American, non-Hispanic |
38 | 58 | 20 |
|
Hispanic or Latino |
130 | 119 | 42 |
|
American Indian or Alaska Native, non-Hispanic |
-- | -- | -- |
|
Asian, non-Hispanic |
4 | 4 | 1 |
|
Native Hawaiian or Pacific Islander, non-Hispanic |
-- | -- | -- |
|
Person of multiple races, non-Hispanic |
-- | -- | -- |
|
Other or not reported, non-Hispanic |
-- | -- | -- |
|
Footnotes: |
|||
|
Note: The Census of Fatal Occupational Injuries (CFOI) has published data on fatal occupational injuries for the United States since 1992. During this time, the classification systems and definitions of many data elements have changed. See the CFOI Definitions page (www.bls.gov/iif/definitions/census-of-fatal-occupational-injuries-definitions.htm) for a more detailed description of each data element. Data for all years are revised and final. Totals for major categories may include subcategories not shown separately. Dashes indicate no data reported or data that do not meet publication criteria. CFOI fatal injury counts exclude illness-related deaths unless precipitated by an injury event. |
|||
Last Modified Date: Friday, March 13, 2026