An official website of the United States government
An official website of the United States government
The .gov means it's official.
Federal government websites often end in .gov or .mil. Before sharing sensitive information,
make sure you're on a federal government site.
The site is secure.
The
https:// ensures that you are connecting to the official website and that any
information you provide is encrypted and transmitted securely.
26-463-ATL
Friday, March 27, 2026
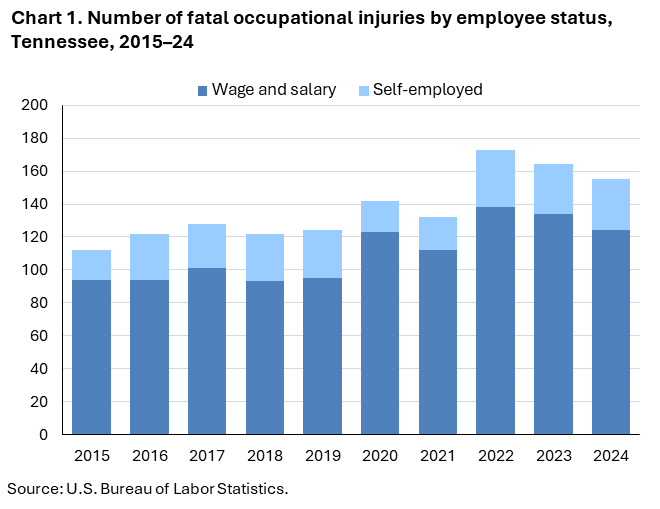
Fatal work injuries totaled 155 in 2024 for Tennessee, the U.S. Bureau of Labor Statistics reported today. Regional Commissioner Victoria G. Lee noted that the number of work-related fatalities in Tennessee was down 5.5 percent from 164 in 2023. (See chart 1.) The fatal work injury rate was 5.1 fatalities per 100,000 full-time equivalent (FTE) workers in 2024, a decrease from a rate of 5.4 in 2023. Nationwide, a total of 5,070 fatal work injuries were recorded in 2024, a 4.0-percent decrease from 5,283 in 2023. These data are from the Census of Fatal Occupational Injuries (CFOI).
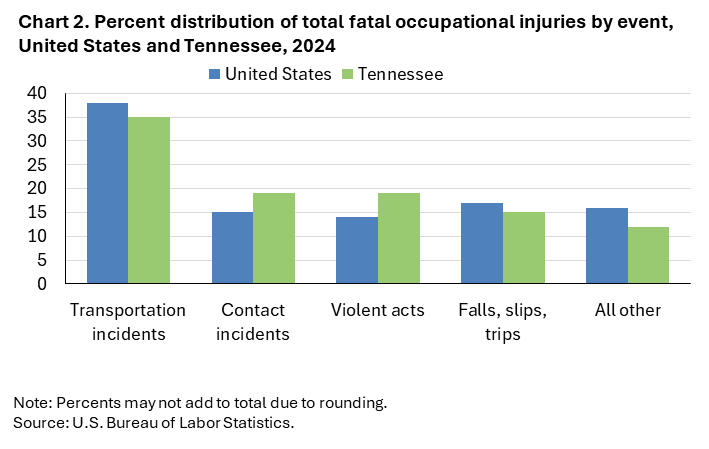
Transportation incidents (55) were the most frequent type of fatal event in Tennessee, accounting for 35 percent of all fatal work injuries in the state. Nationally the share was 38 percent. Worker deaths from transportation incidents were up from 53 over the year. (See chart 2 and table 1.)
Contact incidents (30) and violent acts (29) each accounted for 19 percent of Tennessee worker fatalities; nationally the shares were 15 percent and 14 percent, respectively.
The construction sector had the highest number of fatalities with 29, down from 42 the previous year. (See table 2.)
Transportation incidents and fatal falls, slips, and trips, each accounted for 9 of the 29 construction fatalities.
The specialty trade contractors subsector accounted for 23 of the sector’s fatal workplace injuries.
Construction and extraction workers experienced the largest decrease (-9) in fatal work injuries over the year among the major occupational groups. (See table 3.)
The transportation and material moving occupational group had the highest number of fatal workplace injuries with 44. Transportation incidents resulted in 25 fatalities among these workers. Heavy and tractor-trailer truck drivers accounted for 26 of the major group’s 44 fatal workplace injuries.
Wage and salary workers accounted for 80 percent of fatal workplace injuries in Tennessee; the self-employed comprised the remaining 20 percent. (See chart 1 and table 4.) Transportation incidents were the most frequent fatal event for wage and salary workers and for self-employed workers.
Males accounted for 88 percent of the work-related fatalities in Tennessee and 92 percent nationally.
Fatal injuries among White, non-Hispanic workers decreased from 105 to 81 over the year.
Workers 25-54 years old had a decrease in worker fatalities from 101 in 2023 to 88 in 2024.
Background of the program. The Census of Fatal Occupational Injuries (CFOI), part of the Bureau of Labor Statistics (BLS) Occupational Safety and Health Statistics (OSHS) program, is a count of all fatalities resulting from workplace injuries occurring in the U.S. during the calendar year. For technical information and definitions for the CFOI, see the national CFOI release Technical notes, the BLS Handbook of Methods, and the CFOI definitions.
Acknowledgments. BLS thanks the Tennessee Department of Labor and Workforce Development for their efforts in collecting accurate, comprehensive, and useful data on fatal work injuries. BLS also appreciates the efforts of all federal, state, local, and private sector entities that provided source documents used to identify fatal work injuries nationally. See the national CFOI release Technical Notes for details on cooperating entities.
If you are deaf, hard of hearing, or have a speech disability, please dial 7-1-1 to access telecommunications relay services.
| Event or Exposure (1) | 2023 | 2024 | |
|---|---|---|---|
| Number | Number | Percent (%) | |
|
All events and exposures |
164 | 155 | 100 |
|
Violent acts |
-- | 29 | 19 |
|
Homicides (violent acts by other person) |
-- | 25 | 16 |
|
Shooting by other person |
-- | 21 | 14 |
|
Stabbing, cutting, slashing by other person |
-- | 3 | 2 |
|
Suicides (intentional self-harm) |
-- | 4 | 3 |
|
Intentional self-harm-- shooting |
-- | 4 | 3 |
|
Transportation incidents |
53 | 55 | 35 |
|
Aircraft incidents |
1 | 1 | 1 |
|
In-flight crash, collision |
1 | 1 | 1 |
|
Pedestrian incidents involving motorized land vehicles |
15 | 7 | 5 |
|
Pedestrian struck by vehicle in road work zone |
-- | 2 | 1 |
|
Pedestrian struck by forward-moving vehicle in road work zone |
-- | 2 | 1 |
|
Pedestrian struck by vehicle in nonroadway area |
3 | 5 | 3 |
|
Roadway incidents involving motorized land vehicle |
29 | 39 | 25 |
|
Roadway collision with other vehicle(s) |
16 | 13 | 8 |
|
Roadway collision with other vehicle(s)-moving in same direction |
4 | 4 | 3 |
|
Roadway collision with other vehicle(s)-moving in opposite directions, oncoming |
7 | 7 | 5 |
|
Roadway collision with object other than vehicle |
6 | 16 | 10 |
|
Collision with object or animal on side of roadway |
4 | 16 | 10 |
|
Roadway noncollision incident |
7 | 10 | 6 |
|
Roadway noncollision- vehicle overturn |
-- | 9 | 6 |
|
Nonroadway incidents involving motorized land vehicles |
8 | 8 | 5 |
|
Nonroadway noncollision incident |
-- | 6 | 4 |
|
Nonroadway noncollision- vehicle overturn |
-- | 3 | 2 |
|
Explosions and fires |
-- | -- | -- |
|
Falls, slips, trips |
28 | 23 | 15 |
|
Fall to lower level |
23 | 15 | 10 |
|
Other fall to lower level |
20 | 11 | 7 |
|
Other fall to lower level- less than 6 feet |
-- | 5 | 3 |
|
Other fall to lower level- 6 to 30 feet |
12 | 5 | 3 |
|
Slip, trip, stumble or fall on same level |
5 | 8 | 5 |
|
Fall on same level |
5 | 8 | 5 |
|
Fall on same level due to slip or trip |
-- | 7 | 5 |
|
Exposure to harmful substances, environments |
28 | 16 | 10 |
|
Exposure to harmful substances |
23 | 14 | 9 |
|
Drug, alcohol overdose |
19 | 14 | 9 |
|
Contact incidents |
30 | 30 | 19 |
|
Collapse, engulfment |
2 | 8 | 5 |
|
Collapse, engulfment- loose materials or liquids |
-- | 6 | 4 |
|
Struck by propelled, falling, or suspended object |
14 | 14 | 9 |
|
Struck by falling object |
13 | 9 | 6 |
|
Struck by suspended or swinging object |
-- | 3 | 2 |
|
Overexertion, repetitive motion, and bodily condition |
-- | -- | -- |
|
Footnotes: |
|||
|
Note: The Census of Fatal Occupational Injuries (CFOI) has published data on fatal occupational injuries for the United States since 1992. During this time, the classification systems and definitions of many data elements have changed. See the CFOI Definitions page (www.bls.gov/iif/definitions/census-of-fatal-occupational-injuries-definitions.htm) for a more detailed description of each data element. Data for all years are revised and final. Totals for major categories may include subcategories not shown separately. Dashes indicate no data reported or data that do not meet publication criteria. CFOI fatal injury counts exclude illness-related deaths unless precipitated by an injury event. |
|||
| Industry | 2023 | 2024 | |
|---|---|---|---|
| Number | Number | Percent (%) | |
|
Total |
164 | 155 | 100 |
|
Private industry (1) |
154 | 143 | 92 |
|
Natural resources and mining |
9 | 9 | 6 |
|
Agriculture, forestry, fishing and hunting |
6 | 7 | 5 |
|
Crop production |
-- | 4 | 3 |
|
Greenhouse, nursery, and floriculture production |
-- | 1 | 1 |
|
Nursery and floriculture production |
-- | 1 | 1 |
|
Support activities for agriculture and forestry |
-- | 1 | 1 |
|
Support activities for crop production |
-- | 1 | 1 |
|
Support activities for crop production |
-- | 1 | 1 |
|
Soil preparation, planting, and cultivating |
-- | 1 | 1 |
|
Mining, quarrying, and oil and gas extraction |
3 | 2 | 1 |
|
Mining (except oil and gas) |
2 | 2 | 1 |
|
Construction |
42 | 29 | 19 |
|
Construction |
42 | 29 | 19 |
|
Construction of buildings |
15 | 6 | 4 |
|
Residential building construction |
9 | 4 | 3 |
|
Residential building construction |
9 | 4 | 3 |
|
Nonresidential building construction |
6 | 1 | 1 |
|
Commercial and institutional building construction |
5 | 1 | 1 |
|
Specialty trade contractors |
25 | 23 | 15 |
|
Foundation, structure, and building exterior contractors |
13 | 7 | 5 |
|
Framing contractors |
3 | 3 | 2 |
|
Residential framing contractors |
2 | 3 | 2 |
|
Building finishing contractors |
3 | 11 | 7 |
|
Other building finishing contractors |
-- | 7 | 5 |
|
Manufacturing |
9 | 18 | 12 |
|
Manufacturing |
9 | 18 | 12 |
|
Food manufacturing |
-- | 3 | 2 |
|
Animal slaughtering and processing |
-- | 1 | 1 |
|
Animal slaughtering and processing |
-- | 1 | 1 |
|
Meat processed from carcasses |
-- | 1 | 1 |
|
Paper manufacturing |
-- | 1 | 1 |
|
Converted paper product manufacturing |
-- | 1 | 1 |
|
Plastics and rubber products manufacturing |
1 | 6 | 4 |
|
Plastics product manufacturing |
1 | 6 | 4 |
|
Other plastics product manufacturing |
-- | 6 | 4 |
|
Nonmetallic mineral product manufacturing |
-- | 1 | 1 |
|
Cement and concrete product manufacturing |
-- | 1 | 1 |
|
Ready-mix concrete manufacturing |
-- | 1 | 1 |
|
Fabricated metal product manufacturing |
-- | 2 | 1 |
|
Coating, engraving, heat treating, and allied activities |
-- | 1 | 1 |
|
Coating, engraving, heat treating, and allied activities |
-- | 1 | 1 |
|
Metal coating, engraving (except jewelry and silverware), and allied services to manufacturers |
-- | 1 | 1 |
|
Other fabricated metal product manufacturing |
-- | 1 | 1 |
|
Transportation equipment manufacturing |
-- | 2 | 1 |
|
Motor vehicle parts manufacturing |
-- | 2 | 1 |
|
Other motor vehicle parts manufacturing |
-- | 2 | 1 |
|
Miscellaneous manufacturing |
1 | 1 | 1 |
|
Other miscellaneous manufacturing |
-- | 1 | 1 |
|
All other miscellaneous manufacturing |
-- | 1 | 1 |
|
Trade, transportation, and utilities |
-- | -- | -- |
|
Wholesale trade |
-- | 3 | 2 |
|
Retail trade |
10 | 7 | 5 |
|
General merchandise retailers |
3 | 1 | 1 |
|
Warehouse clubs, supercenters, and other general merchandise retailers |
3 | 1 | 1 |
|
Warehouse clubs, supercenters, and other general merchandise retailers |
3 | 1 | 1 |
|
Health and personal care retailers |
-- | 1 | 1 |
|
Health and personal care retailers |
-- | 1 | 1 |
|
Cosmetics, beauty supplies, and perfume retailers |
-- | 1 | 1 |
|
Sporting goods, hobby, musical instrument, book, and miscellaneous retailers |
-- | 2 | 1 |
|
Used merchandise retailers |
-- | 1 | 1 |
|
Used merchandise retailers |
-- | 1 | 1 |
|
Other miscellaneous retailers |
-- | 1 | 1 |
|
Transportation and warehousing |
23 | 24 | 15 |
|
Truck transportation |
17 | 18 | 12 |
|
General freight trucking |
9 | 13 | 8 |
|
General freight trucking, long-distance |
-- | 13 | 8 |
|
General freight trucking, long-distance, truckload |
-- | 12 | 8 |
|
General freight trucking, long-distance, less than truckload |
-- | 1 | 1 |
|
Specialized freight trucking |
8 | 5 | 3 |
|
Specialized freight (except used goods) trucking, local |
-- | 3 | 2 |
|
Transit and ground passenger transportation |
-- | 1 | 1 |
|
School and employee bus transportation |
-- | 1 | 1 |
|
School and employee bus transportation |
-- | 1 | 1 |
|
Warehousing and storage |
3 | 1 | 1 |
|
Warehousing and storage |
3 | 1 | 1 |
|
General warehousing and storage |
3 | 1 | 1 |
|
Information |
-- | -- | -- |
|
Financial activities |
3 | 5 | 3 |
|
Real estate and rental and leasing |
3 | 5 | 3 |
|
Real estate |
-- | 3 | 2 |
|
Rental and leasing services |
-- | 2 | 1 |
|
Commercial and industrial machinery and equipment rental and leasing |
-- | 2 | 1 |
|
Construction, transportation, mining, and forestry machinery and equipment rental and leasing |
-- | 2 | 1 |
|
Construction, mining, and forestry machinery and equipment rental and leasing |
-- | 1 | 1 |
|
Professional and business services |
30 | -- | -- |
|
Administrative and support and waste management and remediation services |
28 | 24 | 15 |
|
Educational and health services |
9 | -- | -- |
|
Leisure and hospitality |
5 | -- | -- |
|
Accommodation and food services |
3 | 11 | 7 |
|
Other services (except public administration) |
11 | 10 | 6 |
|
Other services (except public administration) |
11 | 10 | 6 |
|
Repair and maintenance |
10 | 5 | 3 |
|
Automotive repair and maintenance |
5 | 3 | 2 |
|
Automotive mechanical and electrical repair and maintenance |
-- | 2 | 1 |
|
General automotive repair |
-- | 2 | 1 |
|
Other automotive repair and maintenance |
-- | 1 | 1 |
|
Car washes |
-- | 1 | 1 |
|
Personal and laundry services |
1 | 1 | 1 |
|
Death care services |
-- | 1 | 1 |
|
Funeral homes and funeral services |
-- | 1 | 1 |
|
Religious, grantmaking, civic, professional, and similar organizations |
-- | 4 | 3 |
|
Government (2) |
10 | 12 | 8 |
|
Federal government |
-- | -- | -- |
|
State government |
-- | -- | -- |
|
Local government |
9 | 12 | 8 |
|
Footnotes: |
|||
|
Note: The Census of Fatal Occupational Injuries (CFOI) has published data on fatal occupational injuries for the United States since 1992. During this time, the classification systems and definitions of many data elements have changed. See the CFOI Definitions page (www.bls.gov/iif/definitions/census-of-fatal-occupational-injuries-definitions.htm) for a more detailed description of each data element. Data for all years are revised and final. Totals for major categories may include subcategories not shown separately. Dashes indicate no data reported or data that do not meet publication criteria. CFOI fatal injury counts exclude illness-related deaths unless precipitated by an injury event. |
|||
| Occupation (1) | 2023 | 2024 | |
|---|---|---|---|
| Number | Number | Percent (%) | |
|
All occupations |
164 | 155 | 100 |
|
Management occupations |
1 | 9 | 6 |
|
Business and financial operations occupations |
-- | -- | -- |
|
Computer and mathematical occupations |
-- | 1 | 1 |
|
Mathematical science occupations |
-- | 1 | 1 |
|
Operations research analysts |
-- | 1 | 1 |
|
Operations research analysts |
-- | 1 | 1 |
|
Architecture and engineering occupations |
-- | -- | -- |
|
Life, physical, and social science occupations |
-- | -- | -- |
|
Community and social service occupations |
-- | -- | -- |
|
Legal occupations |
-- | -- | -- |
|
Educational instruction and library occupations |
1 | -- | -- |
|
Arts, design, entertainment, sports, and media occupations |
2 | -- | -- |
|
Healthcare practitioners and technical occupations |
2 | -- | -- |
|
Healthcare support occupations |
-- | -- | -- |
|
Protective service occupations |
11 | 12 | 8 |
|
Food preparation and serving related occupations |
-- | 4 | 3 |
|
Food and beverage serving workers |
-- | 1 | 1 |
|
Fast food and counter workers |
-- | 1 | 1 |
|
Fast food and counter workers |
-- | 1 | 1 |
|
Building and grounds cleaning and maintenance occupations |
18 | 13 | 8 |
|
Supervisors of building and grounds cleaning and maintenance workers |
-- | 2 | 1 |
|
First-line supervisors of building and grounds cleaning and maintenance workers |
-- | 2 | 1 |
|
First-line supervisors of housekeeping and janitorial workers |
-- | 1 | 1 |
|
First-line supervisors of landscaping, lawn service, and groundskeeping workers |
-- | 1 | 1 |
|
Building cleaning and pest control workers |
-- | 2 | 1 |
|
Building cleaning workers |
-- | 2 | 1 |
|
Janitors and cleaners, except maids and housekeeping cleaners |
-- | 2 | 1 |
|
Grounds maintenance workers |
12 | 9 | 6 |
|
Grounds maintenance workers |
12 | 9 | 6 |
|
Personal care and service occupations |
2 | 1 | 1 |
|
Funeral service workers |
-- | 1 | 1 |
|
Embalmers and crematory operators |
-- | 1 | 1 |
|
Embalmers |
-- | 1 | 1 |
|
Sales and related occupations |
8 | 4 | 3 |
|
Office and administrative support occupations |
4 | 1 | 1 |
|
Secretaries and administrative assistants |
-- | 1 | 1 |
|
Secretaries and administrative assistants |
-- | 1 | 1 |
|
Farming, fishing, and forestry occupations |
4 | 7 | 5 |
|
Agricultural workers |
-- | 5 | 3 |
|
Miscellaneous agricultural workers |
-- | 5 | 3 |
|
Construction and extraction occupations |
41 | 32 | 21 |
|
Supervisors of construction and extraction workers |
3 | 1 | 1 |
|
First-line supervisors of construction trades and extraction workers |
3 | 1 | 1 |
|
First-line supervisors of construction trades and extraction workers |
3 | 1 | 1 |
|
Construction trades workers |
34 | 29 | 19 |
|
Carpenters |
4 | 9 | 6 |
|
Carpenters |
4 | 9 | 6 |
|
Construction laborers |
16 | 12 | 8 |
|
Construction laborers |
16 | 12 | 8 |
|
Extraction workers |
2 | 2 | 1 |
|
Surface mining machine operators and earth drillers |
1 | 1 | 1 |
|
Excavating and loading machine and dragline operators, surface mining |
-- | 1 | 1 |
|
Underground mining machine operators |
-- | 1 | 1 |
|
Loading and moving machine operators, underground mining |
-- | 1 | 1 |
|
Installation, maintenance, and repair occupations |
12 | 10 | 6 |
|
Supervisors of installation, maintenance, and repair workers |
-- | 1 | 1 |
|
First-line supervisors of mechanics, installers, and repairers |
-- | 1 | 1 |
|
First-line supervisors of mechanics, installers, and repairers |
-- | 1 | 1 |
|
Vehicle and mobile equipment mechanics, installers, and repairers |
7 | 1 | 1 |
|
Automotive technicians and repairers |
6 | 1 | 1 |
|
Automotive service technicians and mechanics |
-- | 1 | 1 |
|
Other installation, maintenance, and repair occupations |
4 | 8 | 5 |
|
Maintenance and repair workers, general |
-- | 3 | 2 |
|
Maintenance and repair workers, general |
-- | 3 | 2 |
|
Miscellaneous installation, maintenance, and repair workers |
-- | 1 | 1 |
|
Locksmiths and safe repairers |
-- | 1 | 1 |
|
Production occupations |
12 | 12 | 8 |
|
Metal workers and plastic workers |
7 | 6 | 4 |
|
Textile, apparel, and furnishings workers |
-- | 1 | 1 |
|
Transportation and material moving occupations |
41 | 44 | 28 |
|
Supervisors of transportation and material moving workers |
4 | 4 | 3 |
|
First-line supervisors of transportation and material moving workers |
4 | 4 | 3 |
|
Air transportation workers |
1 | 1 | 1 |
|
Aircraft pilots and flight engineers |
1 | 1 | 1 |
|
Commercial pilots |
1 | 1 | 1 |
|
Motor vehicle operators |
21 | 32 | 21 |
|
Driver/sales workers and truck drivers |
-- | 31 | 20 |
|
Heavy and tractor-trailer truck drivers |
-- | 26 | 17 |
|
Material moving workers |
15 | 7 | 5 |
|
Laborers and material movers |
-- | 3 | 2 |
|
Cleaners of vehicles and equipment |
-- | 1 | 1 |
|
Laborers and freight, stock, and material movers, hand |
-- | 2 | 1 |
|
Footnotes: |
|||
|
Note: The Census of Fatal Occupational Injuries (CFOI) has published data on fatal occupational injuries for the United States since 1992. During this time, the classification systems and definitions of many data elements have changed. See the CFOI Definitions page (www.bls.gov/iif/definitions/census-of-fatal-occupational-injuries-definitions.htm) for a more detailed description of each data element. Data for all years are revised and final. Totals for major categories may include subcategories not shown separately. Dashes indicate no data reported or data that do not meet publication criteria. CFOI fatal injury counts exclude illness-related deaths unless precipitated by an injury event. |
|||
| Demographic | 2023 | 2024 | |
|---|---|---|---|
| Number | Number | Percent (%) | |
|
Total |
164 | 155 | 100 |
|
Employee status |
|||
|
Wage and salary workers (1) |
134 | 124 | 80 |
|
Self-employed (2) |
30 | 31 | 20 |
|
Sex |
|||
|
Male |
149 | 136 | 88 |
|
Female |
15 | 19 | 12 |
|
Age (3) |
|||
|
Under 16 years |
-- | -- | -- |
|
16 to 17 years |
1 | 3 | 2 |
|
18 to 19 years |
1 | 1 | 1 |
|
20 to 24 years |
14 | 7 | 5 |
|
25 to 34 years |
27 | 29 | 19 |
|
35 to 44 years |
34 | 32 | 21 |
|
45 to 54 years |
40 | 27 | 17 |
|
55 to 64 years |
31 | 28 | 18 |
|
65 years and over |
16 | 28 | 18 |
|
Race or ethnic origin (4) |
|||
|
White, non-Hispanic |
105 | 81 | 52 |
|
Black or African-American, non-Hispanic |
22 | 29 | 19 |
|
Hispanic or Latino |
34 | 35 | 23 |
|
American Indian or Alaska Native, non-Hispanic |
-- | -- | -- |
|
Asian, non-Hispanic |
-- | -- | -- |
|
Native Hawaiian or Pacific Islander, non-Hispanic |
-- | -- | -- |
|
Person of multiple races, non-Hispanic |
-- | -- | -- |
|
Other or not reported, non-Hispanic |
-- | -- | -- |
|
Footnotes: |
|||
|
Note: The Census of Fatal Occupational Injuries (CFOI) has published data on fatal occupational injuries for the United States since 1992. During this time, the classification systems and definitions of many data elements have changed. See the CFOI Definitions page (www.bls.gov/iif/definitions/census-of-fatal-occupational-injuries-definitions.htm) for a more detailed description of each data element. Data for all years are revised and final. Totals for major categories may include subcategories not shown separately. Dashes indicate no data reported or data that do not meet publication criteria. CFOI fatal injury counts exclude illness-related deaths unless precipitated by an injury event. |
|||
Last Modified Date: Friday, March 27, 2026