An official website of the United States government
An official website of the United States government
The .gov means it's official.
Federal government websites often end in .gov or .mil. Before sharing sensitive information,
make sure you're on a federal government site.
The site is secure.
The
https:// ensures that you are connecting to the official website and that any
information you provide is encrypted and transmitted securely.
16-1674-DAL
Monday, September 19, 2016
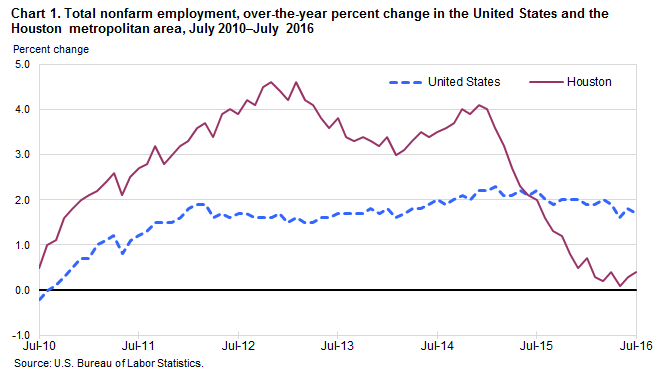
Total nonfarm employment in the Houston-The Woodlands-Sugar Land Metropolitan Statistical Area stood at 2,993,300 in July 2016, up 13,300, or 0.4 percent, from one year earlier, the U.S. Bureau of Labor Statistics reported today. During the same period, the national job count increased 1.7 percent. Assistant Commissioner for Regional Operations Stanley W. Suchman noted that July 2016 marked a six-year period of over-the-year employment increases in the Houston metropolitan area. (See chart 1 and table 1; the Technical Note at the end of this release contains metropolitan area definitions. All data in this release are not seasonally adjusted; accordingly, over-the-year analysis is used throughout.)
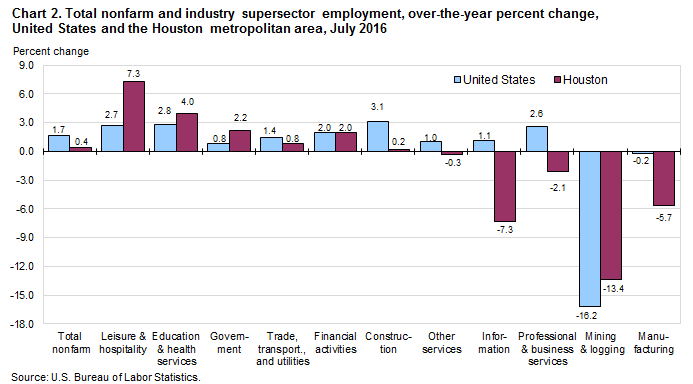
Industry employmentLeisure and hospitality had the largest annual job gain among Houston’s supersectors, adding 22,400 jobs since July 2015. The 7.3-percent local rate of job growth in this supersector was more than double the national rate of 2.7 percent. (See table 1 and chart 2.) The local industry’s gains were concentrated in food services and drinking places, which added 18,800 jobs during the period.
The education and health services supersector added 14,800 jobs, a 4.0-percent rise from July 2015; nationally, employment in this industry rose 2.8 percent. Locally, the hospital industry had the largest job gain, 4,800, an increase of 5.8 percent.
Government employment expanded by 7,900 jobs over the year, with local government accounting for nearly all of the increase, up 6,600. Three-fourths of the local government employment gain was in educational services, which added 5,000 jobs during the period. In the Houston area, total government employment increased 2.2 percent compared to a 0.8-percent gain nationally.
Trade, transportation, and utilities–the area’s largest supersector–added 4,900 jobs, up 0.8 percent from July 2015 to July 2016. The area’s retail trade industry gained 8,000 jobs, an increase of 2.7 percent; this local job gain was partially offset by declines in two local industries, wholesale trade and transportation and utilities. Nationally, the trade, transportation, and utilities supersector expanded 1.4 percent.
The financial activities supersector added 3,000 jobs from July 2015. Employment in financial activities rose at a 2.0-percent pace in both the Houston metropolitan area and nationwide.
Manufacturing had the largest job loss among Houston’s supersectors between July 2015 and July 2016, declining 14,000. Locally, manufacturing employment fell 5.7 percent compared to a 0.2-percent decline nationally.
Two other Houston area supersectors had job losses of 10,000 or more from the previous year – mining and logging (-13,400) and professional and business services (-10,000). Local mining and logging employment fell 13.4 percent from July 2015, compared to the national decrease of 16.2 percent. Houston’s professional and business services supersector declined 2.1 percent, in contrast to the national gain of 2.6 percent. In local professional and business services, the largest job loss was in architectural, engineering, and related services (-6,200).
Local employment in the information supersector lost 2,400 jobs from July 2015. The area’s 7.3-percent decline in this industry was its tenth consecutive month of over-the-year losses. Nationally, the information supersector increased 1.1 percent.
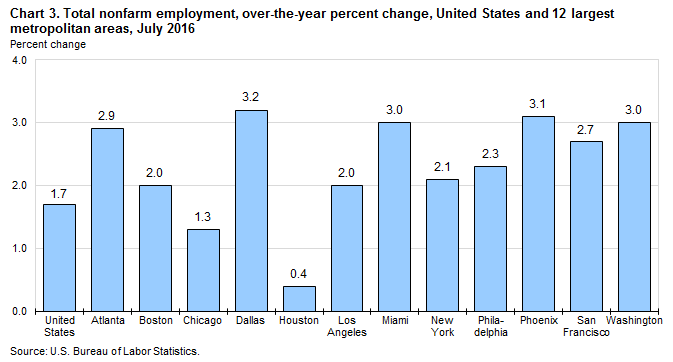
Employment in the 12 largest metropolitan areasHouston-The Woodlands-Sugar Land was 1 of the nation’s 12 largest metropolitan statistical areas in July 2016. All 12 areas had over-the-year job growth during the period, with 10 exceeding the national average of 1.7 percent. The fastest rate of job growth was in Dallas-Fort Worth-Arlington, up 3.2 percent. Houston (0.4 percent) and Chicago-Naperville-Elgin (1.3 percent) had the slowest rates of job growth. (See chart 3 and table 2.)
New York-Newark-Jersey City added the largest number of jobs over the year,199, 700, followed by Los Angeles-Long Beach-Anaheim (+116,800) and Dallas (+109,900). Houston had the smallest employment gain over the year, adding 13,300 jobs, followed by Boston-Cambridge-Nashua, which added 54,000 jobs.
Education and health services added the most jobs in Boston, Los Angeles, New York, and Phoenix-Mesa-Scottsdale. Professional and business services gained the most jobs in Miami-Fort Lauderdale-West Palm Beach, Philadelphia-Camden-Wilmington, and San Francisco-Oakland-Hayward.
Manufacturing lost the most jobs over the year in 7 areas—Boston, Chicago, Dallas, Houston, Los Angeles, Miami, and Phoenix. New York was the only area to have no annual job loss in any supersector.
Metropolitan area employment data for August 2016 are scheduled to be released on Tuesday, September 20, 2016, at 10:00 a.m. (ET).
This release presents nonfarm payroll employment estimates from the Current Employment Statistics (CES) program. The CES survey is a Federal-State cooperative endeavor between State employment security agencies and the Bureau of Labor Statistics.
Definitions. Employment data refer to persons on establishment payrolls who receive pay for any part of the pay period that includes the 12th of the month. Persons are counted at their place of work rather than at their place of residence; those appearing on more than one payroll are counted on each payroll. Industries are classified on the basis of their principal activity in accordance with the 2012 version of the North American Industry Classification System.
Method of estimation. The employment data are estimated using a "link relative" technique in which a ratio (link relative) of current-month employment to that of the previous month is computed from a sample of establishments reporting for both months. The estimates of employment for the current month are obtained by multiplying the estimates for the previous month by these ratios. Small-domain models are used as the official estimators for the approximately 39 percent of CES published series which have insufficient sample for direct sample-based estimates.
Annual revisions. Employment estimates are adjusted annually to a complete count of jobs, called benchmarks, derived principally from tax reports that are submitted by employers who are covered under state unemployment insurance (UI) laws. The benchmark information is used to adjust the monthly estimates between the new benchmark and the preceding one and also to establish the level of employment for the new benchmark month. Thus, the benchmarking process establishes the level of employment, and the sample is used to measure the month-to-month changes in the level for the subsequent months.
Reliability of the estimates. The estimates presented in this release are based on sample surveys, administrative data, and modeling and, thus, are subject to sampling and other types of errors. Sampling error is a measure of sampling variability—that is, variation that occurs by chance because a sample rather than the entire population is surveyed. Survey data also are subject to nonsampling errors, such as those which can be introduced into the data collection and processing operations. Estimates not directly derived from sample surveys are subject to additional errors resulting from the specific estimation processes used. The sums of individual items may not always equal the totals shown in the same tables because of rounding.
Employment estimates. Measures of sampling error are available for state CES data at the total nonfarm and supersector level and for metropolitan area CES data. Information on recent benchmark revisions for states is available on the BLS Web site at www.bls.gov/sae/.
Area definitions. The substate area data published in this release reflect standards and definitions established by the U.S. Office of Management and Budget, dated February 28, 2013. A detailed list of the geographic definitions is available at www.bls.gov/lau/lausmsa.htm.
The Houston-The Woodlands-Sugarland Metropolitan Statistical Area includes Austin, Brazoria, Chambers, Fort Bend, Galveston, Harris, Liberty, Montgomery, and Waller Counties in Texas.
Additional information
More complete information on the technical procedures used to develop these estimates and additional data appear in Employment and Earnings, which is available online at www.bls.gov/opub/ee/home.htm. Industry employment data for states and metropolitan areas from the Current Employment Statistics program are also available in the above mentioned news releases and from the Internet at www.bls.gov/sae/.
Information in this release will be made available to sensory impaired individuals upon request. Voice phone: (202) 691-5200; Federal Relay Service: (800) 877-8339.
| Area and Industry | Jul. 2015 | May 2016 | Jun. 2016 | Jul. 2016(p) | Jul. 2015 to Jul. 2016(p) | |
|---|---|---|---|---|---|---|
| Net Change | Percent Change | |||||
United States | ||||||
Total nonfarm | 141,774 | 144,555 | 145,199 | 144,200 | 2,426 | 1.7 |
Mining and logging | 825 | 689 | 690 | 693 | -132 | -16.0 |
Construction | 6,703 | 6,698 | 6,847 | 6,915 | 212 | 3.2 |
Manufacturing | 12,407 | 12,253 | 12,372 | 12,370 | -37 | -0.3 |
Trade, transportation, and utilities | 26,969 | 27,216 | 27,364 | 27,348 | 379 | 1.4 |
Information | 2,767 | 2,740 | 2,797 | 2,790 | 23 | 0.8 |
Financial activities | 8,210 | 8,250 | 8,338 | 8,378 | 168 | 2.0 |
Professional and business services | 19,837 | 20,138 | 20,344 | 20,376 | 539 | 2.7 |
Education and health services | 21,750 | 22,696 | 22,483 | 22,369 | 619 | 2.8 |
Leisure and hospitality | 15,844 | 15,716 | 16,179 | 16,265 | 421 | 2.7 |
Other services | 5,702 | 5,703 | 5,760 | 5,758 | 56 | 1.0 |
Government | 20,760 | 22,456 | 22,025 | 20,938 | 178 | 0.9 |
Houston-The Woodlands-Sugar Land, TX, Metropolitan Statistical Area | ||||||
Total nonfarm | 2,980.0 | 2,993.2 | 3,001.9 | 2,993.3 | 13.3 | 0.4 |
Mining and logging | 99.9 | 86.7 | 86.8 | 86.5 | -13.4 | -13.4 |
Construction | 217.5 | 219.0 | 215.8 | 217.9 | 0.4 | 0.2 |
Manufacturing | 245.3 | 230.4 | 231.5 | 231.3 | -14.0 | -5.7 |
Trade, transportation, and utilities | 611.9 | 612.7 | 615.3 | 616.8 | 4.9 | 0.8 |
Information | 32.9 | 31.3 | 31.2 | 30.5 | -2.4 | -7.3 |
Financial activities | 152.1 | 153.2 | 154.5 | 155.1 | 3.0 | 2.0 |
Professional and business services | 473.7 | 456.2 | 458.6 | 463.7 | -10.0 | -2.1 |
Education and health services | 366.8 | 383.7 | 383.4 | 381.6 | 14.8 | 4.0 |
Leisure and hospitality | 305.8 | 318.9 | 327.8 | 328.2 | 22.4 | 7.3 |
Other services | 108.6 | 107.0 | 109.2 | 108.3 | -0.3 | -0.3 |
Government | 365.5 | 394.1 | 387.8 | 373.4 | 7.9 | 2.2 |
(p) preliminary | ||||||
| Area and Industry | Jul. 2015 | May 2016 | Jun. 2016 | Jul. 2016(p) | Jul. 2015 to Jul. 2016(p) | |
|---|---|---|---|---|---|---|
| Net Change | Percent Change | |||||
Atlanta-Sandy Springs-Roswell, GA | ||||||
Total nonfarm | 2,581.4 | 2,664.1 | 2,656.7 | 2,656.2 | 74.8 | 2.9 |
Mining and logging | 1.4 | 1.5 | 1.4 | 1.4 | 0.0 | 0.0 |
Construction | 109.0 | 115.1 | 116.1 | 116.8 | 7.8 | 7.2 |
Manufacturing | 157.7 | 160.8 | 162.4 | 163.3 | 5.6 | 3.6 |
Trade, transportation, and utilities | 577.8 | 595.1 | 593.7 | 595.5 | 17.7 | 3.1 |
Information | 94.5 | 87.9 | 88.3 | 88.8 | -5.7 | -6.0 |
Financial activities | 163.0 | 164.6 | 165.0 | 166.3 | 3.3 | 2.0 |
Professional and business services | 480.3 | 496.1 | 495.5 | 497.5 | 17.2 | 3.6 |
Education and health services | 314.8 | 328.0 | 321.9 | 325.0 | 10.2 | 3.2 |
Leisure and hospitality | 276.0 | 290.7 | 292.6 | 291.5 | 15.5 | 5.6 |
Other services | 98.2 | 97.2 | 97.1 | 97.0 | -1.2 | -1.2 |
Government | 308.7 | 327.1 | 322.7 | 313.1 | 4.4 | 1.4 |
Boston-Cambridge-Nashua, MA-NH | ||||||
Total nonfarm | 2,667.9 | 2,699.1 | 2,732.5 | 2,721.9 | 54.0 | 2.0 |
Mining, logging, and construction | 109.3 | 112.7 | 117.5 | 119.9 | 10.6 | 9.7 |
Manufacturing | 193.2 | 188.7 | 190.9 | 190.8 | -2.4 | -1.2 |
Trade, transportation, and utilities | 418.1 | 421.8 | 426.3 | 424.4 | 6.3 | 1.5 |
Information | 78.9 | 74.8 | 78.8 | 79.6 | 0.7 | 0.9 |
Financial activities | 185.5 | 185.7 | 188.9 | 191.3 | 5.8 | 3.1 |
Professional and business services | 465.6 | 462.5 | 471.9 | 474.0 | 8.4 | 1.8 |
Education and health services | 549.5 | 569.9 | 565.6 | 565.0 | 15.5 | 2.8 |
Leisure and hospitality | 272.1 | 263.3 | 274.5 | 281.4 | 9.3 | 3.4 |
Other services | 105.6 | 104.0 | 106.1 | 106.7 | 1.1 | 1.0 |
Government | 290.1 | 315.7 | 312.0 | 288.8 | -1.3 | -0.4 |
Chicago-Naperville-Elgin, IL-IN-WI | ||||||
Total nonfarm | 4,620.8 | 4,675.7 | 4,701.8 | 4,681.8 | 61.0 | 1.3 |
Mining and logging | 1.5 | 1.5 | 1.6 | 1.6 | 0.1 | 6.7 |
Construction | 174.6 | 173.4 | 181.6 | 185.1 | 10.5 | 6.0 |
Manufacturing | 417.4 | 412.3 | 415.1 | 414.4 | -3.0 | -0.7 |
Trade, transportation, and utilities | 932.4 | 938.1 | 942.5 | 943.2 | 10.8 | 1.2 |
Information | 82.6 | 81.2 | 81.6 | 81.9 | -0.7 | -0.8 |
Financial activities | 297.2 | 292.3 | 295.4 | 295.3 | -1.9 | -0.6 |
Professional and business services | 821.8 | 822.1 | 831.5 | 831.0 | 9.2 | 1.1 |
Education and health services | 688.1 | 712.9 | 702.1 | 695.6 | 7.5 | 1.1 |
Leisure and hospitality | 471.1 | 480.9 | 492.0 | 488.6 | 17.5 | 3.7 |
Other services | 196.3 | 195.9 | 198.4 | 200.9 | 4.6 | 2.3 |
Government | 537.8 | 565.1 | 560.0 | 544.2 | 6.4 | 1.2 |
Dallas-Fort Worth-Arlington, TX | ||||||
Total nonfarm | 3,401.6 | 3,515.7 | 3,526.8 | 3,511.5 | 109.9 | 3.2 |
Mining, logging, and construction | 202.0 | 199.8 | 202.0 | 203.0 | 1.0 | 0.5 |
Manufacturing | 264.6 | 262.2 | 263.7 | 262.2 | -2.4 | -0.9 |
Trade, transportation, and utilities | 724.1 | 752.4 | 756.8 | 757.9 | 33.8 | 4.7 |
Information | 81.1 | 80.6 | 80.7 | 80.3 | -0.8 | -1.0 |
Financial activities | 277.3 | 288.9 | 290.6 | 291.7 | 14.4 | 5.2 |
Professional and business services | 563.8 | 579.4 | 578.9 | 583.1 | 19.3 | 3.4 |
Education and health services | 416.2 | 431.5 | 430.0 | 430.0 | 13.8 | 3.3 |
Leisure and hospitality | 357.9 | 374.3 | 381.4 | 378.5 | 20.6 | 5.8 |
Other services | 121.5 | 120.1 | 121.1 | 120.5 | -1.0 | -0.8 |
Government | 393.1 | 426.5 | 421.6 | 404.3 | 11.2 | 2.8 |
Houston-The Woodlands-Sugar Land, TX | ||||||
Total nonfarm | 2,980.0 | 2,993.2 | 3,001.9 | 2,993.3 | 13.3 | 0.4 |
Mining and logging | 99.9 | 86.7 | 86.8 | 86.5 | -13.4 | -13.4 |
Construction | 217.5 | 219.0 | 215.8 | 217.9 | 0.4 | 0.2 |
Manufacturing | 245.3 | 230.4 | 231.5 | 231.3 | -14.0 | -5.7 |
Trade, transportation, and utilities | 611.9 | 612.7 | 615.3 | 616.8 | 4.9 | 0.8 |
Information | 32.9 | 31.3 | 31.2 | 30.5 | -2.4 | -7.3 |
Financial activities | 152.1 | 153.2 | 154.5 | 155.1 | 3.0 | 2.0 |
Professional and business services | 473.7 | 456.2 | 458.6 | 463.7 | -10.0 | -2.1 |
Education and health services | 366.8 | 383.7 | 383.4 | 381.6 | 14.8 | 4.0 |
Leisure and hospitality | 305.8 | 318.9 | 327.8 | 328.2 | 22.4 | 7.3 |
Other services | 108.6 | 107.0 | 109.2 | 108.3 | -0.3 | -0.3 |
Government | 365.5 | 394.1 | 387.8 | 373.4 | 7.9 | 2.2 |
Los Angeles-Long Beach-Anaheim, CA | ||||||
Total nonfarm | 5,780.7 | 5,956.7 | 5,963.8 | 5,897.5 | 116.8 | 2.0 |
Mining and logging | 4.7 | 4.1 | 4.1 | 4.1 | -0.6 | -12.8 |
Construction | 220.5 | 233.2 | 233.3 | 232.0 | 11.5 | 5.2 |
Manufacturing | 520.2 | 510.8 | 513.2 | 514.8 | -5.4 | -1.0 |
Trade, transportation, and utilities | 1,074.3 | 1,085.6 | 1,087.7 | 1,089.9 | 15.6 | 1.5 |
Information | 223.9 | 237.1 | 235.4 | 228.6 | 4.7 | 2.1 |
Financial activities | 334.0 | 335.7 | 338.4 | 337.4 | 3.4 | 1.0 |
Professional and business services | 886.0 | 901.3 | 911.3 | 910.8 | 24.8 | 2.8 |
Education and health services | 926.3 | 982.4 | 974.8 | 964.8 | 38.5 | 4.2 |
Leisure and hospitality | 705.4 | 716.1 | 728.3 | 729.2 | 23.8 | 3.4 |
Other services | 202.2 | 203.7 | 203.3 | 202.4 | 0.2 | 0.1 |
Government | 683.2 | 746.7 | 734.0 | 683.5 | 0.3 | 0.0 |
Miami-Fort Lauderdale-West Palm Beach, FL | ||||||
Total nonfarm | 2,465.1 | 2,569.4 | 2,541.5 | 2,539.8 | 74.7 | 3.0 |
Mining and logging | 0.6 | 0.6 | 0.6 | 0.6 | 0.0 | 0.0 |
Construction | 112.5 | 119.8 | 119.6 | 122.6 | 10.1 | 9.0 |
Manufacturing | 84.4 | 84.9 | 84.4 | 83.8 | -0.6 | -0.7 |
Trade, transportation, and utilities | 579.6 | 593.4 | 594.4 | 592.9 | 13.3 | 2.3 |
Information | 48.2 | 48.0 | 48.2 | 48.1 | -0.1 | -0.2 |
Financial activities | 175.3 | 181.3 | 182.9 | 183.7 | 8.4 | 4.8 |
Professional and business services | 403.3 | 415.0 | 415.7 | 421.0 | 17.7 | 4.4 |
Education and health services | 361.8 | 375.0 | 373.3 | 371.3 | 9.5 | 2.6 |
Leisure and hospitality | 299.8 | 319.2 | 316.7 | 313.4 | 13.6 | 4.5 |
Other services | 120.3 | 123.9 | 122.5 | 121.2 | 0.9 | 0.7 |
Government | 279.3 | 308.3 | 283.2 | 281.2 | 1.9 | 0.7 |
New York-Newark-Jersey City, NY-NJ-PA | ||||||
Total nonfarm | 9,373.9 | 9,527.4 | 9,607.7 | 9,573.6 | 199.7 | 2.1 |
Mining, logging, and construction | 384.1 | 391.2 | 396.2 | 400.6 | 16.5 | 4.3 |
Manufacturing | 368.9 | 369.3 | 373.0 | 371.8 | 2.9 | 0.8 |
Trade, transportation, and utilities | 1,709.4 | 1,721.5 | 1,741.4 | 1,728.7 | 19.3 | 1.1 |
Information | 287.4 | 277.1 | 291.7 | 293.7 | 6.3 | 2.2 |
Financial activities | 776.4 | 765.9 | 773.4 | 781.8 | 5.4 | 0.7 |
Professional and business services | 1,500.7 | 1,508.8 | 1,521.6 | 1,522.2 | 21.5 | 1.4 |
Education and health services | 1,733.5 | 1,842.6 | 1,809.2 | 1,786.5 | 53.0 | 3.1 |
Leisure and hospitality | 920.7 | 907.9 | 957.8 | 972.2 | 51.5 | 5.6 |
Other services | 415.0 | 421.8 | 427.8 | 430.0 | 15.0 | 3.6 |
Government | 1,277.8 | 1,321.3 | 1,315.6 | 1,286.1 | 8.3 | 0.6 |
Philadelphia-Camden-Wilmington, PA-NJ-DE-MD | ||||||
Total nonfarm | 2,804.5 | 2,897.5 | 2,912.3 | 2,870.2 | 65.7 | 2.3 |
Mining, logging, and construction | 114.7 | 115.0 | 117.2 | 117.3 | 2.6 | 2.3 |
Manufacturing | 182.0 | 183.3 | 184.9 | 185.0 | 3.0 | 1.6 |
Trade, transportation, and utilities | 516.0 | 527.4 | 529.6 | 524.3 | 8.3 | 1.6 |
Information | 46.7 | 44.4 | 46.9 | 46.6 | -0.1 | -0.2 |
Financial activities | 210.9 | 210.1 | 211.7 | 212.3 | 1.4 | 0.7 |
Professional and business services | 449.4 | 471.0 | 475.1 | 472.5 | 23.1 | 5.1 |
Education and health services | 590.7 | 616.1 | 608.6 | 604.4 | 13.7 | 2.3 |
Leisure and hospitality | 265.2 | 267.0 | 277.9 | 275.5 | 10.3 | 3.9 |
Other services | 119.3 | 119.8 | 120.3 | 119.4 | 0.1 | 0.1 |
Government | 309.6 | 343.4 | 340.1 | 312.9 | 3.3 | 1.1 |
Phoenix-Mesa-Scottsdale, AZ | ||||||
Total nonfarm | 1,866.6 | 1,960.3 | 1,934.2 | 1,925.2 | 58.6 | 3.1 |
Mining and logging | 3.5 | 3.3 | 3.3 | 3.2 | -0.3 | -8.6 |
Construction | 99.6 | 105.7 | 108.2 | 110.3 | 10.7 | 10.7 |
Manufacturing | 120.6 | 119.9 | 120.9 | 120.1 | -0.5 | -0.4 |
Trade, transportation, and utilities | 373.8 | 383.9 | 383.4 | 383.8 | 10.0 | 2.7 |
Information | 36.8 | 38.8 | 39.2 | 38.4 | 1.6 | 4.3 |
Financial activities | 167.0 | 174.7 | 175.2 | 175.2 | 8.2 | 4.9 |
Professional and business services | 320.4 | 328.1 | 329.8 | 331.3 | 10.9 | 3.4 |
Education and health services | 276.6 | 291.9 | 290.4 | 288.2 | 11.6 | 4.2 |
Leisure and hospitality | 201.7 | 214.4 | 209.4 | 207.0 | 5.3 | 2.6 |
Other services | 65.0 | 65.7 | 65.6 | 65.3 | 0.3 | 0.5 |
Government | 201.6 | 233.9 | 208.8 | 202.4 | 0.8 | 0.4 |
San Francisco-Oakland-Hayward, CA | ||||||
Total nonfarm | 2,266.4 | 2,314.0 | 2,325.7 | 2,327.0 | 60.6 | 2.7 |
Mining and logging | 1.0 | 0.9 | 0.9 | 0.9 | -0.1 | -10.0 |
Construction | 113.3 | 117.3 | 118.8 | 122.2 | 8.9 | 7.9 |
Manufacturing | 127.6 | 127.0 | 128.3 | 129.2 | 1.6 | 1.3 |
Trade, transportation, and utilities | 366.1 | 368.9 | 371.5 | 373.8 | 7.7 | 2.1 |
Information | 86.5 | 85.7 | 87.0 | 87.5 | 1.0 | 1.2 |
Financial activities | 131.7 | 129.5 | 130.2 | 131.3 | -0.4 | -0.3 |
Professional and business services | 467.9 | 473.3 | 477.0 | 483.3 | 15.4 | 3.3 |
Education and health services | 326.0 | 343.0 | 339.7 | 338.8 | 12.8 | 3.9 |
Leisure and hospitality | 262.1 | 266.5 | 271.6 | 271.0 | 8.9 | 3.4 |
Other services | 84.6 | 84.6 | 85.6 | 85.2 | 0.6 | 0.7 |
Government | 299.6 | 317.3 | 315.1 | 303.8 | 4.2 | 1.4 |
Washington-Arlington-Alexandria, DC-VA-MD-WV | ||||||
Total nonfarm | 3,184.9 | 3,245.8 | 3,274.9 | 3,279.7 | 94.8 | 3.0 |
Mining, logging, and construction | 154.7 | 158.4 | 161.9 | 161.6 | 6.9 | 4.5 |
Manufacturing | 53.0 | 53.2 | 53.7 | 54.3 | 1.3 | 2.5 |
Trade, transportation, and utilities | 404.6 | 413.4 | 417.5 | 415.6 | 11.0 | 2.7 |
Information | 77.5 | 73.0 | 75.5 | 76.1 | -1.4 | -1.8 |
Financial activities | 155.5 | 153.7 | 154.4 | 155.8 | 0.3 | 0.2 |
Professional and business services | 729.2 | 739.7 | 745.6 | 748.3 | 19.1 | 2.6 |
Education and health services | 404.8 | 420.4 | 420.5 | 421.1 | 16.3 | 4.0 |
Leisure and hospitality | 325.6 | 326.6 | 338.2 | 337.1 | 11.5 | 3.5 |
Other services | 200.2 | 200.0 | 201.6 | 203.4 | 3.2 | 1.6 |
Government | 679.8 | 707.4 | 706.0 | 706.4 | 26.6 | 3.9 |
(p) preliminary | ||||||
Last Modified Date: Monday, September 19, 2016