An official website of the United States government
An official website of the United States government
The .gov means it's official.
Federal government websites often end in .gov or .mil. Before sharing sensitive information,
make sure you're on a federal government site.
The site is secure.
The
https:// ensures that you are connecting to the official website and that any
information you provide is encrypted and transmitted securely.
25-330-DAL
Friday, March 14, 2025
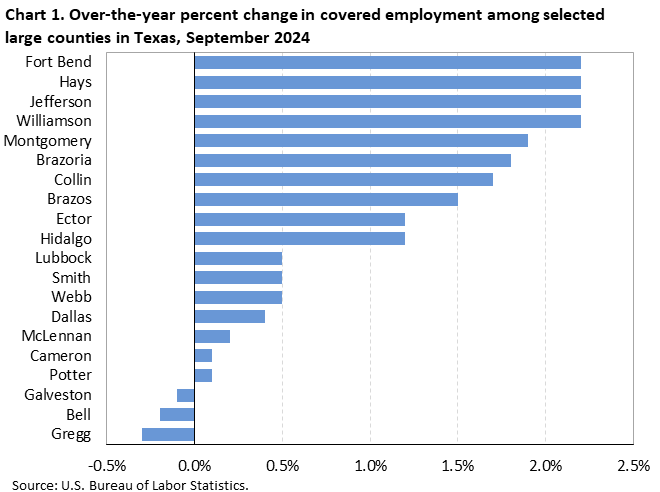
Employment rose in 25 of the 28 largest counties in Texas from September 2023 to September 2024, the U.S. Bureau of Labor Statistics reported today. (Large counties are the 369 U.S. counties or county equivalents with annual average employment levels of 75,000 or more in 2023.) Assistant Commissioner for Regional Operations Michael Hirniak noted that Fort Bend, Hays, Jefferson, and Williamson counties were all tied for the largest over-the-year increase in employment at 2.2 percent. (See chart 1 and table 1.)
National employment increased 0.8 percent over the year, with 264 of the 369 largest U.S. counties with published data reporting gains. Kings, NY, had the largest over-the-year increase in employment, with a gain of 4.9 percent. Elkhart, IN, had the largest over-the-year percentage decrease in employment (-2.7 percent).
Among the 28 largest counties in Texas, employment was highest for Harris (2,436,500) in September 2024. Within Harris County’s private industry, health care and social assistance accounted for the largest employment. Together, the 28 largest Texas counties accounted for 80.3 percent of total covered employment within the state. Nationwide, the 369 largest counties comprised 73.1 percent of total covered employment in the United States.
Employment and wage levels (but not over-the-year changes) are also available for the 226 counties in Texas with employment below 75,000. Wage levels in 207 of the 226 smaller counties were below the national average of $1,394 in the third quarter of 2024. (See table 2.)
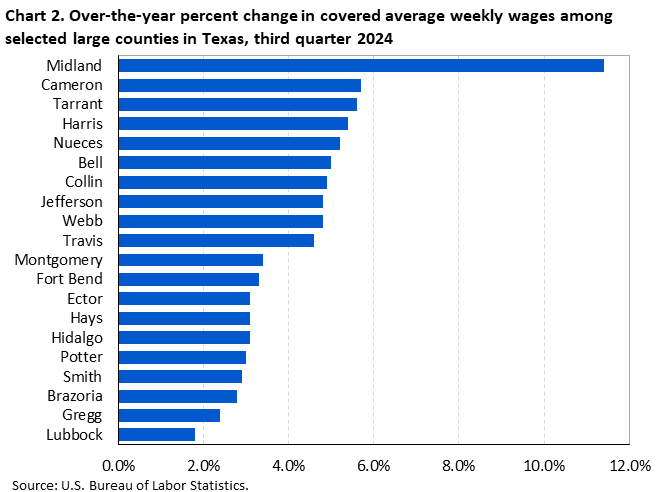
Large county wage changesAll 28 large Texas counties reported average weekly wage gains from the third quarter of 2023 to the third quarter of 2024. (See chart 2.) Midland County had the largest gain (+11.4 percent), followed by Cameron County (+5.7 percent) and Tarrant County (+5.6 percent). Over-the-year wage gains among Texas’ other 25 large counties ranged from 5.4 percent to 1.8 percent.
Nationwide, wages increased by 4.5 percent over the year. Among the 365 largest counties in the United States with published data, 363 had over-the-year wage increases. Benton, AR, had the largest percentage wage increase (+15.5 percent). Weld, CO, had the largest over-the-year percentage decrease (-1.3 percent).
Large county average weekly wagesWeekly wages in 7 of the 28 largest counties in Texas were above the national average of $1,394 in the third quarter of 2024. Average weekly wages in five of these counties ranked among the top 50 nationwide: Midland ($1,913, 12th), Travis ($1,782, 19th), Collin ($1,628, 30th), Dallas ($1,617, 32nd) and Harris ($1,608, 34th).
Among the 369 largest U.S. counties, 94 reported average weekly wages at or above the U.S. average in the third quarter of 2024. San Mateo, CA, had the highest average weekly wage ($3,557). Average weekly wages were below the national average in the remaining 275 counties. Hidalgo, TX, had the lowest average weekly wage ($819).
Average weekly wages in smaller countiesAmong the 226 smaller counties in Texas—those with employment below 75,000— Loving ($2,145) and 18 other counties reported an average weekly wage above the national average. Menard County ($669) reported the lowest average weekly wage in the state.
When all 254 counties in Texas were considered, 70 reported average weekly wages of $949 or less, 65 registered wages from $950 to $1,049, 51 had wages from $1,050 to $1,149, 24 had wages from $1,150 to $1,249, and 44 had average weekly wages of $1,250 or higher. (See map 1.) The higher-paying counties were mainly located in and around the metropolitan areas of Austin, Dallas, and Houston, as well as the West Texas region.
QCEW data for states have been included in this release in table 3. For additional information about quarterly employment and wages data, please read the Technical Note for the County Employment and Wages News Release or visit the Quarterly Census of Employment and Wages website.
Employment and Wages Annual Averages Online features comprehensive information by detailed industry on establishments, employment, and wages for the nation and all states. This publication is typically published in September of the following year of the reference period or shortly after the QCEW first quarter full data update.
Information in this release will be made available to individuals with sensory impairments upon request. Voice phone: (202) 691-5200; Telecommunications Relay Service: 7-1-1.
The County Employment and Wages release for the fourth quarter 2024 is scheduled to be released on Wednesday, May 21, 2025.
The County Employment and Wages full data update for the fourth quarter 2024 is scheduled to be released on Wednesday, June 4, 2025.
| Area | Establishments, third quarter (thousands) | Employment | Average weekly wage (1) | |||||
|---|---|---|---|---|---|---|---|---|
| September 2024 (thousands) | Percent change, September 2023–24 (2) | National ranking by percent change (3) | Third quarter 2024 ($) | National ranking by level (3) | Percent change, third quarter 2023–24 (2) | National ranking by percent change (3) | ||
United States (4) | 12,297.4 | 155,360.4 | 0.8 | -- | 1,394 | -- | 4.5 | -- |
Texas | 844.5 | 13,933.5 | 1.4 | -- | 1,396 | 13 | 4.6 | 15 |
Bell | 6.5 | 128.2 | -0.2 | 298 | 1,217 | 206 | 5.0 | 66 |
Bexar | 45.3 | 932.6 | 0.9 | 136 | 1,244 | 189 | 3.4 | 261 |
Brazoria | 6.8 | 123.2 | 1.8 | 50 | 1,264 | 176 | 2.8 | 320 |
Brazos | 5.2 | 124.0 | 1.5 | 71 | 1,022 | 348 | 3.7 | 223 |
Cameron | 7.2 | 156.7 | 0.1 | 252 | 849 | 368 | 5.7 | 33 |
Collin | 34.7 | 547.9 | 1.7 | 56 | 1,628 | 30 | 4.9 | 75 |
Dallas | 83.8 | 1,818.5 | 0.4 | 212 | 1,617 | 32 | 4.1 | 178 |
Denton | 20.7 | 311.3 | 0.5 | 188 | 1,227 | 199 | 3.8 | 215 |
Ector | 4.3 | 79.5 | 1.2 | 90 | 1,413 | 84 | 3.1 | 294 |
El Paso | 16.8 | 334.5 | 0.9 | 136 | 959 | 362 | 3.5 | 250 |
Fort Bend | 18.3 | 251.3 | 2.2 | 28 | 1,158 | 259 | 3.3 | 269 |
Galveston | 6.9 | 121.4 | -0.1 | 283 | 1,161 | 255 | 4.0 | 186 |
Gregg | 4.3 | 74.3 | -0.3 | 307 | 1,110 | 307 | 2.4 | 340 |
Harris | 123.8 | 2,436.5 | 0.6 | 176 | 1,608 | 34 | 5.4 | 48 |
Hays | 6.3 | 95.9 | 2.2 | 28 | 1,040 | 338 | 3.1 | 294 |
Hidalgo | 14.0 | 290.6 | 1.2 | 90 | 819 | 369 | 3.1 | 294 |
Jefferson | 5.8 | 125.5 | 2.2 | 28 | 1,306 | 141 | 4.8 | 81 |
Lubbock | 8.2 | 151.3 | 0.5 | 188 | 1,044 | 337 | 1.8 | 352 |
McLennan | 6.0 | 123.2 | 0.2 | 241 | 1,146 | 267 | 4.5 | 122 |
Midland | 6.4 | 118.8 | 1.2 | 90 | 1,913 | 12 | 11.4 | 4 |
Montgomery | 15.1 | 229.5 | 1.9 | 46 | 1,291 | 151 | 3.4 | 261 |
Nueces | 8.5 | 163.7 | 1.2 | 90 | 1,134 | 280 | 5.2 | 54 |
Potter | 4.0 | 77.8 | 0.1 | 252 | 1,142 | 270 | 3.0 | 306 |
Smith | 6.9 | 113.4 | 0.5 | 188 | 1,093 | 318 | 2.9 | 314 |
Tarrant | 50.4 | 1,013.5 | 1.0 | 122 | 1,354 | 113 | 5.6 | 38 |
Travis | 51.8 | 904.4 | 0.9 | 136 | 1,782 | 19 | 4.6 | 107 |
Webb | 6.0 | 107.5 | 0.5 | 188 | 887 | 367 | 4.8 | 81 |
Williamson | 15.7 | 232.0 | 2.2 | 28 | 1,453 | 70 | 4.0 | 186 |
(1) Average weekly wages were calculated using unrounded data. | ||||||||
Note: Data are preliminary. Covered employment and wages include workers covered by Unemployment Insurance (UI) and Unemployment Compensation for Federal Employees (UCFE) programs. | ||||||||
| Area | Establishments | Employment September 2024 | Average weekly wage ($) (1) |
|---|---|---|---|
United States (2) | 12,297,414 | 155,360,357 | 1,394 |
Texas | 844,485 | 13,933,505 | 1,396 |
Anderson | 1,665 | 20,284 | 1,128 |
Andrews | 537 | 7,566 | 1,505 |
Angelina | 1,935 | 36,020 | 950 |
Aransas | 696 | 6,146 | 863 |
Archer | 245 | 1,932 | 1,064 |
Armstrong | 86 | 541 | 1,067 |
Atascosa | 937 | 14,237 | 1,208 |
Austin | 1,517 | 13,224 | 1,266 |
Bailey | 237 | 2,349 | 937 |
Bandera | 505 | 3,633 | 874 |
Bastrop | 1,835 | 22,523 | 1,035 |
Baylor | 186 | 1,558 | 1,002 |
Bee | 561 | 8,466 | 909 |
Bell | 6,504 | 128,219 | 1,217 |
Bexar | 45,346 | 932,584 | 1,244 |
Blanco | 493 | 4,121 | 1,290 |
Borden | 75 | 399 | 1,349 |
Bosque | 399 | 3,996 | 1,060 |
Bowie | 2,481 | 42,342 | 1,011 |
Brazoria | 6,849 | 123,242 | 1,264 |
Brazos | 5,238 | 123,968 | 1,022 |
Brewster | 458 | 4,311 | 1,019 |
Briscoe | 78 | 358 | 901 |
Brooks | 146 | 2,196 | 1,131 |
Brown | 959 | 15,851 | 944 |
Burleson | 444 | 4,827 | 1,038 |
Burnet | 1,689 | 16,580 | 1,068 |
Caldwell | 880 | 10,318 | 999 |
Calhoun | 689 | 14,228 | 1,608 |
Callahan | 341 | 3,009 | 980 |
Cameron | 7,190 | 156,709 | 849 |
Camp | 276 | 3,772 | 928 |
Carson | 191 | 7,034 | 1,823 |
Cass | 557 | 7,796 | 917 |
Castro | 287 | 2,566 | 884 |
Chambers | 924 | 22,602 | 1,382 |
Cherokee | 905 | 14,859 | 972 |
Childress | 237 | 2,920 | 949 |
Clay | 201 | 1,690 | 943 |
Cochran | 127 | 734 | 1,089 |
Coke | 111 | 1,173 | 1,472 |
Coleman | 258 | 2,177 | 874 |
Collin | 34,742 | 547,899 | 1,628 |
Collingsworth | 117 | 784 | 939 |
Colorado | 640 | 7,339 | 986 |
Comal | 5,131 | 76,496 | 1,082 |
Comanche | 393 | 4,483 | 948 |
Concho | 93 | 1,070 | 1,132 |
Cooke | 1,109 | 16,456 | 1,175 |
Coryell | 1,016 | 14,978 | 1,022 |
Cottle | 171 | 826 | 1,378 |
Crane | 112 | 1,312 | 1,510 |
Crockett | 200 | 1,302 | 1,041 |
Crosby | 175 | 1,086 | 899 |
Culberson | 107 | 1,553 | 1,833 |
Dallam | 410 | 4,964 | 1,060 |
Dallas | 83,765 | 1,818,517 | 1,617 |
Dawson | 483 | 4,081 | 994 |
Deaf Smith | 485 | 8,480 | 1,024 |
Delta | 107 | 952 | 824 |
Denton | 20,701 | 311,283 | 1,227 |
DeWitt | 580 | 6,788 | 1,030 |
Dickens | 64 | 460 | 950 |
Dimmit | 316 | 5,886 | 1,405 |
Donley | 123 | 926 | 737 |
Duval | 196 | 3,669 | 770 |
Eastland | 529 | 5,703 | 1,008 |
Ector | 4,260 | 79,484 | 1,413 |
Edwards | 73 | 518 | 807 |
Ellis | 3,911 | 63,103 | 1,114 |
El Paso | 16,772 | 334,516 | 959 |
Erath | 1,289 | 18,507 | 924 |
Falls | 295 | 2,886 | 1,031 |
Fannin | 634 | 8,695 | 1,083 |
Fayette | 854 | 9,233 | 1,029 |
Fisher | 115 | 812 | 1,063 |
Floyd | 245 | 1,457 | 852 |
Foard | 57 | 412 | 820 |
Fort Bend | 18,271 | 251,291 | 1,158 |
Franklin | 500 | 3,664 | 1,027 |
Freestone | 395 | 4,985 | 998 |
Frio | 391 | 6,429 | 1,159 |
Gaines | 677 | 6,784 | 1,166 |
Galveston | 6,934 | 121,427 | 1,161 |
Garza | 178 | 1,657 | 994 |
Gillespie | 1,231 | 12,247 | 951 |
Glasscock | 140 | 808 | 1,365 |
Goliad | 162 | 1,357 | 1,009 |
Gonzales | 546 | 7,188 | 1,043 |
Gray | 553 | 7,600 | 1,129 |
Grayson | 3,219 | 52,145 | 1,120 |
Gregg | 4,293 | 74,286 | 1,110 |
Grimes | 590 | 7,800 | 1,105 |
Guadalupe | 2,723 | 48,728 | 1,128 |
Hale | 854 | 11,004 | 934 |
Hall | 130 | 707 | 714 |
Hamilton | 277 | 2,791 | 903 |
Hansford | 235 | 2,109 | 1,058 |
Hardeman | 129 | 1,340 | 873 |
Hardin | 969 | 12,376 | 1,002 |
Harris | 123,756 | 2,436,455 | 1,608 |
Harrison | 1,450 | 21,470 | 1,161 |
Hartley | 157 | 2,878 | 1,072 |
Haskell | 194 | 1,509 | 788 |
Hays | 6,329 | 95,949 | 1,040 |
Hemphill | 192 | 1,339 | 1,116 |
Henderson | 1,651 | 19,589 | 947 |
Hidalgo | 13,996 | 290,604 | 819 |
Hill | 813 | 11,625 | 1,066 |
Hockley | 611 | 8,705 | 1,225 |
Hood | 1,687 | 18,689 | 979 |
Hopkins | 979 | 14,401 | 1,030 |
Houston | 1,016 | 7,665 | 1,210 |
Howard | 918 | 12,743 | 1,222 |
Hudspeth | 79 | 1,289 | 1,589 |
Hunt | 1,799 | 32,709 | 1,210 |
Hutchinson | 450 | 7,427 | 1,400 |
Irion | 76 | 780 | 1,669 |
Jack | 256 | 2,305 | 1,109 |
Jackson | 423 | 5,648 | 1,090 |
Jasper | 675 | 9,076 | 1,039 |
Jeff Davis | 87 | 865 | 781 |
Jefferson | 5,801 | 125,547 | 1,306 |
Jim Hogg | 128 | 1,626 | 1,072 |
Jim Wells | 866 | 14,799 | 896 |
Johnson | 4,034 | 59,850 | 1,101 |
Jones | 337 | 3,039 | 977 |
Karnes | 402 | 6,198 | 1,277 |
Kaufman | 2,656 | 43,938 | 1,048 |
Kendall | 1,938 | 20,706 | 1,189 |
Kenedy | 29 | 275 | 1,154 |
Kent | 29 | 383 | 701 |
Kerr | 1,551 | 19,317 | 1,106 |
Kimble | 167 | 1,220 | 890 |
King | 30 | 287 | 959 |
Kinney | 76 | 960 | 1,097 |
Kleberg | 635 | 11,769 | 1,019 |
Knox | 146 | 1,050 | 981 |
Lamar | 1,354 | 22,102 | 999 |
Lamb | 412 | 3,888 | 978 |
Lampasas | 489 | 4,987 | 901 |
La Salle | 194 | 3,181 | 1,339 |
Lavaca | 499 | 6,264 | 975 |
Lee | 469 | 7,978 | 1,169 |
Leon | 419 | 5,769 | 1,237 |
Liberty | 1,291 | 20,271 | 1,062 |
Limestone | 407 | 8,768 | 1,492 |
Lipscomb | 91 | 1,247 | 997 |
Live Oak | 315 | 3,705 | 1,253 |
Llano | 619 | 5,614 | 977 |
Loving | 19 | 774 | 2,145 |
Lubbock | 8,231 | 151,338 | 1,044 |
Lynn | 186 | 1,493 | 1,261 |
McCulloch | 272 | 2,271 | 1,003 |
McLennan | 6,023 | 123,245 | 1,146 |
McMullen | 87 | 562 | 1,218 |
Madison | 298 | 4,188 | 983 |
Marion | 172 | 2,173 | 881 |
Martin | 233 | 2,305 | 1,437 |
Mason | 181 | 1,135 | 885 |
Matagorda | 817 | 11,117 | 1,324 |
Maverick | 952 | 18,508 | 853 |
Medina | 893 | 11,073 | 925 |
Menard | 79 | 426 | 669 |
Midland | 6,382 | 118,843 | 1,913 |
Milam | 518 | 6,027 | 1,010 |
Mills | 148 | 1,279 | 823 |
Mitchell | 181 | 2,036 | 1,037 |
Montague | 515 | 4,852 | 896 |
Montgomery | 15,142 | 229,463 | 1,291 |
Moore | 540 | 12,959 | 1,101 |
Morris | 232 | 3,371 | 1,074 |
Motley | 63 | 310 | 682 |
Nacogdoches | 1,414 | 22,786 | 886 |
Navarro | 1,004 | 16,668 | 974 |
Newton | 134 | 1,235 | 925 |
Nolan | 419 | 6,213 | 1,086 |
Nueces | 8,529 | 163,672 | 1,134 |
Ochiltree | 400 | 4,048 | 1,060 |
Oldham | 94 | 882 | 949 |
Orange | 1,470 | 24,501 | 1,213 |
Palo Pinto | 727 | 8,251 | 934 |
Panola | 557 | 7,698 | 1,121 |
Parker | 3,748 | 41,462 | 1,088 |
Parmer | 350 | 6,484 | 1,117 |
Pecos | 466 | 5,415 | 1,148 |
Polk | 955 | 12,965 | 966 |
Potter | 4,037 | 77,829 | 1,142 |
Presidio | 196 | 2,020 | 1,096 |
Rains | 272 | 2,293 | 831 |
Randall | 2,714 | 36,926 | 1,000 |
Reagan | 151 | 1,702 | 1,499 |
Real | 103 | 756 | 783 |
Red River | 248 | 2,650 | 851 |
Reeves | 503 | 7,515 | 1,506 |
Refugio | 204 | 2,233 | 1,004 |
Roberts | 46 | 184 | 812 |
Robertson | 393 | 6,369 | 1,377 |
Rockwall | 3,355 | 41,300 | 1,072 |
Runnels | 277 | 3,034 | 975 |
Rusk | 869 | 13,196 | 1,024 |
Sabine | 223 | 2,507 | 838 |
San Augustine | 154 | 1,941 | 962 |
San Jacinto | 296 | 2,451 | 902 |
San Patricio | 1,207 | 21,539 | 1,163 |
San Saba | 204 | 1,560 | 831 |
Schleicher | 84 | 718 | 1,026 |
Scurry | 466 | 6,353 | 1,304 |
Shackelford | 136 | 1,287 | 1,402 |
Shelby | 609 | 8,793 | 990 |
Sherman | 137 | 1,118 | 1,060 |
Smith | 6,923 | 113,418 | 1,093 |
Somervell | 268 | 3,930 | 1,242 |
Starr | 660 | 14,337 | 796 |
Stephens | 314 | 3,305 | 884 |
Sterling | 86 | 498 | 1,059 |
Stonewall | 70 | 758 | 1,118 |
Sutton | 159 | 1,151 | 1,184 |
Swisher | 186 | 1,802 | 879 |
Tarrant | 50,395 | 1,013,484 | 1,354 |
Taylor | 3,861 | 67,693 | 1,090 |
Terrell | 49 | 259 | 1,235 |
Terry | 361 | 3,074 | 974 |
Throckmorton | 65 | 424 | 845 |
Titus | 850 | 17,458 | 966 |
Tom Green | 3,095 | 50,128 | 1,079 |
Travis | 51,752 | 904,401 | 1,782 |
Trinity | 224 | 2,402 | 812 |
Tyler | 350 | 4,065 | 933 |
Upshur | 583 | 7,685 | 937 |
Upton | 129 | 4,399 | 1,573 |
Uvalde | 699 | 9,617 | 889 |
Val Verde | 943 | 18,633 | 948 |
Van Zandt | 1,132 | 12,670 | 881 |
Victoria | 2,398 | 36,993 | 1,064 |
Walker | 1,163 | 26,372 | 987 |
Waller | 1,137 | 26,552 | 1,137 |
Ward | 398 | 6,483 | 1,488 |
Washington | 1,084 | 16,697 | 955 |
Webb | 5,958 | 107,536 | 887 |
Wharton | 1,154 | 16,283 | 990 |
Wheeler | 201 | 1,729 | 867 |
Wichita | 3,352 | 52,792 | 984 |
Wilbarger | 333 | 6,068 | 896 |
Willacy | 319 | 4,327 | 859 |
Williamson | 15,662 | 232,008 | 1,453 |
Wilson | 918 | 9,643 | 988 |
Winkler | 242 | 4,361 | 1,666 |
Wise | 1,643 | 20,918 | 1,131 |
Wood | 942 | 10,631 | 931 |
Yoakum | 274 | 3,413 | 1,356 |
Young | 616 | 7,014 | 1,019 |
Zapata | 167 | 2,863 | 816 |
Zavala | 179 | 2,405 | 1,034 |
(1) Average weekly wages were calculated using unrounded data. | |||
Note: Data are preliminary. Covered employment and wages include workers covered by Unemployment Insurance (UI) and Unemployment Compensation for Federal Employees (UCFE) programs. | |||
| State | Establishments, third quarter (thousands) | Employment | Average weekly wage (1) | ||||
|---|---|---|---|---|---|---|---|
| September 2024 (thousands) | Percent change, September 2023–24 | Third quarter 2024 ($) | National ranking by level | Percent change, third quarter 2023–24 | National ranking by percent change | ||
United States (2) | 12,297.4 | 155,360.4 | 0.8 | 1,394 | -- | 4.5 | -- |
Alabama | 162.5 | 2,099.8 | 0.7 | 1,172 | 36 | 4.5 | 19 |
Alaska | 25.5 | 342.0 | 1.3 | 1,382 | 15 | 3.8 | 40 |
Arizona | 222.3 | 3,187.2 | -0.1 | 1,317 | 19 | 5.5 | 6 |
Arkansas | 103.6 | 1,301.1 | 1.0 | 1,094 | 49 | 5.5 | 6 |
California | 1,926.3 | 18,209.7 | 0.5 | 1,694 | 4 | 5.1 | 10 |
Colorado | 250.8 | 2,902.1 | 0.5 | 1,486 | 8 | 3.8 | 40 |
Connecticut | 150.3 | 1,690.7 | 0.7 | 1,545 | 6 | 4.5 | 19 |
Delaware | 44.6 | 479.2 | 1.5 | 1,330 | 17 | 4.0 | 34 |
District of Columbia | 52.3 | 760.3 | -0.1 | 2,290 | 1 | 6.3 | 2 |
Florida | 908.5 | 9,832.1 | 1.6 | 1,276 | 22 | 4.8 | 13 |
Georgia | 394.0 | 4,853.7 | 0.8 | 1,304 | 20 | 4.5 | 19 |
Hawaii | 60.6 | 639.4 | 1.8 | 1,299 | 21 | 5.8 | 3 |
Idaho | 102.8 | 867.9 | 1.9 | 1,126 | 45 | 5.3 | 9 |
Illinois | 410.9 | 6,083.9 | 0.4 | 1,398 | 12 | 3.9 | 39 |
Indiana | 192.8 | 3,191.0 | 0.3 | 1,165 | 37 | 4.5 | 19 |
Iowa | 111.8 | 1,559.5 | -0.3 | 1,154 | 40 | 4.0 | 34 |
Kansas | 102.9 | 1,430.4 | 0.7 | 1,137 | 43 | 4.6 | 15 |
Kentucky | 158.5 | 2,002.1 | 0.8 | 1,129 | 44 | 3.4 | 48 |
Louisiana | 156.2 | 1,908.1 | 0.8 | 1,151 | 41 | 4.0 | 34 |
Maine | 66.0 | 657.8 | 0.9 | 1,176 | 34 | 4.3 | 28 |
Maryland | 213.5 | 2,765.7 | 1.9 | 1,471 | 9 | 3.6 | 47 |
Massachusetts | 291.3 | 3,647.4 | -0.3 | 1,736 | 3 | 5.6 | 4 |
Michigan | 318.0 | 4,440.9 | 0.4 | 1,266 | 24 | 3.0 | 50 |
Minnesota | 214.7 | 2,948.1 | 0.7 | 1,389 | 14 | 4.6 | 15 |
Mississippi | 90.5 | 1,170.9 | 0.5 | 960 | 51 | 3.7 | 45 |
Missouri | 248.0 | 2,911.7 | 0.5 | 1,197 | 31 | 4.0 | 34 |
Montana | 64.5 | 520.2 | 1.4 | 1,125 | 46 | 4.8 | 13 |
Nebraska | 77.9 | 1,022.2 | 0.7 | 1,155 | 38 | 4.1 | 32 |
Nevada | 108.7 | 1,555.6 | 1.0 | 1,260 | 26 | 4.9 | 12 |
New Hampshire | 67.8 | 691.2 | 0.5 | 1,404 | 11 | 4.0 | 34 |
New Jersey | 333.1 | 4,282.0 | 0.7 | 1,503 | 7 | 3.2 | 49 |
New Mexico | 68.6 | 870.5 | 1.1 | 1,155 | 38 | 5.4 | 8 |
New York | 714.8 | 9,678.7 | 1.5 | 1,684 | 5 | 4.5 | 19 |
North Carolina | 379.3 | 4,898.5 | 1.1 | 1,275 | 23 | 4.5 | 19 |
North Dakota | 36.7 | 435.4 | 1.5 | 1,257 | 27 | 4.4 | 26 |
Ohio | 344.5 | 5,524.1 | 0.4 | 1,237 | 30 | 4.5 | 19 |
Oklahoma | 129.8 | 1,699.2 | 0.7 | 1,095 | 48 | 4.2 | 31 |
Oregon | 192.8 | 2,016.9 | 0.3 | 1,353 | 16 | 3.8 | 40 |
Pennsylvania | 395.0 | 6,044.7 | 0.7 | 1,330 | 17 | 3.7 | 45 |
Rhode Island | 49.0 | 501.9 | 1.1 | 1,263 | 25 | 2.5 | 51 |
South Carolina | 192.8 | 2,296.8 | 1.8 | 1,142 | 42 | 5.1 | 10 |
South Dakota | 40.5 | 462.3 | 1.0 | 1,102 | 47 | 4.3 | 28 |
Tennessee | 233.3 | 3,290.0 | 0.8 | 1,256 | 28 | 4.1 | 32 |
Texas | 844.5 | 13,933.5 | 1.4 | 1,396 | 13 | 4.6 | 15 |
Utah | 140.4 | 1,724.3 | 1.1 | 1,248 | 29 | 4.3 | 28 |
Vermont | 33.5 | 308.4 | 0.4 | 1,191 | 32 | 4.6 | 15 |
Virginia | 325.2 | 4,116.1 | 1.4 | 1,444 | 10 | 4.4 | 26 |
Washington | 241.1 | 3,663.9 | 1.3 | 1,781 | 2 | 5.6 | 4 |
West Virginia | 62.6 | 698.4 | 0.6 | 1,085 | 50 | 3.8 | 40 |
Wisconsin | 210.9 | 2,956.4 | 0.4 | 1,175 | 35 | 3.8 | 40 |
Wyoming | 31.1 | 286.9 | 0.4 | 1,183 | 33 | 6.5 | 1 |
Puerto Rico | 52.5 | 949.3 | 0.6 | 668 | (3) | 5.4 | (3) |
Virgin Islands | 3.0 | 35.1 | -0.2 | 983 | (3) | 2.3 | (3) |
(1) Average weekly wages were calculated using unrounded data. | |||||||
Note: Data are preliminary. Covered employment and wages include workers covered by Unemployment Insurance (UI) and Unemployment Compensation for Federal Employees (UCFE) programs. | |||||||
Last Modified Date: Friday, March 14, 2025