An official website of the United States government
An official website of the United States government
The .gov means it's official.
Federal government websites often end in .gov or .mil. Before sharing sensitive information,
make sure you're on a federal government site.
The site is secure.
The
https:// ensures that you are connecting to the official website and that any
information you provide is encrypted and transmitted securely.
26-533-DAL
Tuesday, March 17, 2026
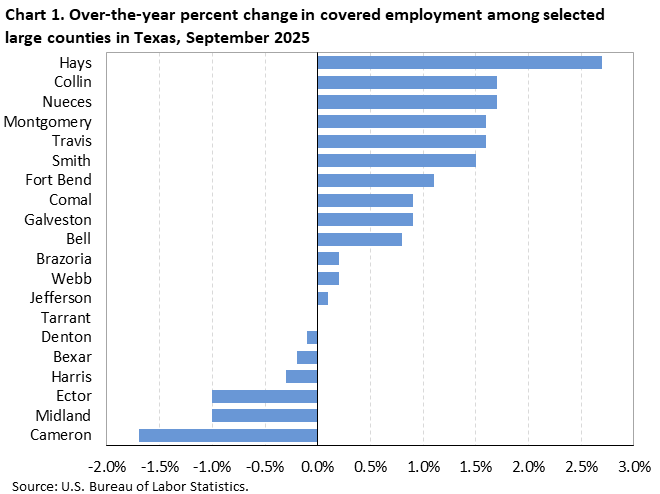
Employment rose in 21 of the 28 largest counties in Texas from September 2024 to September 2025, the U.S. Bureau of Labor Statistics reported today. Acting Regional Commissioner Jerome Watters noted that Hays County had the largest over-the-year increase in employment, with a gain of 2.7 percent. (See chart 1 and table 1.)
Among the 28 largest counties in Texas, employment was highest in Harris (2,442,000) in September 2025. Together, the 28 largest counties accounted for 80.3 percent of total covered employment within the state. Nationwide, the 372 largest counties comprise 73.2 percent of total covered employment in the United States. (Large counties and county equivalents are those with annual average employment levels of 75,000 or more in 2024.)
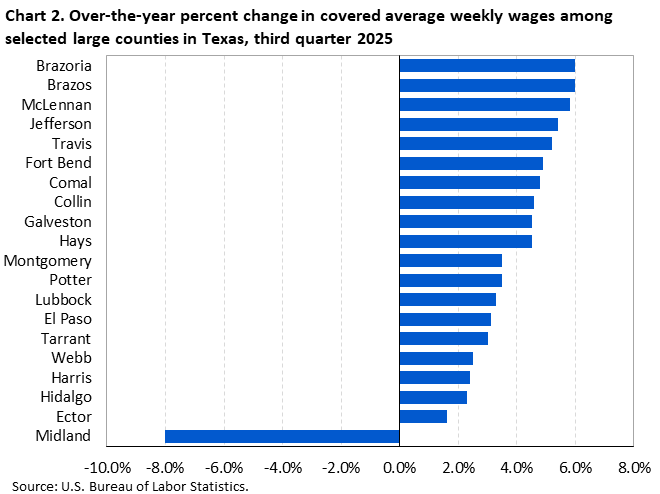
Average weekly wages rose in 27 of the 28 large Texas counties over the year. (See chart 2.) Brazoria and Brazos had the largest increase (+6.0 percent), while Midland had the only loss (-8.0 percent). Over-the-year wage changes for Texas' 25 other large counties ranged from 5.8 percent to 1.6 percent.
Weekly wages in 6 of the 28 largest counties in Texas were above the national average of $1,459. Average weekly wages ranged from $1,891 in Travis to $836 in Hidalgo.
Employment and wage levels (but not over-the-year changes) are also available for the 226 small counties in Texas, defined as having employment below 75,000 in 2024. (See table 2.) Wage levels in 206 of the 226 smaller counties were below the national average. Borden reported the highest average weekly wage ($2,491). Menard reported the lowest average weekly wage ($709) in the state.
Among all 254 Texas counties, 43 reported average weekly wages of lower than $925, 69 had wages from $925 to $1,049, 61 had wages from $1,050 to $1,174, 37 had wages from $1,175 to $1,299, and 44 had average weekly wages of $1,300 or higher. (See map 1 and table 2.)
QCEW data for states have been included in this release in table 3.
Nationwide coverage of the largest counties is published in the County Employment and Wages news release. Additional information about quarterly employment and wages data is available in the news release Technical Note and from the Quarterly Census of Employment and Wages website.
If you are deaf, hard of hearing, or have a speech disability, please dial 7-1-1 to access telecommunications relay services.
The County Employment and Wages release for the fourth quarter 2025 is scheduled to be released on Tuesday, June 2, 2026.
| Area | Establishments, third quarter (thousands) | Employment | Average weekly wage (1) | |||||
|---|---|---|---|---|---|---|---|---|
| September 2025 (thousands) | Percent change, September 2024–25 (2) | National ranking by percent change (3) | Third quarter 2025 ($) | National ranking by level (3) | Percent change, third quarter 2024–25 (2) | National ranking by percent change (3) | ||
United States (4) | 12,353.8 | 155,767.7 | 0.1 | -- | 1,459 | -- | 4.7 | -- |
Texas | 854.9 | 14,062.3 | 0.7 | -- | 1,444 | 14 | 3.6 | 38 |
Bell | 6.6 | 130.0 | 0.8 | 68 | 1,267 | 200 | 4.1 | 164 |
Bexar | 45.0 | 935.1 | -0.2 | 199 | 1,280 | 192 | 3.6 | 224 |
Brazoria | 6.9 | 124.6 | 0.2 | 137 | 1,334 | 156 | 6.0 | 26 |
Brazos | 5.3 | 125.6 | 0.7 | 78 | 1,086 | 339 | 6.0 | 26 |
Cameron | 7.2 | 153.5 | -1.7 | 345 | 888 | 371 | 4.3 | 141 |
Collin | 35.2 | 562.2 | 1.7 | 16 | 1,699 | 26 | 4.6 | 100 |
Comal | 5.2 | 76.9 | 0.9 | 59 | 1,132 | 321 | 4.8 | 88 |
Dallas | 82.4 | 1,830.0 | 0.6 | 92 | 1,683 | 31 | 4.2 | 157 |
Denton | 21.0 | 317.5 | -0.1 | 183 | 1,276 | 197 | 3.8 | 195 |
Ector | 4.3 | 80.2 | -1.0 | 299 | 1,433 | 102 | 1.6 | 350 |
El Paso | 16.7 | 341.1 | 0.4 | 108 | 988 | 366 | 3.1 | 278 |
Fort Bend | 18.5 | 257.7 | 1.1 | 47 | 1,209 | 249 | 4.9 | 81 |
Galveston | 6.9 | 122.8 | 0.9 | 59 | 1,219 | 239 | 4.5 | 113 |
Harris | 122.3 | 2,442.0 | -0.3 | 223 | 1,645 | 36 | 2.4 | 327 |
Hays | 6.4 | 98.7 | 2.7 | 7 | 1,092 | 335 | 4.5 | 113 |
Hidalgo | 14.2 | 293.4 | 0.4 | 108 | 836 | 372 | 2.3 | 333 |
Jefferson | 5.7 | 123.4 | 0.1 | 154 | 1,369 | 138 | 5.4 | 48 |
Lubbock | 8.2 | 152.6 | 0.4 | 108 | 1,077 | 344 | 3.3 | 259 |
McLennan | 5.9 | 122.9 | 0.4 | 108 | 1,201 | 259 | 5.8 | 34 |
Midland | 6.4 | 119.0 | -1.0 | 299 | 1,753 | 21 | -8.0 | 360 |
Montgomery | 15.5 | 233.8 | 1.6 | 19 | 1,343 | 150 | 3.5 | 238 |
Nueces | 8.4 | 166.7 | 1.7 | 16 | 1,184 | 273 | 4.4 | 128 |
Potter | 4.0 | 78.9 | 0.6 | 92 | 1,176 | 283 | 3.5 | 238 |
Smith | 6.8 | 115.5 | 1.5 | 24 | 1,135 | 320 | 3.7 | 206 |
Tarrant | 49.8 | 1,015.2 | 0.0 | 168 | 1,387 | 127 | 3.0 | 288 |
Travis | 51.3 | 929.9 | 1.6 | 19 | 1,891 | 17 | 5.2 | 61 |
Webb | 6.0 | 109.3 | 0.2 | 137 | 905 | 370 | 2.5 | 321 |
Williamson | 15.9 | 237.6 | 0.7 | 78 | 1,520 | 69 | 4.5 | 113 |
(1) Average weekly wages were calculated using unrounded data. | ||||||||
Note: Data are preliminary. Dashes indicate data not applicable or available. Covered employment and wages include workers covered by Unemployment Insurance (UI) and Unemployment Compensation for Federal Employees (UCFE) programs. | ||||||||
| Area | Establishments | Employment September 2025 | Average weekly wage ($) (1) |
|---|---|---|---|
United States (2) | 12,353,804 | 155,767,691 | 1,459 |
Texas | 854,878 | 14,062,349 | 1,444 |
Borden | 68 | 317 | 2,491 |
Loving | 21 | 910 | 1,950 |
Travis | 51,291 | 929,910 | 1,891 |
Carson | 186 | 7,275 | 1,890 |
Irion | 74 | 771 | 1,762 |
Culberson | 108 | 1,580 | 1,756 |
Midland | 6,399 | 118,978 | 1,753 |
Winkler | 229 | 4,234 | 1,753 |
Upton | 128 | 4,293 | 1,750 |
La Salle | 187 | 3,253 | 1,730 |
Collin | 35,170 | 562,215 | 1,699 |
Dallas | 82,423 | 1,829,997 | 1,683 |
Calhoun | 638 | 12,743 | 1,668 |
Harris | 122,315 | 2,442,010 | 1,645 |
Ward | 387 | 6,384 | 1,609 |
Glasscock | 137 | 963 | 1,594 |
Hudspeth | 78 | 1,151 | 1,552 |
Reagan | 151 | 1,665 | 1,525 |
Andrews | 548 | 7,865 | 1,524 |
Reeves | 507 | 7,869 | 1,522 |
Williamson | 15,901 | 237,559 | 1,520 |
Cottle | 166 | 841 | 1,501 |
Martin | 247 | 2,780 | 1,485 |
Dimmit | 304 | 5,590 | 1,482 |
Chambers | 962 | 23,705 | 1,480 |
Crane | 109 | 1,336 | 1,470 |
Ector | 4,275 | 80,219 | 1,433 |
Yoakum | 271 | 3,119 | 1,424 |
Hutchinson | 448 | 7,848 | 1,418 |
Somervell | 270 | 3,665 | 1,412 |
Leon | 415 | 6,158 | 1,407 |
Lynn | 183 | 1,453 | 1,398 |
Tarrant | 49,800 | 1,015,247 | 1,387 |
Jefferson | 5,735 | 123,417 | 1,369 |
Austin | 1,479 | 13,520 | 1,354 |
Armstrong | 88 | 847 | 1,353 |
Concho | 91 | 1,049 | 1,348 |
Matagorda | 802 | 11,700 | 1,345 |
Karnes | 398 | 6,125 | 1,344 |
Montgomery | 15,457 | 233,763 | 1,343 |
Shackelford | 139 | 1,147 | 1,335 |
Brazoria | 6,879 | 124,586 | 1,334 |
Blanco | 497 | 4,096 | 1,320 |
Scurry | 469 | 6,684 | 1,318 |
Hockley | 593 | 8,648 | 1,295 |
Live Oak | 304 | 3,559 | 1,284 |
Bexar | 44,972 | 935,108 | 1,280 |
Denton | 20,967 | 317,454 | 1,276 |
McMullen | 83 | 536 | 1,272 |
Orange | 1,454 | 25,820 | 1,270 |
Bell | 6,578 | 129,971 | 1,267 |
Howard | 886 | 11,582 | 1,266 |
Coke | 102 | 871 | 1,262 |
Hunt | 1,833 | 33,115 | 1,259 |
Brooks | 150 | 2,214 | 1,254 |
Harrison | 1,422 | 20,950 | 1,252 |
Kenedy | 27 | 247 | 1,252 |
Houston | 948 | 7,814 | 1,246 |
Gaines | 664 | 7,265 | 1,238 |
Atascosa | 933 | 14,305 | 1,234 |
Lee | 459 | 7,970 | 1,226 |
Mitchell | 187 | 2,186 | 1,222 |
Cooke | 1,117 | 16,480 | 1,221 |
Waller | 1,166 | 27,613 | 1,221 |
Galveston | 6,880 | 122,820 | 1,219 |
Frio | 379 | 6,478 | 1,215 |
Pecos | 441 | 5,381 | 1,215 |
Morris | 220 | 3,300 | 1,211 |
Fort Bend | 18,531 | 257,694 | 1,209 |
Kendall | 1,972 | 20,470 | 1,207 |
San Patricio | 1,213 | 21,064 | 1,204 |
McLennan | 5,943 | 122,857 | 1,201 |
Stonewall | 68 | 708 | 1,198 |
Grimes | 616 | 8,374 | 1,195 |
Wise | 1,689 | 21,830 | 1,194 |
Limestone | 400 | 8,749 | 1,188 |
Nueces | 8,380 | 166,681 | 1,184 |
Anderson | 1,606 | 20,748 | 1,177 |
Gray | 555 | 7,551 | 1,177 |
Potter | 3,986 | 78,880 | 1,176 |
Panola | 542 | 7,889 | 1,175 |
Sutton | 157 | 1,144 | 1,174 |
Grayson | 3,243 | 53,145 | 1,167 |
Kinney | 78 | 1,026 | 1,165 |
Cochran | 123 | 688 | 1,162 |
Kerr | 1,543 | 19,523 | 1,161 |
Guadalupe | 2,773 | 48,953 | 1,160 |
Parmer | 340 | 6,471 | 1,159 |
Sterling | 83 | 506 | 1,156 |
Gregg | 4,251 | 75,289 | 1,155 |
Jack | 246 | 2,125 | 1,153 |
Johnson | 4,135 | 60,698 | 1,149 |
Terrell | 49 | 265 | 1,142 |
Robertson | 400 | 5,702 | 1,141 |
Smith | 6,824 | 115,491 | 1,135 |
Crockett | 195 | 1,374 | 1,134 |
Ellis | 4,028 | 64,066 | 1,133 |
Llano | 610 | 5,644 | 1,133 |
Comal | 5,248 | 76,885 | 1,132 |
Jackson | 392 | 5,281 | 1,129 |
Nolan | 417 | 6,162 | 1,129 |
Taylor | 3,844 | 69,221 | 1,126 |
Hemphill | 179 | 1,267 | 1,125 |
Fisher | 114 | 799 | 1,124 |
Tom Green | 3,049 | 49,949 | 1,121 |
Rockwall | 3,417 | 44,095 | 1,115 |
Parker | 3,851 | 42,945 | 1,111 |
Hill | 814 | 12,041 | 1,109 |
Burnet | 1,726 | 16,685 | 1,108 |
Brewster | 438 | 4,464 | 1,105 |
Goliad | 157 | 1,346 | 1,105 |
Dallam | 396 | 4,809 | 1,104 |
Burleson | 434 | 5,191 | 1,102 |
Oldham | 92 | 946 | 1,102 |
Liberty | 1,322 | 20,353 | 1,100 |
Hansford | 229 | 2,074 | 1,098 |
Hays | 6,400 | 98,728 | 1,092 |
Moore | 533 | 12,960 | 1,091 |
Caldwell | 906 | 11,173 | 1,090 |
Presidio | 197 | 2,034 | 1,088 |
Brazos | 5,293 | 125,576 | 1,086 |
Victoria | 2,393 | 36,874 | 1,084 |
Kaufman | 2,716 | 45,814 | 1,078 |
Lubbock | 8,227 | 152,564 | 1,077 |
Bosque | 389 | 3,716 | 1,076 |
Lipscomb | 91 | 1,170 | 1,076 |
Fannin | 650 | 9,070 | 1,073 |
Milam | 515 | 6,126 | 1,072 |
Jim Hogg | 127 | 1,678 | 1,071 |
Hopkins | 969 | 14,785 | 1,070 |
Bowie | 2,436 | 42,364 | 1,069 |
Fayette | 851 | 9,391 | 1,069 |
Gonzales | 543 | 7,337 | 1,067 |
Jones | 343 | 3,169 | 1,062 |
Rusk | 867 | 12,964 | 1,062 |
Kleberg | 633 | 12,002 | 1,059 |
Ochiltree | 384 | 4,038 | 1,058 |
Freestone | 406 | 5,200 | 1,054 |
Baylor | 186 | 1,588 | 1,053 |
Coryell | 996 | 15,285 | 1,053 |
Wharton | 1,148 | 16,059 | 1,053 |
Sherman | 130 | 1,106 | 1,051 |
DeWitt | 564 | 6,866 | 1,047 |
San Augustine | 152 | 2,069 | 1,047 |
Young | 601 | 7,008 | 1,047 |
Falls | 302 | 2,994 | 1,045 |
Dawson | 468 | 4,113 | 1,043 |
King | 27 | 256 | 1,043 |
Shelby | 606 | 8,666 | 1,042 |
Bastrop | 1,848 | 23,396 | 1,040 |
Deaf Smith | 489 | 8,216 | 1,040 |
Hardin | 962 | 12,174 | 1,037 |
Hood | 1,731 | 18,814 | 1,036 |
Walker | 1,161 | 26,059 | 1,036 |
Archer | 243 | 1,896 | 1,032 |
Dickens | 65 | 541 | 1,031 |
Randall | 2,733 | 36,756 | 1,028 |
Colorado | 631 | 7,464 | 1,027 |
Jasper | 649 | 8,899 | 1,026 |
Hartley | 152 | 3,159 | 1,024 |
Polk | 944 | 13,126 | 1,023 |
Cherokee | 884 | 14,807 | 1,019 |
Gillespie | 1,235 | 12,356 | 1,019 |
Wichita | 3,258 | 52,528 | 1,019 |
Callahan | 328 | 3,100 | 1,017 |
Lamar | 1,338 | 21,787 | 1,017 |
Madison | 298 | 4,398 | 1,012 |
Wilson | 927 | 9,447 | 1,009 |
Childress | 232 | 3,038 | 1,007 |
Lampasas | 505 | 5,724 | 1,007 |
Angelina | 1,915 | 34,580 | 1,000 |
Henderson | 1,673 | 20,025 | 1,000 |
Eastland | 547 | 5,749 | 998 |
Navarro | 1,016 | 16,867 | 997 |
Washington | 1,081 | 16,883 | 997 |
Camp | 288 | 3,586 | 995 |
Zavala | 172 | 2,239 | 995 |
Lamb | 401 | 3,984 | 994 |
Terry | 349 | 3,020 | 993 |
Titus | 826 | 15,308 | 993 |
Medina | 909 | 11,350 | 989 |
El Paso | 16,673 | 341,052 | 988 |
Lavaca | 493 | 5,893 | 983 |
Knox | 139 | 1,067 | 981 |
Comanche | 392 | 4,332 | 978 |
Runnels | 267 | 3,080 | 977 |
Schleicher | 87 | 704 | 977 |
Val Verde | 905 | 18,367 | 977 |
Clay | 204 | 1,667 | 974 |
Hale | 831 | 10,750 | 973 |
Erath | 1,289 | 19,181 | 971 |
Brown | 932 | 15,497 | 969 |
Nacogdoches | 1,417 | 21,841 | 967 |
Refugio | 204 | 2,149 | 967 |
Bailey | 234 | 2,365 | 966 |
Jim Wells | 850 | 14,557 | 963 |
McCulloch | 273 | 2,199 | 963 |
Palo Pinto | 737 | 8,533 | 956 |
Mason | 177 | 1,074 | 955 |
Wilbarger | 336 | 5,801 | 955 |
Garza | 171 | 1,369 | 953 |
Tyler | 341 | 4,129 | 952 |
Coleman | 245 | 2,114 | 949 |
Cass | 557 | 7,882 | 948 |
Montague | 512 | 4,809 | 947 |
Upshur | 579 | 7,829 | 946 |
Red River | 244 | 2,870 | 942 |
Bee | 543 | 8,518 | 940 |
Hamilton | 278 | 2,802 | 937 |
Wood | 947 | 10,609 | 934 |
Collingsworth | 114 | 763 | 929 |
Uvalde | 700 | 9,626 | 918 |
Castro | 295 | 2,950 | 914 |
Haskell | 189 | 1,519 | 910 |
Bandera | 511 | 3,636 | 908 |
Webb | 5,966 | 109,330 | 905 |
Floyd | 239 | 1,539 | 903 |
Franklin | 542 | 3,705 | 901 |
Stephens | 312 | 3,287 | 901 |
San Jacinto | 306 | 2,494 | 899 |
Throckmorton | 69 | 387 | 898 |
Van Zandt | 1,120 | 12,626 | 895 |
Kimble | 160 | 1,140 | 893 |
Marion | 167 | 2,199 | 893 |
Wheeler | 195 | 1,691 | 891 |
Aransas | 690 | 6,221 | 889 |
Willacy | 299 | 4,083 | 889 |
Briscoe | 73 | 355 | 888 |
Cameron | 7,167 | 153,513 | 888 |
Swisher | 177 | 1,782 | 887 |
Newton | 135 | 1,232 | 884 |
Hardeman | 123 | 1,343 | 882 |
Sabine | 211 | 2,443 | 879 |
Edwards | 67 | 509 | 878 |
San Saba | 197 | 1,550 | 878 |
Jeff Davis | 90 | 810 | 875 |
Foard | 57 | 383 | 862 |
Rains | 261 | 2,248 | 861 |
Crosby | 170 | 1,063 | 858 |
Maverick | 954 | 18,972 | 856 |
Mills | 160 | 1,345 | 856 |
Trinity | 229 | 2,416 | 843 |
Hidalgo | 14,165 | 293,428 | 836 |
Starr | 673 | 14,810 | 833 |
Delta | 114 | 1,009 | 831 |
Donley | 125 | 870 | 826 |
Roberts | 46 | 168 | 821 |
Duval | 193 | 3,735 | 794 |
Zapata | 171 | 2,981 | 787 |
Kent | 31 | 393 | 774 |
Real | 103 | 804 | 772 |
Hall | 127 | 722 | 747 |
Motley | 62 | 292 | 711 |
Menard | 80 | 431 | 709 |
(1) Average weekly wages were calculated using unrounded data. | |||
Note: Data are preliminary. Dashes indicate data not applicable or available. Covered employment and wages include workers covered by Unemployment Insurance (UI) and Unemployment Compensation for Federal Employees (UCFE) programs. | |||
| State | Establishments, third quarter (thousands) | Employment | Average weekly wage (1) | ||||
|---|---|---|---|---|---|---|---|
| September 2025 (thousands) | Percent change, September 2024–25 | Third quarter 2025 ($) | National ranking by level | Percent change, third quarter 2024–25 | National ranking by percent change | ||
United States (2) | 12,353.8 | 155,767.7 | 0.1 | 1,459 | -- | 4.7 | -- |
Alabama | 165.7 | 2,119.0 | 0.6 | 1,212 | 36 | 3.6 | 38 |
Alaska | 25.3 | 342.4 | -0.1 | 1,455 | 13 | 5.3 | 7 |
Arizona | 228.4 | 3,215.4 | -0.2 | 1,360 | 19 | 4.0 | 31 |
Arkansas | 111.2 | 1,310.5 | 0.5 | 1,135 | 49 | 3.8 | 33 |
California | 1,986.7 | 18,281.7 | 0.3 | 1,815 | 4 | 7.2 | 2 |
Colorado | 252.9 | 2,886.4 | -0.6 | 1,570 | 7 | 5.7 | 3 |
Connecticut | 149.6 | 1,693.8 | 0.1 | 1,604 | 6 | 3.8 | 33 |
Delaware | 46.7 | 480.8 | 0.0 | 1,394 | 17 | 4.8 | 13 |
District of Columbia | 51.5 | 737.4 | -3.1 | 2,393 | 1 | 5.7 | 3 |
Florida | 892.1 | 9,818.1 | -0.2 | 1,342 | 21 | 5.1 | 8 |
Georgia | 397.2 | 4,874.5 | 0.4 | 1,349 | 20 | 3.5 | 43 |
Hawaii | 62.1 | 640.1 | 0.1 | 1,342 | 21 | 3.1 | 48 |
Idaho | 103.7 | 879.8 | 1.3 | 1,180 | 44 | 4.9 | 11 |
Illinois | 386.5 | 6,086.3 | -0.1 | 1,457 | 12 | 4.3 | 23 |
Indiana | 197.1 | 3,198.4 | 0.1 | 1,214 | 35 | 4.3 | 23 |
Iowa | 109.6 | 1,549.3 | -0.9 | 1,194 | 39 | 3.6 | 38 |
Kansas | 102.2 | 1,431.7 | 0.1 | 1,179 | 45 | 3.8 | 33 |
Kentucky | 160.7 | 1,995.4 | -0.4 | 1,176 | 46 | 4.3 | 23 |
Louisiana | 158.7 | 1,913.1 | -0.1 | 1,187 | 42 | 3.3 | 46 |
Maine | 67.4 | 659.2 | -0.2 | 1,231 | 33 | 5.0 | 10 |
Maryland | 199.5 | 2,739.5 | -1.3 | 1,526 | 9 | 3.8 | 33 |
Massachusetts | 293.2 | 3,625.0 | -0.9 | 1,818 | 3 | 4.8 | 13 |
Michigan | 316.0 | 4,423.8 | -0.4 | 1,323 | 25 | 4.5 | 18 |
Minnesota | 214.3 | 2,958.6 | 0.2 | 1,438 | 15 | 3.6 | 38 |
Mississippi | 91.3 | 1,172.6 | 0.0 | 1,005 | 51 | 4.7 | 15 |
Missouri | 256.0 | 2,903.7 | -0.4 | 1,249 | 31 | 4.4 | 21 |
Montana | 64.6 | 518.3 | -0.4 | 1,182 | 43 | 5.1 | 8 |
Nebraska | 78.6 | 1,021.8 | -0.1 | 1,190 | 40 | 3.1 | 48 |
Nevada | 109.5 | 1,581.0 | 1.4 | 1,314 | 27 | 4.3 | 23 |
New Hampshire | 67.3 | 687.8 | -0.6 | 1,481 | 11 | 5.5 | 6 |
New Jersey | 334.9 | 4,301.0 | 0.4 | 1,558 | 8 | 3.6 | 38 |
New Mexico | 69.0 | 876.4 | 0.3 | 1,190 | 40 | 3.2 | 47 |
New York | 720.8 | 9,808.4 | 0.4 | 1,757 | 5 | 4.7 | 15 |
North Carolina | 386.3 | 4,939.4 | 0.5 | 1,328 | 23 | 4.2 | 27 |
North Dakota | 36.7 | 433.8 | -0.5 | 1,291 | 29 | 2.8 | 50 |
Ohio | 346.6 | 5,537.8 | 0.1 | 1,279 | 30 | 3.4 | 44 |
Oklahoma | 128.8 | 1,697.9 | -0.3 | 1,143 | 48 | 4.5 | 18 |
Oregon | 180.5 | 1,994.7 | -1.3 | 1,409 | 16 | 4.2 | 27 |
Pennsylvania | 397.2 | 6,066.3 | 0.2 | 1,383 | 18 | 4.1 | 30 |
Rhode Island | 48.8 | 503.3 | 0.2 | 1,322 | 26 | 4.7 | 15 |
South Carolina | 190.8 | 2,312.3 | 0.7 | 1,198 | 38 | 4.9 | 11 |
South Dakota | 40.9 | 462.9 | 0.1 | 1,146 | 47 | 4.0 | 31 |
Tennessee | 224.2 | 3,255.5 | -1.2 | 1,327 | 24 | 5.7 | 3 |
Texas | 854.9 | 14,062.3 | 0.7 | 1,444 | 14 | 3.6 | 38 |
Utah | 142.4 | 1,745.9 | 1.2 | 1,297 | 28 | 3.8 | 33 |
Vermont | 34.1 | 307.2 | -0.7 | 1,243 | 32 | 4.4 | 21 |
Virginia | 324.0 | 4,142.4 | 0.7 | 1,504 | 10 | 4.2 | 27 |
Washington | 242.3 | 3,639.4 | -0.1 | 1,923 | 2 | 7.7 | 1 |
West Virginia | 62.1 | 701.1 | -0.1 | 1,121 | 50 | 3.4 | 44 |
Wisconsin | 211.6 | 2,949.1 | -0.4 | 1,228 | 34 | 4.5 | 18 |
Wyoming | 31.7 | 285.6 | -1.1 | 1,201 | 37 | 2.0 | 51 |
Puerto Rico | 52.8 | 945.5 | -0.6 | 687 | (3) | 2.7 | (3) |
Virgin Islands | 3.0 | 33.2 | -5.4 | 1,025 | (3) | 4.7 | (3) |
(1) Average weekly wages were calculated using unrounded data. | |||||||
Note: Data are preliminary. Dashes indicate data not applicable or available. Covered employment and wages include workers covered by Unemployment Insurance (UI) and Unemployment Compensation for Federal Employees (UCFE) programs. | |||||||
Last Modified Date: Tuesday, March 17, 2026