An official website of the United States government
An official website of the United States government
The .gov means it's official.
Federal government websites often end in .gov or .mil. Before sharing sensitive information,
make sure you're on a federal government site.
The site is secure.
The
https:// ensures that you are connecting to the official website and that any
information you provide is encrypted and transmitted securely.
16-1270-SAN
Tuesday, June 21, 2016
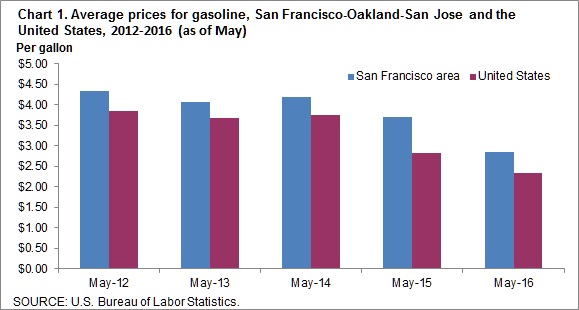
Gasoline prices averaged $2.856 a gallon in the San Francisco-Oakland-San Jose area in May 2016, the U.S. Bureau of Labor Statistics reported today. Assistant Commissioner for Regional Operations Richard Holden noted that area gasoline prices were down 83.6 cents compared to last May when they averaged $3.692 per gallon. San Francisco area households paid an average of 20.2 cents per kilowatt hour (kWh) of electricity in May 2016, down from 23.3 cents per kWh in May 2015. The average cost of utility (piped) gas at $1.397 per therm in May was 8.8 cents less than $1.485 price per therm spent last year. (Data in this release are not seasonally adjusted; accordingly, over-the-year-analysis is used throughout.)
At $2.856 a gallon, San Francisco area consumers paid 22.9 percent more than the $2.324 national average in May 2016. A year earlier, consumers in the San Francisco area paid 30.4 percent more than the national average for a gallon of gasoline. The local price of a gallon of gasoline has ranged from 10.6 to 30.4 percent above the national average in the month of May during the past five years. (See chart 1.)
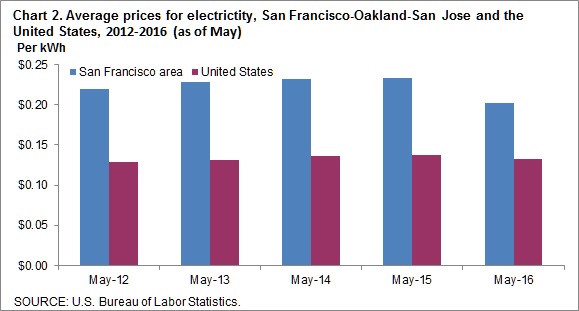
The 20.2 cents per kWh San Francisco households paid for electricity in May 2016 was 51.9 percent more than the nationwide average of 13.3 cents per kWh. Last May, electricity costs were 70.1 percent higher in San Francisco compared to the nation. In each of the past five years, prices paid by San Francisco area consumers for electricity exceeded the U.S. average by at least 51.9 percent in the month of May.(See chart 2.)
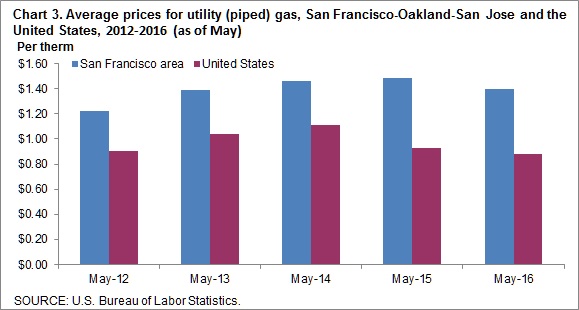
Prices paid by San Francisco area consumers for utility (piped) gas, commonly referred to as natural gas, were $1.397 per therm, or 59.3 percent above the national average in May 2016 ($0.877 per therm). A year earlier, area consumers paid 59.7 percent more per therm for natural gas compared to the nation. In the past five years, the per therm cost for natural gas in May in the San Francisco area has varied between 31.9 percent and 59.7 percent above the U.S. average. (See chart 3.)
The San Francisco-Oakland-San Jose, Calif. metropolitan area consists of Alameda, Contra Costa, Marin, Napa, San Francisco, San Mateo, Santa Clara, Santa Cruz, Solano, and Sonoma Counties in California.Average prices are estimated from Consumer Price Index (CPI) data for selected commodity series to support the research and analytic needs of CPI data users. Average prices for electricity, utility (piped) gas, and gasoline are published monthly for the U.S. city average, the 4 regions, the 3 population size classes, 10 region/size-class cross-classifications, and the 14 largest local index areas. For electricity, average prices per kilowatt-hour (kWh) are published. For utility (piped) gas, average prices per therm, are published. For gasoline, the average price per gallon is published. Average prices for commonly available grades of gasoline are published as well as the average price across all grades.
All eligible prices are converted to a price per normalized quantity. These prices are then used to estimate a price for a defined fixed quantity. The average price per kilowatt-hour represents the total bill divided by the kilowatt-hour usage. The total bill is the sum of all items applicable to all consumers appearing on an electricity bill including, but not limited to, variable rates per kWh, fixed costs, taxes, surcharges, and credits. This calculation also applies to the average price per therm for utility (piped) gas.
Information in this release will be made available to sensory impaired individuals upon request. Voice phone: 202-691-5200; Federal Relay Service: 800-877-8339.
| Year and month | Gasoline per gallon | Electricity per kWh | Utility (piped) gas per therm | |||
|---|---|---|---|---|---|---|
| San Francisco area | United States | San Francisco area | United States | San Francisco area | United States | |
| 2015 | ||||||
May | $3.692 | $2.832 | $0.233 | $0.137 | $1.485 | $0.930 |
June | 3.465 | 2.889 | 0.233 | 0.143 | 1.574 | 0.942 |
July | 3.523 | 2.893 | 0.233 | 0.142 | 1.497 | 0.933 |
August | 3.389 | 2.745 | 0.233 | 0.142 | 1.577 | 0.932 |
September | 3.065 | 2.463 | 0.227 | 0.141 | 1.499 | 0.921 |
October | 2.856 | 2.357 | 0.227 | 0.136 | 1.499 | 0.909 |
November | 2.769 | 2.249 | 0.172 | 0.134 | 1.227 | 0.903 |
December | 2.688 | 2.125 | 0.172 | 0.133 | 1.235 | 0.892 |
| 2016 | ||||||
January | 2.668 | 2.034 | 0.187 | 0.134 | 1.299 | 0.898 |
February | 2.440 | 1.833 | 0.187 | 0.134 | 1.331 | 0.895 |
March | 2.618 | 2.021 | 0.191 | 0.134 | 1.070 | 0.884 |
April | 2.769 | 2.196 | 0.190 | 0.134 | 1.368 | 0.879 |
May | 2.856 | 2.324 | 0.202 | 0.133 | 1.397 | 0.877 |
Last Modified Date: Tuesday, June 21, 2016