An official website of the United States government
An official website of the United States government
The .gov means it's official.
Federal government websites often end in .gov or .mil. Before sharing sensitive information,
make sure you're on a federal government site.
The site is secure.
The
https:// ensures that you are connecting to the official website and that any
information you provide is encrypted and transmitted securely.
16-77-SAN
Wednesday, January 27, 2016
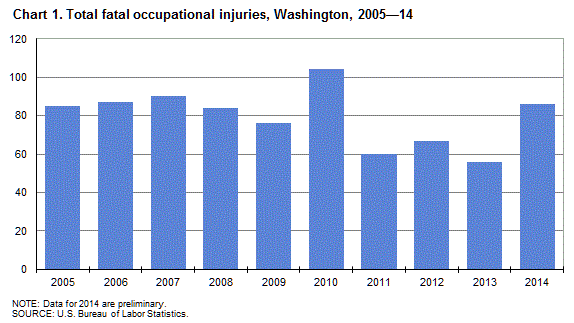
Fatal work injuries totaled 86 in 2014 for Washington, the U.S. Bureau of Labor Statistics reported today. Regional Commissioner Richard J. Holden noted that while the 2014 count was preliminary, the number of work-related fatalities in Washington increased by 30 over the year. Fatal occupational injuries in the state have ranged from a high of 128 in 1996 to a low of 56 in 2013. (See chart 1.)
Nationwide, a preliminary total of 4,679 fatal work injuries were recorded in 2014, down from a revised count of 4,585 fatalities in 2013, according to results from the Census of Fatal Occupational Injuries (CFOI) program. Final 2014 CFOI data will be released in the late spring of 2016.
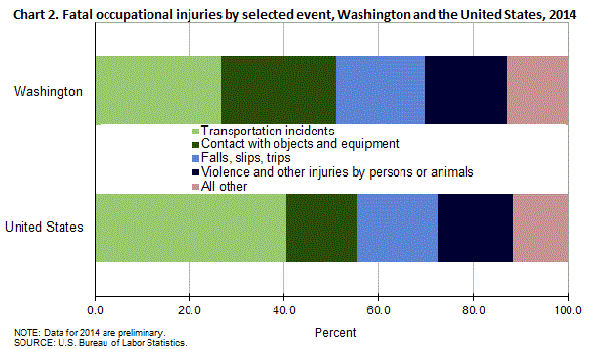
Of the 86 fatal work injuries reported in Washington in 2014, 23 resulted from transportation incidents and 21 from contact with objects and equipment. Together these two major categories accounted for over half of all fatal work injuries reported in the state. (See table 1.) Other major event categories each reported 16 or fewer deaths. Within transportation incidents, roadway incidents involving motorized land vehicles was the most frequent type of workplace fatality with 9 deaths. This category accounted for 10 percent of all on-the-job fatalities in the state. In the contact with objects and equipment category, 14 of the 21 deaths occurred as a result of being struck by an object or equipment. (Note that transportation counts presented in this release are expected to rise when updated 2014 data are released in the late spring of 2016 because key source documentation detailing specific transportation-related incidents has not yet been received.)
In the United States, transportation incidents were also the most frequent fatal workplace event in 2014, accounting for 40 percent of fatal work injuries. In Washington, transportation incidents accounted for 27 percent of the state’s share of fatalities. (See chart 2.) Falls, slips, or trips was the second most frequent type of event nationally, with 17 percent of work-related fatalities; the share in Washington was 18 percent. Contact with objects or equipment and violence and other injury by persons or animals each accounted for 15 and 16 percent of the nation’s workplace fatalities, while in the state, these events were responsible for 24 and 17 percent of workplace fatalities, respectively.
Additional highlights:Background of the program. The Census of Fatal Occupational Injuries, part of the BLS occupational safety and health statistics program, compiles a count of all fatal work injuries occurring in the United States during the calendar year. The program uses diverse state, federal, and independent data sources to identify, verify, and describe fatal work injuries. This assures counts are as complete and accurate as possible.
For technical information about the CFOI program, please go to the BLS Handbook of Methods on the BLS web site at www.bls.gov/opub/hom/pdf/homch9.pdf.
Federal/State agency coverage. The Census of Fatal Occupational Injuries includes data for all fatal work injuries, whether the decedent was working in a job covered by the Occupational Safety and Health Administration (OSHA) or other federal or state agencies or was outside the scope of regulatory coverage. Thus, any comparison between the BLS fatality census counts and those released by other agencies should take into account the different coverage requirements and definitions being used by each agency.
Acknowledgments. The Bureau of Labor Statistics appreciates the efforts of all federal, state, local, and private sector entities that submitted source documents used to identify fatal work injuries.
Information in this release will be made available to sensory impaired individuals upon request. Voice phone: (202) 691-5200; Federal Relay Service: (800) 877-8339.
| Event or exposure (1) | 2013 (2) | 2014 (p) | |
|---|---|---|---|
| Number | Number | Percent | |
Total | 56 | 86 | 100 |
Violence and other injuries by persons or animals | 8 | 15 | 17 |
Intentional injury by person | 6 | 13 | 15 |
Homicides (Intentional injury by other person) | -- | 8 | 9 |
Shooting by other person--intentional | -- | 5 | 6 |
Suicides (Self-inflicted injury--intentional) | 4 | 5 | 6 |
Hanging, strangulation, asphyxiation--intentional self-harm | -- | 3 | 3 |
Transportation incidents | 23 | 23 | 27 |
Pedestrian vehicular incident | 3 | 5 | 6 |
Roadway incidents involving motorized land vehicle | 11 | 9 | 10 |
Roadway collision with object other than vehicle | -- | 3 | 3 |
Vehicle struck object or animal on side of roadway | -- | 3 | 3 |
Roadway noncollision incident | -- | 3 | 3 |
Nonroadway incident involving motorized land vehicles | 4 | 5 | 6 |
Nonroadway noncollision incident | 4 | 3 | 3 |
Jack-knifed or overturned, nonroadway | 3 | 3 | 3 |
Falls, slips, trips | 10 | 16 | 19 |
Falls to lower level | 6 | 14 | 16 |
Other fall to lower level | 6 | 13 | 15 |
Other fall to lower level more than 30 feet | -- | 5 | 6 |
Exposure to harmful substances or environments | 3 | 9 | 10 |
Exposure to other harmful substances | -- | 5 | 6 |
Nonmedical use of drugs or alcohol--unintentional overdose | -- | 5 | 6 |
Contact with objects and equipment | 11 | 21 | 24 |
Struck by object or equipment | 7 | 14 | 16 |
Struck by falling object or equipment--other than powered vehicle | 3 | 8 | 9 |
Caught in or compressed by equipment or objects | -- | 3 | 3 |
Footnotes: | |||
NOTE: Totals for major categories may include subcategories not shown separately. Percentages may not add to totals because of rounding. CFOI fatality counts exclude illness-related deaths unless precipitated by an injury event. Dashes indicate no data reported or data that do not meet publication guidelines. | |||
| Industry (1) | 2013 (2) | 2014 (p) | |
|---|---|---|---|
| Number | Number | Percent | |
Total | 56 | 86 | 100 |
Private industry | 46 | 81 | 94 |
Natural resources and mining | 11 | 19 | 22 |
Agriculture, forestry, fishing and hunting | 10 | 19 | 22 |
Crop production | 4 | 4 | 5 |
Animal production and aquaculture | -- | 2 | 2 |
Forestry and logging | 3 | 9 | 10 |
Support activities for agriculture and forestry | -- | 3 | 3 |
Construction | 7 | 17 | 20 |
Construction | 7 | 17 | 20 |
Construction of buildings | -- | 3 | 3 |
Specialty trade contractors | 4 | 12 | 14 |
Manufacturing | 3 | 3 | 3 |
Manufacturing | 3 | 3 | 3 |
Trade, transportation, and utilities | 13 | 22 | 26 |
Retail trade | -- | 9 | 10 |
Transportation and warehousing | 11 | 10 | 12 |
Truck transportation | 7 | 6 | 7 |
Financial activities | -- | 3 | 3 |
Professional and business services | 5 | 8 | 9 |
Administrative and waste services | 4 | 8 | 9 |
Administrative and support services | 4 | 8 | 9 |
Educational and health services | -- | 3 | 3 |
Health care and social assistance | -- | 3 | 3 |
Leisure and hospitality | 1 | 4 | 5 |
Arts, entertainment, and recreation | -- | 3 | 3 |
Museums, historical sites, and similar institutions | -- | 1 | 1 |
Amusement, gambling, and recreation industries | -- | 3 | 3 |
Government (3) | 10 | 5 | 6 |
Local government | 3 | 3 | 3 |
Footnotes: | |||
NOTE: Totals for major categories may include subcategories not shown separately. Percentages may not add to totals because of rounding. CFOI fatality counts exclude illness-related deaths unless precipitated by an injury event. Dashes indicate no data reported or data that do not meet publication criteria. | |||
| Occupation (1) | 2013 (2) | 2014 (p) | |
|---|---|---|---|
| Number | Number | Percent | |
Total | 56 | 86 | 100 |
Management occupations | 6 | 6 | 7 |
Other management occupations | 5 | 5 | 6 |
Farmers, ranchers, and other agricultural managers | -- | 3 | 3 |
Farmers, ranchers, and other agricultural managers | -- | 3 | 3 |
Arts, design, entertainment, sports, and media occupations | -- | 1 | 1 |
Media and communication equipment workers | -- | 1 | 1 |
Television, video, and motion picture camera operators and editors | -- | 1 | 1 |
Camera operators, television, video, and motion picture | -- | 1 | 1 |
Protective service occupations | -- | 3 | 3 |
Building and grounds cleaning and maintenance occupations | 3 | 6 | 7 |
Grounds maintenance workers | -- | 4 | 5 |
Grounds maintenance workers | -- | 4 | 5 |
Personal care and service occupations | -- | 4 | 5 |
Sales and related occupations | -- | 5 | 6 |
Retail sales workers | -- | 3 | 3 |
Retail salespersons | -- | 3 | 3 |
Retail salespersons | -- | 3 | 3 |
Farming, fishing, and forestry occupations | 8 | 13 | 15 |
Forest, conservation, and logging workers | 4 | 8 | 9 |
Logging workers | 3 | 8 | 9 |
Fallers | 3 | 3 | 3 |
Construction and extraction occupations | 6 | 14 | 16 |
Supervisors of construction and extraction workers | 3 | 3 | 3 |
First-line supervisors of construction trades and extraction workers | 3 | 3 | 3 |
First-line supervisors of construction trades and extraction workers | 3 | 3 | 3 |
Construction trades workers | 3 | 11 | 13 |
Installation, maintenance, and repair occupations | 8 | 8 | 9 |
Other installation, maintenance, and repair occupations | 4 | 7 | 8 |
Miscellaneous installation, maintenance, and repair workers | -- | 1 | 1 |
Commercial divers | -- | 1 | 1 |
Transportation and material moving occupations | 9 | 18 | 21 |
Motor vehicle operators | 8 | 11 | 13 |
Driver/sales workers and truck drivers | 6 | 11 | 13 |
Heavy and tractor-trailer truck drivers | 6 | 10 | 12 |
Material moving workers | -- | 4 | 5 |
Laborers and material movers, hand | -- | 3 | 3 |
Laborers and freight, stock, and material movers, hand | -- | 3 | 3 |
Footnotes: | |||
NOTE: Totals for major categories may include subcategories not shown separately. Percentages may not add to totals because of rounding. CFOI fatality counts exclude illness-related deaths unless precipitated by an injury event. Dashes indicate no data reported or data that do not meet publication criteria. | |||
| Worker characteristics | 2013 (1) | 2014 (p) | |
|---|---|---|---|
| Number | Number | Percent | |
Total | 56 | 86 | 100 |
Employee status | |||
Wage and salary (2) | 41 | 74 | 86 |
Self-employed (3) | 15 | 12 | 14 |
Gender | |||
Men | 51 | 81 | 94 |
Women | 5 | 5 | 6 |
Age (4) | |||
18 to 19 years | -- | 3 | 3 |
20 to 24 years | -- | 4 | 5 |
25 to 34 years | 10 | 15 | 17 |
35 to 44 years | 11 | 12 | 14 |
45 to 54 years | 16 | 19 | 22 |
55 to 64 years | 9 | 22 | 26 |
65 years and over | 9 | 11 | 13 |
Race or ethnic origin (5) | |||
White, non-Hispanic | 48 | 70 | 81 |
Hispanic or Latino | 4 | 7 | 8 |
Asian, non-Hispanic | -- | 5 | 6 |
Footnotes: | |||
NOTE: Totals for major categories may include subcategories not shown separately. Percentages may not add to totals because of rounding. CFOI fatality counts exclude illness-related deaths unless precipitated by an injury event. Dashes indicate no data reported or data that do not meet publication criteria. | |||
Last Modified Date: Wednesday, January 27, 2016