An official website of the United States government
An official website of the United States government
The .gov means it's official.
Federal government websites often end in .gov or .mil. Before sharing sensitive information,
make sure you're on a federal government site.
The site is secure.
The
https:// ensures that you are connecting to the official website and that any
information you provide is encrypted and transmitted securely.
19-234-SAN
Friday, February 08, 2019
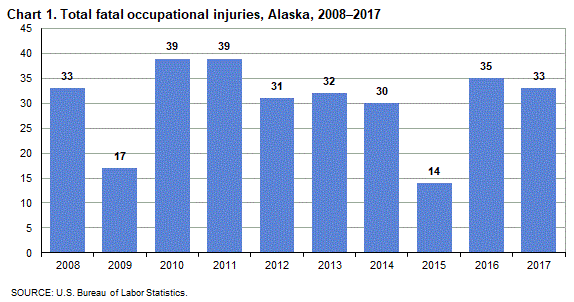
Fatal work injuries totaled 33 in 2017 for Alaska, the U.S. Bureau of Labor Statistics reported today. Assistant Commissioner for Regional Operations Richard Holden noted that the number of work-related fatalities in Alaska was was little changed from the previous year. Fatal occupational injuries in the state have ranged from a high of 91 in 1992 to a low of 14 in 2015. (See chart 1.)
Nationwide, a total of 5,147 fatal work injuries were recorded in 2017, down slightly from the 5,190 fatal injuries in 2016, according to the results from the Census of Fatal Occupational Injuries (CFOI) program.
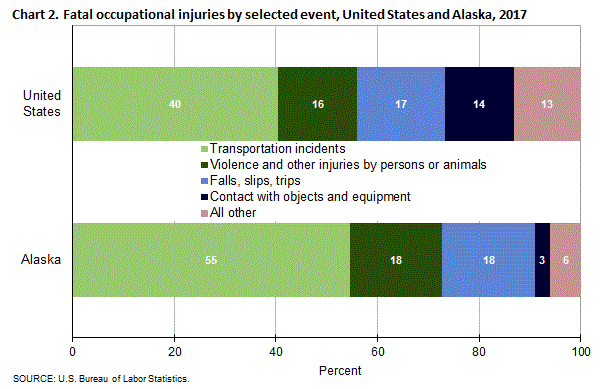
Type of incidentIn Alaska, transportation incidents resulted in 18 fatal work injuries, accounting for 55 percent of all workplace fatalities in the state. (See table 1.) The number of worker deaths from transportation incidents fell by six over the year.
Violence and other injuries by persons or animals, along with falls, slips, or trips were the second most frequent fatal work event with six fatalities each. Violence and other injuries by persons or animals resulted in one fewer work-related death than in 2016, while fatalities from falls, slips, or trips rose by six
Nationally, transportation incidents were the most frequent fatal workplace event in 2017, accounting for 40 percent of fatal work injuries. (See chart 2.) Falls, slips, or trips was the second-most common fatal event (17 percent), followed by violence and other injuries by persons or animals (16 percent).
IndustryThe private agriculture, forestry, fishing, and hunting industry sector had the highest number of fatalities in Alaska with 16, compared to 4 in the previous year. (See table 2.) Transportation incidents were the most frequent fatal event in the sector with 12 worker deaths. Fourteen of those fatally injured worked in fishing.
The private transportation and warehousing sector had three workplace fatalities in 2017. Air transportation accounted for all of the fatalities in this industry.
OccupationFarming, fishing, and forestry occupations had the highest number of workplace fatalities with 14. (See table 3.) Thirteen of these fatalities were fishers and related fishing workers.
Additional highlights:Background of the program. The Census of Fatal Occupational Injuries (CFOI), part of the BLS Occupational Safety and Health Statistics (OSHS) program, compiles a count of all fatal work injuries occurring in the U.S. during the calendar year. The CFOI program uses diverse state, federal, and independent data sources to identify, verify, and describe fatal work injuries. This ensures counts are as complete and accurate as possible. For the 2016 national data, over 23,300 unique source documents were reviewed as part of the data collection process. For technical information and definitions for CFOI, please go to the BLS Handbook of Methods on the BLS website at www.bls.gov/opub/hom/pdf/homch9.pdf.
Federal/State agency coverage. The CFOI includes data for all fatal work injuries, even those that may be outside the scope of other agencies or regulatory coverage. Thus, any comparison between the BLS fatality census counts and those released by other agencies should take into account the different coverage requirements and definitions being used by each agency. More on the scope of CFOI can be found at www.bls.gov/iif/cfoiscope.htm.
Acknowledgments. BLS appreciates the efforts of all federal, state, local, and private sector entities that provided source documents used to identify fatal work injuries. Among these agencies are the Occupational Safety and Health Administration; the National Transportation Safety Board; the U.S. Coast Guard; the Mine Safety and Health Administration; the Office of Workers’ Compensation Programs (Federal Employees' Compensation and Longshore and Harbor Workers' Compensation divisions); the Federal Railroad Administration; the National Highway Traffic Safety Administration; state vital statistics registrars, coroners, and medical examiners; state departments of health, labor, and industrial relations and workers' compensation agencies; state and local police departments; and state farm bureaus.
Information in this release will be made available to sensory impaired individuals upon request. Voice phone: (202) 691-5200. Federal Relay Service: (800) 877-8339.
| Event or exposure (1) | 2016 | 2017 | |
|---|---|---|---|
| Number | Number | Percent | |
Total | 35 | 33 | 100 |
Violence and other injuries by persons or animals | 7 | 6 | 18 |
Intentional injury by person | 6 | 5 | 15 |
Homicides (Intentional injury by other person) | 2 | 3 | 9 |
Shooting by other person--intentional | 2 | 3 | 9 |
Suicides (Self-inflicted injury--intentional) | 4 | -- | -- |
Shooting--intentional self-harm | -- | 1 | 3 |
Animal and insect related incidents | -- | 1 | 3 |
Struck by animal | -- | 1 | 3 |
Mauled, clawed, or scratched by animal | -- | 1 | 3 |
Transportation incidents | 24 | 18 | 55 |
Aircraft incidents | 13 | 4 | 12 |
Other in-flight crash | 13 | 4 | 12 |
Other in-flight crash into structure, object, or ground | 6 | 4 | 12 |
Water vehicle incidents | 5 | 12 | 36 |
Capsized or sinking water vehicle | -- | 8 | 24 |
Fall or jump from water vehicle | 2 | 4 | 12 |
Nonroadway incident involving motorized land vehicles | -- | 1 | 3 |
Nonroadway noncollision incident | -- | 1 | 3 |
Jack-knifed or overturned, nonroadway | -- | 1 | 3 |
Falls, slips, trips | -- | 6 | 18 |
Falls to lower level | -- | 5 | 15 |
Other fall to lower level | -- | 5 | 15 |
Other fall to lower level 11 to 15 feet | -- | 2 | 6 |
Contact with objects and equipment | -- | 1 | 3 |
Struck by object or equipment | -- | 1 | 3 |
Struck by falling object or equipment--other than powered vehicle | -- | 1 | 3 |
Footnotes: | |||
NOTE: Data for all years are final. Totals for major categories may include subcategories not shown separately. Percentages may not add to totals because of rounding. CFOI fatality counts exclude illness-related deaths unless precipitated by an injury event. Dashes indicate no data reported or data that do not meet publication criteria. | |||
| Industry (1) | 2016 | 2017 | |
|---|---|---|---|
| Number | Number | Percent | |
Total | 35 | 33 | 100 |
Private industry | 29 | 31 | 94 |
Natural resources and mining | 4 | 16 | 48 |
Agriculture, forestry, fishing and hunting | 4 | 16 | 48 |
Fishing, hunting and trapping | 3 | 14 | 42 |
Fishing | 3 | 14 | 42 |
Fishing | 3 | 14 | 42 |
Finfish fishing | 3 | 7 | 21 |
Shellfish fishing | -- | 7 | 21 |
Trade, transportation, and utilities | 10 | 6 | 18 |
Wholesale trade | -- | 1 | 3 |
Merchant wholesalers, nondurable goods | -- | 1 | 3 |
Miscellaneous nondurable goods merchant wholesalers | -- | 1 | 3 |
Paint, varnish, and supplies merchant wholesalers | -- | 1 | 3 |
Retail trade | -- | 2 | 6 |
Building material and garden equipment and supplies dealers | -- | 1 | 3 |
Building material and supplies dealers | -- | 1 | 3 |
Clothing and clothing accessories stores | -- | 1 | 3 |
Jewelry, luggage, and leather goods stores | -- | 1 | 3 |
Jewelry stores | -- | 1 | 3 |
Transportation and warehousing | 10 | 3 | 9 |
Air transportation | 6 | 3 | 9 |
Scheduled air transportation | 3 | 1 | 3 |
Scheduled air transportation | 3 | 1 | 3 |
Scheduled passenger air transportation | 3 | 1 | 3 |
Nonscheduled air transportation | 3 | 2 | 6 |
Nonscheduled air transportation | 3 | 2 | 6 |
Nonscheduled chartered passenger air transportation | 3 | 1 | 3 |
Nonscheduled chartered freight air transportation | -- | 1 | 3 |
Professional and business services | 6 | -- | -- |
Professional and technical services | 6 | 1 | 3 |
Professional, scientific, and technical services | 6 | 1 | 3 |
Management, scientific, and technical consulting services | -- | 1 | 3 |
Environmental consulting services | -- | 1 | 3 |
Educational and health services | -- | 1 | 3 |
Health care and social assistance | -- | 1 | 3 |
Social assistance | -- | 1 | 3 |
Community food and housing, and emergency and other relief services | -- | 1 | 3 |
Community food services | -- | 1 | 3 |
Other services, except public administration | 1 | -- | -- |
Other services, except public administration | 1 | -- | -- |
Religious, grantmaking, civic, professional, and similar organizations | -- | 1 | 3 |
Religious organizations | -- | 1 | 3 |
Government (2) | 6 | -- | -- |
Federal government | 2 | 1 | 3 |
Footnotes: | |||
NOTE: Data for all years are final. Totals for major categories may include subcategories not shown separately. Percentages may not add to totals because of rounding. CFOI fatality counts exclude illness-related deaths unless precipitated by an injury event. Dashes indicate no data reported or data that do not meet publication criteria. | |||
| Occupation (1) | 2016 | 2017 | |
|---|---|---|---|
| Number | Number | Percent | |
Total | 35 | 33 | 100 |
Management occupations | -- | 1 | 3 |
Top executives | -- | 1 | 3 |
Chief executives | -- | 1 | 3 |
Chief executives | -- | 1 | 3 |
Life, physical, and social science occupations | -- | 1 | 3 |
Life scientists | -- | 1 | 3 |
Biological scientists | -- | 1 | 3 |
Community and social service occupations | -- | -- | -- |
Religious workers | -- | 1 | 3 |
Directors, religious activities and education | -- | 1 | 3 |
Directors, religious activities and education | -- | 1 | 3 |
Sales and related occupations | -- | 3 | 9 |
Supervisors of sales workers | -- | 3 | 9 |
First-line supervisors of sales workers | -- | 3 | 9 |
First-line supervisors of non-retail sales workers | -- | 1 | 3 |
Farming, fishing, and forestry occupations | 4 | 14 | 42 |
Fishing and hunting workers | 3 | 13 | 39 |
Fishers and related fishing workers | 3 | 13 | 39 |
Fishers and related fishing workers | 3 | 13 | 39 |
Construction and extraction occupations | -- | 4 | 12 |
Construction trades workers | -- | 4 | 12 |
Construction equipment operators | -- | 1 | 3 |
Operating engineers and other construction equipment operators | -- | 1 | 3 |
Transportation and material moving occupations | 11 | 4 | 12 |
Air transportation workers | 8 | 3 | 9 |
Aircraft pilots and flight engineers | 8 | 3 | 9 |
Airline pilots, copilots, and flight engineers | 3 | 1 | 3 |
Commercial pilots | 5 | 2 | 6 |
Water transportation workers | 2 | 1 | 3 |
Ship and boat captains and operators | 1 | 1 | 3 |
Captains, mates, and pilots of water vessels | 1 | 1 | 3 |
Footnotes: | |||
NOTE: Data for all years are final. Totals for major categories may include subcategories not shown separately. Percentages may not add to totals because of rounding. CFOI fatality counts exclude illness-related deaths unless precipitated by an injury event. Dashes indicate no data reported or data that do not meet publication criteria. | |||
| Worker characteristics | 2016 | 2017 | |
|---|---|---|---|
| Number | Number | Percent | |
Total | 35 | 33 | 100 |
Employee status | |||
Wage and salary workers (1) | 32 | 25 | 76 |
Self-employed (2) | 3 | 8 | 24 |
Gender | |||
Men | 32 | 31 | 94 |
Women | -- | 2 | 6 |
Age (3) | |||
18 to 19 years | -- | 1 | 3 |
20 to 24 years | 4 | 2 | 6 |
25 to 34 years | 5 | 9 | 27 |
35 to 44 years | 11 | 5 | 15 |
45 to 54 years | 4 | 4 | 12 |
55 to 64 years | 7 | 8 | 24 |
65 years and over | -- | 4 | 12 |
Race or ethnic origin (4) | |||
White (non-Hispanic) | 24 | 22 | 67 |
American Indian or Alaska Native (non-Hispanic) | 4 | 3 | 9 |
Footnotes: | |||
NOTE: Data for all years are final. Totals for major categories may include subcategories not shown separately. Percentages may not add to totals because of rounding. CFOI fatality counts exclude illness-related deaths unless precipitated by an injury event. Dashes indicate no data reported or data that do not meet publication criteria. | |||
Last Modified Date: Friday, February 08, 2019