An official website of the United States government
An official website of the United States government
The .gov means it's official.
Federal government websites often end in .gov or .mil. Before sharing sensitive information,
make sure you're on a federal government site.
The site is secure.
The
https:// ensures that you are connecting to the official website and that any
information you provide is encrypted and transmitted securely.
22-519-SAN
Thursday, March 24, 2022
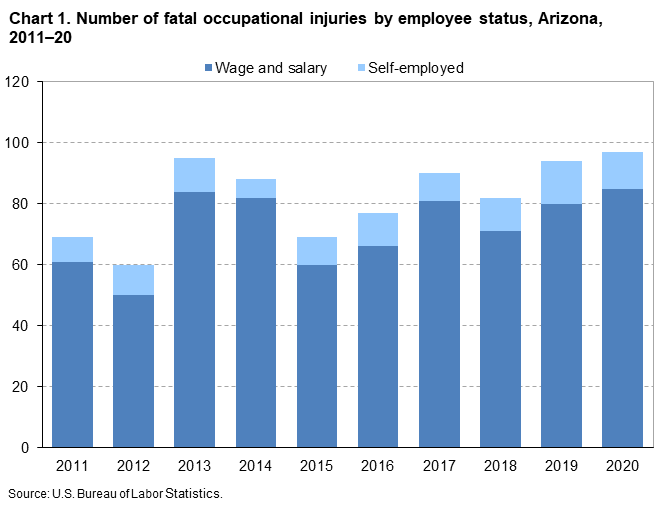
Fatal work injuries totaled 97 in 2020 for Arizona, the U.S. Bureau of Labor Statistics reported today. Regional Commissioner Chris Rosenlund noted that the number of work-related fatalities in Arizona was up from the previous year. (See chart 1.) Fatal occupational injuries in the state have ranged from a high of 118 in 2000 to a low of 55 in 1993.
Nationwide, a total of 4,764 fatal work injuries were recorded in 2020, an 11-percent decrease from 5,333 in 2019, according to the results from the Census of Fatal Occupational Injuries (CFOI). The 4,764 fatal occupational injuries in 2020 represents the lowest annual number since 2013.
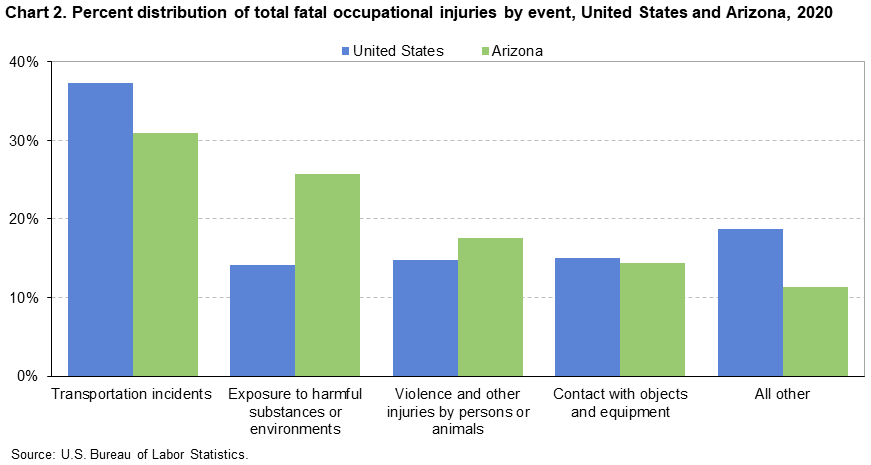
Fatal event or exposureIn Arizona, transportation incidents resulted in 30 fatal work injuries and exposure to harmful substances or environments accounted for 25 fatalities. These two major categories accounted for 57 percent of all fatal workplace injuries in the state. (See chart 2 and table 1.) Worker deaths from transportation incidents were down from 39 over the year and worker fatalities due to exposure to harmful substances or environments were up from 10.
Violence and other injuries by persons or animals was the third-most frequent fatal work event with 17 fatalities, up from 14 in the prior year. Contact with objects or equipment resulted in 14 work-related deaths compared to 11 in 2019.
Nationally, transportation incidents were the most frequent fatal workplace event in 2020, accounting for 37 percent of fatal work injuries. Falls, slips, and trips was the second-most common fatal event (17 percent).
IndustryThe private transportation and warehousing industry sector had the highest number of fatalities in Arizona with 22. (See table 2.) Transportation incidents resulted in 16 of the 22 fatalities in the industry. The general freight trucking industry group accounted for 12 of the 22 fatal workplace injuries in the transportation and warehousing industry.
The private construction industry sector had 20 fatal workplace injuries. The construction of buildings subsector accounted for seven, or 35 percent, of the fatal injuries in this industry.
OccupationThe transportation and material moving occupational group had the highest number of fatal workplace injuries with 28. (See table 3.) Motor vehicle operators accounted for 22 of the 28 fatalities among transportation and material moving workers. The construction and extraction occupational group had the second highest number of fatal workplace injuries with 25. Construction laborers suffered eight of the work-related deaths within the construction and extraction occupational group.
Additional highlights:CFOI reports fatal workplace injuries only. These may include fatal workplace injuries complicated by an illness such as COVID-19. Fatal workplace illnesses not precipitated by an injury are not in scope for CFOI. CFOI does not report any illness related information, including COVID-19. Additional information is available at www.bls.gov/covid19/effects-of-covid-19-on-workplace-injuries-and-illnesses-compensation-and-occupational-requirements.htm.
Background of the program. The Census of Fatal Occupational Injuries (CFOI), part of the Bureau of Labor Statistics (BLS) Occupational Safety and Health Statistics (OSHS) program, is a count of all fatal work injuries occurring in the U.S. during the calendar year. The CFOI uses a variety of state, federal, and independent data sources to identify, verify, and describe fatal work injuries. This ensures counts are as complete and accurate as possible. For the 2020 national data, over 21,600 unique source documents were reviewed as part of the data collection process. For technical information and definitions for the CFOI, see the BLS Handbook of Methods on the BLS website at www.bls.gov/opub/hom/cfoi/home.htm and the CFOI definitions at www.bls.gov/iif/oshcfdef.htm.
Federal/State agency coverage. The CFOI includes data for all fatal work injuries, some of which may be outside the scope of other agencies or regulatory coverage. Comparisons between CFOI counts and those released by other agencies should account for the different coverage requirements and definitions used by each agency. For more information on the scope of CFOI, see www.bls.gov/iif/cfoiscope.htm and www.bls.gov/opub/hom/cfoi/concepts.htm.
Acknowledgments. BLS thanks the Industrial Commission of Arizona for their efforts in collecting accurate, comprehensive, and useful data on fatal work injuries. BLS also appreciates the efforts of all federal, state, local, and private sector entities that provided source documents used to identify fatal work injuries. Among these agencies are the Occupational Safety and Health Administration; the National Transportation Safety Board; the U.S. Coast Guard; the Mine Safety and Health Administration; the Office of Workers’ Compensation Programs (Federal Employees' Compensation and Longshore and Harbor Workers' Compensation divisions); the Federal Railroad Administration; the National Highway Traffic Safety Administration; state vital statistics registrars, coroners, and medical examiners; state departments of health, labor, and industrial relations and workers' compensation agencies; state and local police departments; and state farm bureaus.
Information in this release will be made available to individuals with sensory impairments upon request. Voice phone: (202) 691-5200; Telecommunications Relay Service: 7-1-1.
| Event or exposure (1) | 2019 | 2020 | |
|---|---|---|---|
| Number | Number | Percent | |
Total | 94 | 97 | 100 |
Violence and other injuries by persons or animals | 14 | 17 | 18 |
Intentional injury by person | 12 | 15 | 15 |
Injury by person--unintentional or intent unknown | -- | 1 | 1 |
Animal and insect related incidents | -- | 1 | 1 |
Struck by animal | -- | 1 | 1 |
Trampled by or stepped on by animal | -- | 1 | 1 |
Transportation incidents | 39 | 30 | 31 |
Roadway incidents involving motorized land vehicle | 21 | 18 | 19 |
Roadway collision with other vehicle | 16 | 9 | 9 |
Roadway collision--moving perpendicularly | -- | 1 | 1 |
Roadway collision with object other than vehicle | 3 | 5 | 5 |
Vehicle struck object or animal on side of roadway | 3 | 5 | 5 |
Roadway noncollision incident | -- | 4 | 4 |
Jack-knifed or overturned, roadway | -- | 4 | 4 |
Nonroadway incident involving motorized land vehicles | 5 | 5 | 5 |
Falls, slips, trips | 18 | 9 | 9 |
Exposure to harmful substances or environments | 10 | 25 | 26 |
Exposure to temperature extremes | -- | 6 | 6 |
Exposure to environmental heat | -- | 6 | 6 |
Exposure to other harmful substances | 6 | 14 | 14 |
Nonmedical use of drugs or alcohol--unintentional overdose | -- | 14 | 14 |
Contact with objects and equipment | 11 | 14 | 14 |
Struck by object or equipment | 5 | 8 | 8 |
Struck by powered vehicle--nontransport | -- | 5 | 5 |
Struck by falling object or equipment--other than powered vehicle | -- | 3 | 3 |
Footnotes: | |||
NOTE: Data for all years are final. Totals for major categories may include subcategories not shown separately. For complete information on how the data are coded and presented see our definitions page at https://www.bls.gov/iif/oshcfdef.htm. Dashes indicate no data reported or data that do not meet publication criteria. CFOI fatal injury counts exclude illness-related deaths unless precipitated by an injury event. | |||
| Industry (1) | 2019 | 2020 | |
|---|---|---|---|
| Number | Number | Percent | |
Total | 94 | 97 | 100 |
Private industry (2) | 83 | 85 | 88 |
Goods producing | -- | -- | -- |
Natural resources and mining | 5 | -- | -- |
Agriculture, forestry, fishing and hunting | 5 | 3 | 3 |
Construction | 23 | 20 | 21 |
Construction | 23 | 20 | 21 |
Construction of buildings | -- | 7 | 7 |
Residential building construction | -- | 4 | 4 |
Residential building construction | -- | 4 | 4 |
Service providing (3) | -- | -- | -- |
Trade, transportation, and utilities | -- | -- | -- |
Retail trade | -- | 7 | 7 |
Sporting goods, hobby, musical instrument, and book stores | -- | 1 | 1 |
Transportation and warehousing | 19 | 22 | 23 |
Air transportation | -- | 2 | 2 |
Nonscheduled air transportation | -- | 2 | 2 |
Nonscheduled air transportation | -- | 2 | 2 |
Truck transportation | 12 | 18 | 19 |
General freight trucking | 11 | 12 | 12 |
General freight trucking, long-distance | 9 | 10 | 10 |
General freight trucking, long-distance, truckload | 7 | 7 | 7 |
Specialized freight trucking | 1 | 6 | 6 |
Specialized freight (except used goods) trucking, long-distance | 1 | 4 | 4 |
Professional and business services | 8 | -- | -- |
Administrative and support and waste management and remediation services | 8 | 8 | 8 |
Administrative and support services | 6 | 8 | 8 |
Investigation and security services | -- | 1 | 1 |
Investigation, guard, and armored car services | -- | 1 | 1 |
Services to buildings and dwellings | -- | 5 | 5 |
Landscaping services | -- | 5 | 5 |
Educational and health services | -- | -- | -- |
Educational services | 1 | 1 | 1 |
Educational services | 1 | 1 | 1 |
Elementary and secondary schools | -- | 1 | 1 |
Elementary and secondary schools | -- | 1 | 1 |
Leisure and hospitality | -- | 8 | 8 |
Arts, entertainment, and recreation | -- | 4 | 4 |
Accommodation and food services | -- | 4 | 4 |
Other services, except public administration | 6 | 4 | 4 |
Other services, except public administration | 6 | 4 | 4 |
Repair and maintenance | 4 | 4 | 4 |
Automotive repair and maintenance | -- | 4 | 4 |
Government (4) | 11 | 12 | 12 |
Federal government | 7 | 3 | 3 |
State government | -- | 2 | 2 |
Local government | 4 | 7 | 7 |
Footnotes: | |||
NOTE: Data for all years are final. Totals for major categories may include subcategories not shown separately. For complete information on how the data are coded and presented see our definitions page at https://www.bls.gov/iif/oshcfdef.htm. Dashes indicate no data reported or data that do not meet publication criteria. CFOI fatal injury counts exclude illness-related deaths unless precipitated by an injury event. | |||
| Occupation (1) | 2019 | 2020 | |
|---|---|---|---|
| Number | Number | Percent | |
Total | 94 | 97 | 100 |
Management occupations | 3 | 4 | 4 |
Arts, design, entertainment, sports, and media occupations | 2 | 2 | 2 |
Entertainers and performers, sports and related workers | 2 | 2 | 2 |
Athletes, coaches, umpires, and related workers | -- | 2 | 2 |
Athletes and sports competitors | -- | 2 | 2 |
Protective service occupations | 4 | 6 | 6 |
Other protective service workers | -- | 1 | 1 |
Security guards and gambling surveillance officers | -- | 1 | 1 |
Security guards | -- | 1 | 1 |
Food preparation and serving related occupations | -- | 3 | 3 |
Building and grounds cleaning and maintenance occupations | 5 | 6 | 6 |
Grounds maintenance workers | 3 | 6 | 6 |
Grounds maintenance workers | 3 | 6 | 6 |
Farming, fishing, and forestry occupations | 4 | 3 | 3 |
Construction and extraction occupations | 20 | 25 | 26 |
Supervisors of construction and extraction workers | -- | 1 | 1 |
First-line supervisors of construction trades and extraction workers | -- | 1 | 1 |
First-line supervisors of construction trades and extraction workers | -- | 1 | 1 |
Construction trades workers | 18 | 21 | 22 |
Construction laborers | 9 | 8 | 8 |
Construction laborers | 9 | 8 | 8 |
Construction equipment operators | -- | 5 | 5 |
Operating engineers and other construction equipment operators | -- | 5 | 5 |
Roofers | 3 | 1 | 1 |
Roofers | 3 | 1 | 1 |
Installation, maintenance, and repair occupations | 12 | 7 | 7 |
Production occupations | -- | 4 | 4 |
Transportation and material moving occupations | 27 | 28 | 29 |
Motor vehicle operators | 20 | 22 | 23 |
Material moving workers | 5 | 3 | 3 |
Footnotes: | |||
NOTE: Data for all years are final. Totals for major categories may include subcategories not shown separately. For complete information on how the data are coded and presented see our definitions page at https://www.bls.gov/iif/oshcfdef.htm. Dashes indicate no data reported or data that do not meet publication criteria. CFOI fatal injury counts exclude illness-related deaths unless precipitated by an injury event. | |||
| Worker characteristics | 2019 | 2020 | |
|---|---|---|---|
| Number | Number | Percent | |
Total | 94 | 97 | 100 |
Employee status | |||
Wage and salary workers (1) | 80 | 85 | 88 |
Self-employed (2) | 14 | 12 | 12 |
Gender | |||
Men | 92 | 89 | 92 |
Women | -- | 8 | 8 |
Age (3) | |||
25 to 34 years | 17 | 18 | 19 |
35 to 44 years | 18 | 27 | 28 |
45 to 54 years | 20 | 17 | 18 |
55 to 64 years | 19 | 26 | 27 |
65 years and over | 15 | 6 | 6 |
Race or ethnic origin (4) | |||
White, non-Hispanic | 36 | 42 | 43 |
Black or African-American, non-Hispanic | -- | 3 | 3 |
Hispanic or Latino | 39 | 41 | 42 |
Asian, non-Hispanic | 5 | 6 | 6 |
Footnotes: | |||
NOTE: Data for all years are final. Totals for major categories may include subcategories not shown separately. For complete information on how the data are coded and presented see our definitions page at https://www.bls.gov/iif/oshcfdef.htm. Dashes indicate no data reported or data that do not meet publication criteria. CFOI fatal injury counts exclude illness-related deaths unless precipitated by an injury event. | |||
Last Modified Date: Thursday, March 24, 2022