News Release Information
22-115-SAN
Wednesday, January 26, 2022
Employer-Reported Workplace Injuries and Illnesses in Hawaii – 2020
Private industry employers reported 10,900 nonfatal workplace injuries and illnesses in Hawaii in 2020, resulting in an incidence rate of 3.0 cases per 100 full-time equivalent workers, the U.S. Bureau of Labor Statistics reported today. (See table A.) Regional Commissioner Chris Rosenlund noted that Hawaii was among 10 states that had an incidence rate of total recordable cases (TRC) not significantly different from the national rate of 2.7. (See the Technical Note at the end of this release for more information about the Survey of Occupational Injuries and Illnesses.)
Hawaii’s findings from the 2020 Survey of Occupational Injuries and Illnesses include:
- TRC incidence rates in private industry ranged from 1.0 in financial activities to 5.0 in manufacturing. (See table 1.)
- Two supersectors, with 42.3 percent of private industry employment, accounted for 51.4 percent of the occupational injuries and illnesses: trade, transportation, and utilities and education and health services . (See table 2.)
- In private industry, the TRC injury and illness incidence rate ranged from 3.0 for establishments employing 11 to 49 workers to 4.4 for establishments employing 1,000 or more workers. (See table 3.)
- Hawaii’s private industry TRC rate of 3.0 in 2020 was not significantly different than the 2019 rate of 3.2. (See table 4.)
Table A. Number and rate of nonfatal occupational injuries and illnesses in private industry, United States and Hawaii, 2020
| Characteristic |
United States |
Hawaii |
Number
(in thousands) |
Rate |
Number
(in thousands) |
Rate |
|
Total cases
|
2,654.7 |
2.7 |
10.9 |
3.0 |
|
Cases with days away from work, job transfer, or restriction
|
1,702.0 |
1.7 |
7.5 |
2.1 |
|
Cases with days away from work
|
1,176.3 |
1.2 |
6.7 |
1.9 |
|
Cases with job transfer or restriction
|
525.6 |
0.5 |
0.8 |
0.2 |
|
Other recordable cases
|
952.7 |
1.0 |
3.4 |
0.9 |
|
Note: Due to rounding, components may not add to totals.
|
Private industry injury and illness case types
Of the 10,900 private industry injury and illness cases reported in Hawaii, 7,500 were of a more severe nature, involving days away from work, job transfer, or restriction—commonly referred to as DART cases. These cases occurred at a rate of 2.1 cases per 100 full-time workers. Eighty-nine percent of the DART cases in Hawaii were incidents that resulted in at least one day away from work, compared to 69.1 percent nationally. Other recordable cases (those not involving days away from work, job transfer, or restriction) accounted for the remaining 3,400 cases in Hawaii, at a rate of 0.9. In comparison, the national rate for other recordable cases was 1.0.
In Hawaii, the trade, transportation, and utilities and leisure and hospitality supersectors had significant decreases in their TRC and DART incidence rates from the previous year. The natural resources and mining supersector had significant increases in its TRC and DART incidence rates from the previous year. The construction supersector had a significant increase in its DART rate since a year ago. No other private industry supersector had a significant change in its TRC or DART rate from the previous year.
In 2020, 9,300 (85.3 percent) of private industry recordable injuries and illnesses were injuries. Workplace illnesses accounted for an additional 1,600 recordable cases.
State and local government injury and illness cases
In the state and local government sector in Hawaii, 1,800 injury and illness cases were reported in 2020, resulting in a rate of 2.4 cases per 100 full-time workers. Nationally, the rate was 3.9. Fifty percent of injuries and illnesses reported in Hawaii’s public sector occurred among local government workers.
State estimates
Private industry estimates are available for 41 participating states and for the District of Columbia for 2020. The private industry injury and illness rate was statistically higher in 20 states than the national rate of 2.7 cases per 100 full-time workers, lower in 11 states and in the District of Columbia, and not statistically different in 10 states. (See chart 1.) Caution should be taken when comparing rates among different states as some differences can be attributed to different industry composition within each state.
Technical Note
The Survey of Occupational Injuries and Illnesses (SOII) is a Federal/State cooperative program that publishes estimates on nonfatal occupational injuries and illnesses. Each year, approximately 200,000 employers report for establishments in private industry and the public sector (state and local government). In-scope cases include work-related injuries or illnesses to workers who require medical care beyond first aid. See the Occupational Safety and Health Administration (OSHA) for the entire recordkeeping guidelines. The SOII excludes all work–related fatalities as well as nonfatal work injuries and illnesses to the self–employed, to workers on farms with 10 or fewer employees, to private household workers, to volunteers, and to federal government workers. For more information on the scope and sampling methodology see the SOII Handbook of Methods.
Information in this release will be made available to individuals with sensory impairments upon request. Voice phone: (202)-691-5200; Federal Relay Service: (800)-877-8339.
Table 1. Incidence rates of nonfatal occupational injuries and illnesses by industry sector and case type, Hawaii, 2020
| Industry |
Total recordable cases |
Cases with days away from work, job transfer, or restriction |
Other recordable cases |
| Total |
Cases with days away from work |
Cases with job transfer or restriction |
|
All industries including state and local government
|
2.9 |
2.0 |
1.8 |
0.2 |
1.0 |
|
Private industry
|
3.0 |
2.1 |
1.9 |
0.2 |
0.9 |
|
Goods-producing
|
3.7 |
2.9 |
2.3 |
0.6 |
0.8 |
|
Natural resources and mining
|
4.6 |
2.6 |
1.9 |
- |
2.0 |
|
Construction
|
3.1 |
2.5 |
1.9 |
0.6 |
0.6 |
|
Manufacturing
|
5.0 |
4.1 |
3.6 |
0.5 |
0.9 |
|
Service-providing
|
2.9 |
2.0 |
1.8 |
0.2 |
1.0 |
|
Trade, transportation, and utilities
|
3.4 |
2.5 |
2.2 |
0.3 |
0.9 |
|
Information
|
- |
- |
- |
- |
- |
|
Financial activities
|
1.0 |
0.8 |
0.6 |
0.2 |
0.3 |
|
Professional and business services
|
2.1 |
1.5 |
1.4 |
- |
0.6 |
|
Education and health services
|
4.2 |
2.7 |
2.6 |
0.1 |
1.5 |
|
Leisure and hospitality
|
3.0 |
1.8 |
1.6 |
0.2 |
1.3 |
|
Other services, except public administration
|
- |
- |
- |
- |
- |
|
State and local government
|
2.4 |
1.4 |
1.2 |
0.2 |
1.0 |
|
State government
|
1.6 |
0.9 |
0.8 |
- |
0.7 |
|
Local government
|
- |
- |
- |
- |
- |
|
Note: Due to rounding, components may not add to totals. Dash indicates data not available.
|
Table 2. Numbers of nonfatal occupational injuries and illnesses by selected industries and case types, Hawaii, 2020 (numbers in thousands)
| Industry |
Total recordable cases |
Cases with days away from work, job transfer, or restriction |
Other recordable cases |
| Total |
Cases with days away from work |
Cases with job transfer or restriction |
|
All industries including state and local government
|
12.7 |
8.5 |
7.6 |
0.9 |
4.1 |
|
Private industry
|
10.9 |
7.5 |
6.7 |
0.8 |
3.4 |
|
Goods-producing
|
1.7 |
1.3 |
1.1 |
0.3 |
0.4 |
|
Natural resources and mining
|
0.2 |
0.1 |
0.1 |
- |
0.1 |
|
Construction
|
0.9 |
0.8 |
0.6 |
0.2 |
0.2 |
|
Manufacturing
|
0.6 |
0.5 |
0.4 |
0.1 |
0.1 |
|
Service-providing
|
9.2 |
6.2 |
5.7 |
0.5 |
3.0 |
|
Trade, transportation, and utilities
|
3.0 |
2.2 |
1.9 |
0.3 |
0.8 |
|
Information
|
- |
- |
- |
- |
- |
|
Financial activities
|
0.2 |
0.2 |
0.1 |
- |
0.1 |
|
Professional and business services
|
1.3 |
0.9 |
0.9 |
- |
0.4 |
|
Education and health services
|
2.6 |
1.7 |
1.6 |
0.1 |
1.0 |
|
Leisure and hospitality
|
1.7 |
1.0 |
0.9 |
0.1 |
0.7 |
|
Other services, except public administration
|
- |
- |
- |
- |
- |
|
State and local government
|
1.8 |
1.0 |
0.9 |
0.1 |
0.8 |
|
State government
|
0.9 |
0.5 |
0.5 |
- |
0.4 |
|
Local government
|
- |
- |
- |
- |
- |
|
Note: Due to rounding, components may not add to totals. Dash indicates data not available.
|
Table 3. Incidence rates of nonfatal occupational injuries and illnesses by industry sector and employment size, Hawaii, 2020
| Industry |
All establishments |
Establishment employment size (workers) |
| 1 to 10 |
11 to 49 |
50 to 249 |
250 to 999 |
1,000 or more |
|
All industries including state and local government
|
2.9 |
- |
3.0 |
3.1 |
3.3 |
3.6 |
|
Private industry
|
3.0 |
- |
3.0 |
3.5 |
3.2 |
4.4 |
|
Goods-producing
|
3.7 |
- |
4.0 |
4.6 |
2.6 |
- |
|
Natural resources and mining
|
4.6 |
- |
5.0 |
4.5 |
- |
- |
|
Construction
|
3.1 |
- |
3.4 |
3.8 |
1.9 |
- |
|
Manufacturing
|
5.0 |
- |
5.5 |
6.4 |
- |
- |
|
Service-providing
|
2.9 |
- |
2.8 |
3.3 |
3.3 |
4.4 |
|
Trade, transportation, and utilities
|
3.4 |
2.2 |
2.3 |
3.9 |
5.4 |
4.1 |
|
Information
|
- |
- |
- |
- |
- |
- |
|
Financial activities
|
1.0 |
- |
- |
1.7 |
- |
- |
|
Professional and business services
|
2.1 |
- |
2.8 |
2.6 |
2.2 |
1.6 |
|
Education and health services
|
4.2 |
- |
6.5 |
3.7 |
2.7 |
5.3 |
|
Leisure and hospitality
|
3.0 |
- |
2.1 |
3.8 |
3.5 |
4.7 |
|
Other services, except public administration
|
- |
- |
0.9 |
1.3 |
- |
- |
|
State and local government
|
2.4 |
- |
3.3 |
1.6 |
3.5 |
2.5 |
|
State government
|
1.6 |
- |
- |
1.2 |
1.5 |
2.5 |
|
Local government
|
- |
- |
- |
- |
- |
- |
|
Note: Dash indicates data not available.
|
Table 4. Incidence rates of nonfatal occupational injuries and illnesses by industry sector and selected case type with measures of statistical significance, Hawaii, 2019–20
| Industry |
Total recordable cases |
Cases with days away from work, job transfer, or restriction |
| 2019 |
2020 |
2019 |
2020 |
|
All industries including state and local government
|
3.3 |
2.9 |
2.0 |
2.0 |
|
Private industry
|
3.2 |
3.0 |
2.0 |
2.1 |
|
Goods-producing
|
3.1 |
3.7 |
1.9 |
2.9* |
|
Natural resources and mining
|
1.7 |
4.6* |
1.0 |
2.6* |
|
Construction
|
3.0 |
3.1 |
1.6 |
2.5* |
|
Manufacturing
|
4.0 |
5.0 |
2.9 |
4.1 |
|
Service-providing
|
3.3 |
2.9 |
2.0 |
2.0 |
|
Trade, transportation, and utilities
|
4.2 |
3.4* |
3.1 |
2.5* |
|
Information
|
1.0 |
- |
0.8 |
- |
|
Financial activities
|
1.0 |
1.0 |
0.6 |
0.8 |
|
Professional and business services
|
2.0 |
2.1 |
1.4 |
1.5 |
|
Education and health services
|
3.8 |
4.2 |
1.4 |
2.7 |
|
Leisure and hospitality
|
4.2 |
3.0* |
2.7 |
1.8* |
|
Other services, except public administration
|
1.1 |
- |
0.7 |
- |
|
State and local government
|
3.7 |
2.4 |
2.0 |
1.4 |
|
State government
|
3.1 |
1.6 |
1.2 |
0.9 |
|
Local government
|
5.5 |
- |
4.6 |
- |
|
Note: Dash indicates data not available. An asterisk (*) indicates a significant difference between the current year and prior year values, when testing at 95% confidence level.
|
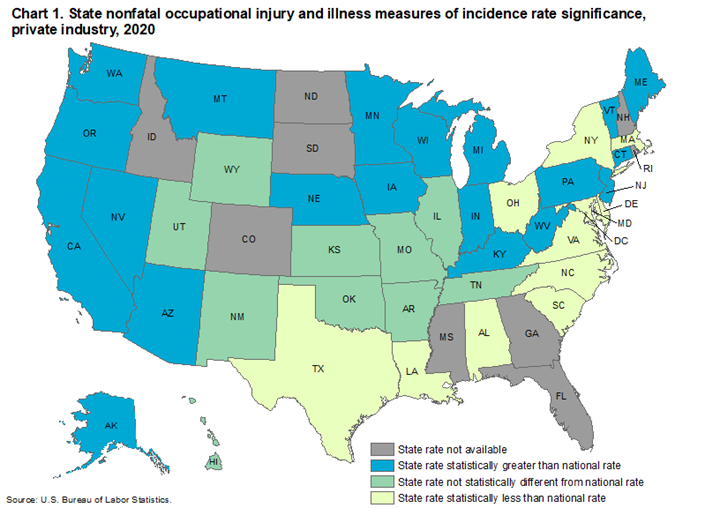
Chart 1. State nonfatal occupational injury and illness measures of incidence rate significance, private industry, 2020
| State |
Significance |
|
Alabama
|
State rate statistically less than national rate |
|
Alaska
|
State rate statistically greater than national rate |
|
Arizona
|
State rate statistically greater than national rate |
|
Arkansas
|
State rate not statistically different from national rate |
|
California
|
State rate statistically greater than national rate |
|
Connecticut
|
State rate statistically greater than national rate |
|
Delaware
|
State rate statistically less than national rate |
|
District of Columbia
|
State rate statistically less than national rate |
|
Hawaii
|
State rate not statistically different from national rate |
|
Illinois
|
State rate not statistically different from national rate |
|
Indiana
|
State rate statistically greater than national rate |
|
Iowa
|
State rate statistically greater than national rate |
|
Kansas
|
State rate not statistically different from national rate |
|
Kentucky
|
State rate statistically greater than national rate |
|
Louisiana
|
State rate statistically less than national rate |
|
Maine
|
State rate statistically greater than national rate |
|
Maryland
|
State rate statistically less than national rate |
|
Massachusetts
|
State rate statistically less than national rate |
|
Michigan
|
State rate statistically greater than national rate |
|
Minnesota
|
State rate statistically greater than national rate |
|
Missouri
|
State rate not statistically different from national rate |
|
Montana
|
State rate statistically greater than national rate |
|
Nebraska
|
State rate statistically greater than national rate |
|
Nevada
|
State rate statistically greater than national rate |
|
New Jersey
|
State rate statistically greater than national rate |
|
New Mexico
|
State rate not statistically different from national rate |
|
New York
|
State rate statistically less than national rate |
|
North Carolina
|
State rate statistically less than national rate |
|
Ohio
|
State rate statistically less than national rate |
|
Oklahoma
|
State rate not statistically different from national rate |
|
Oregon
|
State rate statistically greater than national rate |
|
Pennsylvania
|
State rate statistically greater than national rate |
|
South Carolina
|
State rate statistically less than national rate |
|
Tennessee
|
State rate not statistically different from national rate |
|
Texas
|
State rate statistically less than national rate |
|
Utah
|
State rate not statistically different from national rate |
|
Vermont
|
State rate statistically greater than national rate |
|
Virginia
|
State rate statistically less than national rate |
|
Washington
|
State rate statistically greater than national rate |
|
West Virginia
|
State rate statistically greater than national rate |
|
Wisconsin
|
State rate statistically greater than national rate |
|
Wyoming
|
State rate not statistically different from national rate |
|
Colorado
|
Not in Survey |
|
Florida
|
Not in Survey |
|
Georgia
|
Not in Survey |
|
Idaho
|
Not in Survey |
|
Mississippi
|
Not in Survey |
|
New Hampshire
|
Not in Survey |
|
North Dakota
|
Not in Survey |
|
Rhode Island
|
Not in Survey |
|
South Dakota
|
Not in Survey |
|
Note: Rates not available for states not participating in Survey of Occupational Injuries and Illnesses.
Source: U.S. Bureau of Labor Statistics
|
