An official website of the United States government
An official website of the United States government
The .gov means it's official.
Federal government websites often end in .gov or .mil. Before sharing sensitive information,
make sure you're on a federal government site.
The site is secure.
The
https:// ensures that you are connecting to the official website and that any
information you provide is encrypted and transmitted securely.
23-669-SAN
Thursday, April 20, 2023
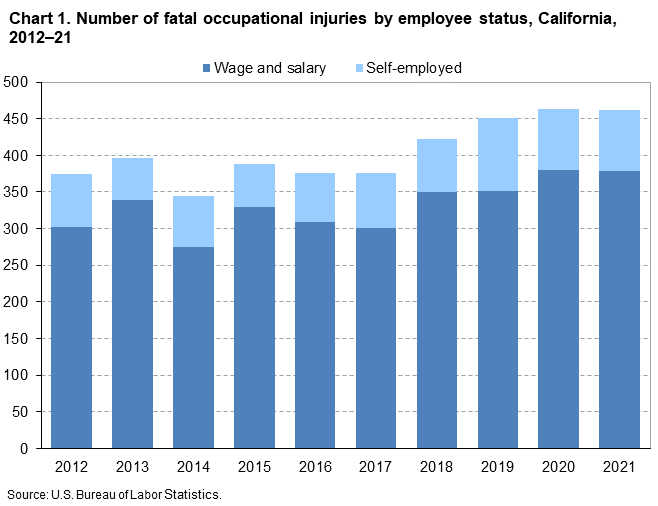
Fatal work injuries totaled 462 in 2021 for California, the U.S. Bureau of Labor Statistics reported today. Regional Commissioner Chris Rosenlund noted that the number of work-related fatalities in California was down one from the previous year, which saw a total of 463 fatal work injuries. (See chart 1.) Fatal occupational injuries in the state have ranged from a high of 657 in 1993 to a low of 326 in 2010. Nationwide, a total of 5,190 fatal work injuries were recorded in 2021, a 9-percent increase from 4,764 in 2020, according to the results from the Census of Fatal Occupational Injuries (CFOI).
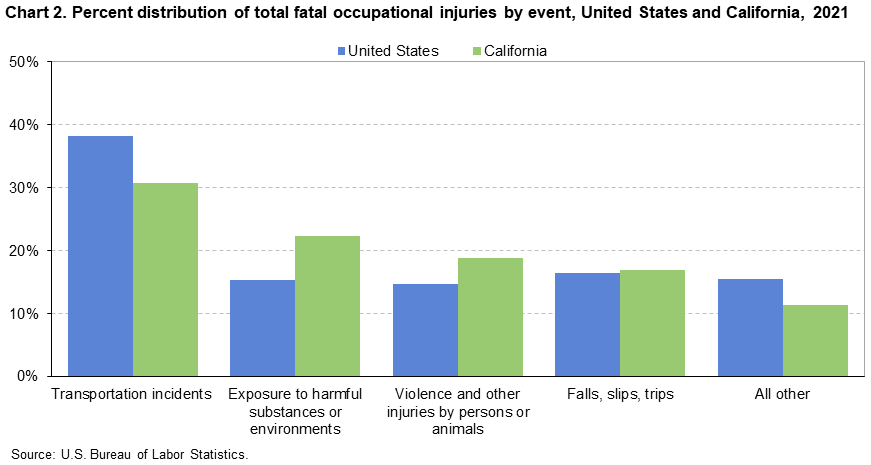
Fatal event or exposureIn California, transportation incidents resulted in 142 fatal work injuries and exposure to harmful substances or environments caused 103 fatalities. These two major categories accounted for 53 percent of all fatal workplace injuries in the state. (See chart 2 and table 1.) Worker deaths from transportation incidents were up from 122 over the year, while fatal work injuries from exposure to harmful substances or environments were up from 85.
Violence and other injuries by persons or animals accounted for 87 fatal work injuries, down from 97 in the prior year. Falls, slips and trips resulted in 78 workplace fatalities, compared to 99 in 2020.
Nationally, transportation incidents were the most frequent fatal event in 2021, accounting for 38 percent of fatal work injuries. Falls, slips, and trips was the second-most common fatal event (16 percent), followed by both exposure to harmful substances or environments and violence and other injuries by persons or animals (15 percent each) and contact with objects and equipment (14 percent).
IndustryThe private construction industry sector had the highest number of fatalities in California with 79, down from 92 in the previous year. (See table 2.) Falls, slips, or trips resulted in 33 of the 79 fatalities in the industry. The specialty trade contractors subsector accounted for 42 of the 79 fatal workplace injuries in the construction industry.
The private transportation and warehousing industry sector had 58 fatal workplace injuries, down from 59 in the previous year. Transportation incidents accounted for 37 of the 58 fatalities in the industry. The truck transportation subsector accounted for 26, or 45 percent, of the fatal injuries in this industry.
OccupationThe transportation and material moving occupational group had the highest number of fatal workplace injuries with 112, followed by the construction and extraction occupational group with 81. (See table 3.) Heavy and tractor-trailer truck drivers accounted for 48 of the 112 fatalities among transportation and material moving workers. Construction laborers suffered 24 of the 81 work-related deaths within the construction and extraction group.
Additional highlights:Men accounted for 92 percent of the work-related fatalities in California, similar to the national share of 91 percent. (See table 4.) Transportation incidents made up 30 percent of the fatalities for men in California.
Hispanics or Latinos accounted for 51 percent of those who died from a workplace injury. Nationwide, this group accounted for 22 percent of work-related deaths.
Workers 25-54 years old accounted for 57 percent of the state’s work-related fatalities in 2021, equal to the national rate.
Of the 462 fatal work injuries in California, 82 percent worked for wages and salaries; the remainder were self-employed. The most frequent fatal event for both types of workers was transportation incidents.
Background of the program. The Census of Fatal Occupational Injuries (CFOI), part of the Bureau of Labor Statistics (BLS) Occupational Safety and Health Statistics (OSHS) program, is a count of all fatalities resulting from workplace injuries occurring in the U.S. during the calendar year. The CFOI uses a variety of state, federal, and independent data sources to identify, verify, and describe fatal work injuries. This ensures counts are as complete and accurate as possible. For the 2021 national data, over 23,900 unique source documents were reviewed as part of the data collection process. For technical information and definitions for the CFOI, see the BLS Handbook of Methods at www.bls.gov/opub/hom/cfoi/home.htm and the CFOI definitions at www.bls.gov/iif/definitions/occupational-safety-and-health-definitions.htm.
Federal/State agency coverage. The CFOI includes data for all fatal work injuries, some of which may be outside the scope of other agencies or regulatory coverage. Comparisons between CFOI counts and those released by other agencies should account for the different coverage requirements and definitions used by each agency. For more information on the scope of CFOI, see www.bls.gov/iif/overview/cfoi-scope.htm and www.bls.gov/opub/hom/cfoi/concepts.htm.
Latency Cases. Latent fatal occupational injury cases occur when the date of injury differs from the date of death. In some cases, the death occurs in a different year than the occupational injury and are known as cross-year latent cases. In 2021, there were 197 cases nationally where this occurred, and 174 of these latent cases occurred more than 30 days prior to the start of 2021. For more information on latent cases, see www.bls.gov/opub/btn/volume-10/latency-in-fatal-occupational-injuries.htm.
Coronavirus (COVID-19) Pandemic and the Census of Fatal Occupational Injuries. CFOI reports fatal workplace injuries only. These may include fatal workplace injuries complicated by an illness such as COVID-19. Fatal workplace illnesses not precipitated by an injury are not in scope for CFOI. CFOI does not report any illness related information, including COVID-19. Additional information is available at www.bls.gov/covid19/effects-of-covid-19-on-workplace-injuries-and-illnesses-compensation-and-occupational-requirements.htm.
Acknowledgments. BLS thanks the California Department of Industrial Relations for their efforts in collecting accurate, comprehensive, and useful data on fatal work injuries. BLS also appreciates the efforts of all federal, state, local, and private sector entities that provided source documents used to identify fatal work injuries. Among these agencies are the Occupational Safety and Health Administration; the National Transportation Safety Board; the U.S. Coast Guard; the Mine Safety and Health Administration; the Office of Workers’ Compensation Programs (Federal Employees' Compensation and Longshore and Harbor Workers' Compensation divisions); the Federal Railroad Administration; the National Highway Traffic Safety Administration; state vital statistics registrars, coroners, and medical examiners; state departments of health, labor, and industrial relations and workers' compensation agencies; state and local police departments; and state farm bureaus.
Information in this release will be made available to individuals with sensory impairments upon request. Voice phone: (202) 691-5200; Telecommunications Relay Service: 7-1-1.
| Event or exposure (1) | 2020 | 2021 | |
|---|---|---|---|
| Number | Number | Percent | |
Total | 463 | 462 | 100 |
Violence and other injuries by persons or animals | 97 | 87 | 19 |
Intentional injury by person | 92 | 85 | 18 |
Intentional injury by other person | 47 | 57 | 12 |
Shooting by other person--intentional | 30 | 42 | 9 |
Self-inflicted injury--intentional | 45 | 28 | 6 |
Transportation incidents | 122 | 142 | 31 |
Aircraft incidents | -- | 14 | 3 |
Aircraft crash during takeoff or landing | -- | 9 | 2 |
Other in-flight crash | -- | 5 | 1 |
Other in-flight crash into structure, object, or ground | -- | 5 | 1 |
Animal and other non-motorized vehicle transportation incidents | -- | 1 | 0 |
Pedestrian vehicular incident | 36 | 32 | 7 |
Pedestrian struck by vehicle in work zone | 1 | 5 | 1 |
Pedestrian struck by forward-moving vehicle in work zone | -- | 5 | 1 |
Pedestrian struck by vehicle in roadway | 13 | 11 | 2 |
Pedestrian struck by forward-moving vehicle in roadway | -- | 10 | 2 |
Pedestrian struck by vehicle on side of road | 8 | 5 | 1 |
Pedestrian struck by forward-moving vehicle on side of road | 5 | 5 | 1 |
Pedestrian struck by vehicle in nonroadway area | 12 | 10 | 2 |
Roadway incidents involving motorized land vehicle | 56 | 83 | 18 |
Roadway collision with other vehicle | 21 | 42 | 9 |
Roadway collision--moving in same direction | -- | 14 | 3 |
Roadway collision--moving in opposite directions, oncoming | 8 | 13 | 3 |
Roadway collision--moving perpendicularly | 6 | 8 | 2 |
Roadway collision with object other than vehicle | 15 | 11 | 2 |
Vehicle struck object or animal on side of roadway | 12 | 9 | 2 |
Roadway noncollision incident | 20 | 30 | 6 |
Jack-knifed or overturned, roadway | 15 | 14 | 3 |
Ran off roadway | -- | 14 | 3 |
Nonroadway incident involving motorized land vehicles | 8 | 8 | 2 |
Nonroadway noncollision incident | -- | 5 | 1 |
Jack-knifed or overturned, nonroadway | -- | 3 | 1 |
Falls, slips, trips | 99 | 78 | 17 |
Falls on same level | -- | 12 | 3 |
Falls to lower level | 83 | 65 | 14 |
Fall from collapsing structure or equipment | 8 | 9 | 2 |
Fall from collapsing structure or equipment 6 to 10 feet | -- | 2 | 0 |
Fall from collapsing structure or equipment 21 to 25 feet | 3 | 1 | 0 |
Fall from collapsing structure or equipment 26 to 30 feet | -- | 1 | 0 |
Fall from collapsing structure or equipment more than 30 feet | 3 | 2 | 0 |
Fall through surface or existing opening | 10 | 3 | 1 |
Other fall to lower level | 65 | 53 | 11 |
Other fall to lower level less than 6 feet | 10 | 8 | 2 |
Other fall to lower level 6 to 10 feet | 14 | 12 | 3 |
Other fall to lower level 11 to 15 feet | 8 | 3 | 1 |
Other fall to lower level 16 to 20 feet | 3 | 6 | 1 |
Other fall to lower level 21 to 25 feet | 5 | 3 | 1 |
Other fall to lower level 26 to 30 feet | 3 | 5 | 1 |
Other fall to lower level more than 30 feet | 11 | 7 | 2 |
Jumps to lower level | -- | 1 | 0 |
Other jump to lower level | -- | 1 | 0 |
Other jump to lower level less than 6 feet | -- | 1 | 0 |
Exposure to harmful substances or environments | 85 | 103 | 22 |
Exposure to other harmful substances | 65 | 90 | 19 |
Nonmedical use of drugs or alcohol--unintentional overdose | 59 | 85 | 18 |
Inhalation of harmful substance | 6 | 5 | 1 |
Inhalation of harmful substance--single episode | -- | 5 | 1 |
Exposure to oxygen deficiency, n.e.c. | 3 | 4 | 1 |
Depletion of oxygen | -- | 4 | 1 |
Contact with objects and equipment | 52 | 44 | 10 |
Struck by object or equipment | 34 | 33 | 7 |
Struck by powered vehicle--nontransport | 12 | 22 | 5 |
Caught between rolling powered vehicle and other object | 3 | 2 | 0 |
Struck by falling part of powered vehicle still attached | -- | 5 | 1 |
Struck by other falling powered vehicle | -- | 10 | 2 |
Struck by falling object or equipment--other than powered vehicle | 16 | 8 | 2 |
Struck by swinging or slipping object, other than handheld | -- | 1 | 0 |
Struck by or caught in swinging door or gate | -- | 1 | 0 |
Caught in or compressed by equipment or objects | 15 | 7 | 2 |
Caught in running equipment or machinery | 10 | 5 | 1 |
Caught in running equipment or machinery during maintenance, cleaning | 6 | 2 | 0 |
Caught in running equipment or machinery during regular operation | 4 | 3 | 1 |
Compressed or pinched by shifting objects or equipment | -- | 1 | 0 |
Footnotes: | |||
NOTE: Data for all years are final. Totals for major categories may include subcategories not shown separately. For complete information on how the data are coded and presented see our definitions page at https://www.bls.gov/iif/definitions/census-of-fatal-occupational-injuries-definitions.htm. Dashes indicate no data reported or data that do not meet publication criteria. CFOI fatal injury counts exclude illness-related deaths unless precipitated by an injury event. | |||
| Industry (1) | 2020 | 2021 | |
|---|---|---|---|
| Number | Number | Percent | |
Total | 463 | 462 | 100 |
Private industry (2) | 409 | 408 | 88 |
Goods producing | -- | -- | -- |
Natural resources and mining | 36 | -- | -- |
Agriculture, forestry, fishing and hunting | 32 | 39 | 8 |
Crop production | 17 | 18 | 4 |
Vegetable and melon farming | -- | 4 | 1 |
Vegetable and melon farming | -- | 4 | 1 |
Fruit and tree nut farming | 4 | 9 | 2 |
Noncitrus fruit and tree nut farming | 4 | 9 | 2 |
Other crop farming | 4 | 5 | 1 |
Animal production and aquaculture | -- | 6 | 1 |
Forestry and logging | -- | 2 | 0 |
Logging | -- | 2 | 0 |
Logging | -- | 2 | 0 |
Support activities for agriculture and forestry | 8 | 11 | 2 |
Mining, quarrying, and oil and gas extraction (3) | 4 | -- | -- |
Construction | 92 | 79 | 17 |
Construction | 92 | 79 | 17 |
Construction of buildings | 29 | 27 | 6 |
Residential building construction | 20 | 17 | 4 |
Residential building construction | 20 | 17 | 4 |
New single-family housing construction (except for-sale builders) | 3 | 8 | 2 |
Nonresidential building construction | 9 | 10 | 2 |
Commercial and institutional building construction | 9 | 10 | 2 |
Specialty trade contractors | 51 | 42 | 9 |
Foundation, structure, and building exterior contractors | 20 | 16 | 3 |
Masonry contractors | -- | 3 | 1 |
Roofing contractors | 9 | 8 | 2 |
Building equipment contractors | 10 | 12 | 3 |
Plumbing, heating, and air-conditioning contractors | 6 | 7 | 2 |
Building finishing contractors | 13 | 8 | 2 |
Painting and wall covering contractors | 7 | 4 | 1 |
Other specialty trade contractors | 8 | 6 | 1 |
Manufacturing | 18 | 32 | 7 |
Manufacturing | 18 | 32 | 7 |
Food manufacturing | -- | 5 | 1 |
Wood product manufacturing | 3 | 4 | 1 |
Sawmills and wood preservation | -- | 1 | 0 |
Sawmills and wood preservation | -- | 1 | 0 |
Other wood product manufacturing | -- | 3 | 1 |
Paper manufacturing | -- | 1 | 0 |
Plastics and rubber products manufacturing | -- | 3 | 1 |
Plastics product manufacturing | -- | 3 | 1 |
Nonmetallic mineral product manufacturing | -- | 4 | 1 |
Fabricated metal product manufacturing | 3 | 4 | 1 |
Other fabricated metal product manufacturing | -- | 1 | 0 |
Metal valve manufacturing | -- | 1 | 0 |
Plumbing fixture fitting and trim manufacturing | -- | 1 | 0 |
Furniture and related product manufacturing | -- | 2 | 0 |
Household and institutional furniture and kitchen cabinet manufacturing | -- | 2 | 0 |
Wood kitchen cabinet and countertop manufacturing | -- | 1 | 0 |
Household and institutional furniture manufacturing | -- | 1 | 0 |
Service providing (4) | -- | -- | -- |
Trade, transportation, and utilities | 109 | 110 | 24 |
Utilities | 1 | 5 | 1 |
Utilities | 1 | 5 | 1 |
Wholesale trade | 12 | 13 | 3 |
Retail trade | 37 | 34 | 7 |
Motor vehicle and parts dealers | 3 | 8 | 2 |
Automobile dealers | -- | 3 | 1 |
Food and beverage stores | 19 | 6 | 1 |
Health and personal care stores | -- | 3 | 1 |
Health and personal care stores | -- | 3 | 1 |
Gasoline stations | 3 | 3 | 1 |
Gasoline stations | 3 | 3 | 1 |
Clothing and clothing accessories stores | -- | 4 | 1 |
General merchandise stores | -- | 4 | 1 |
Transportation and warehousing | 59 | 58 | 13 |
Air transportation | 3 | 2 | 0 |
Nonscheduled air transportation | -- | 2 | 0 |
Nonscheduled air transportation | -- | 2 | 0 |
Nonscheduled chartered passenger air transportation | -- | 2 | 0 |
Rail transportation | -- | 1 | 0 |
Rail transportation | -- | 1 | 0 |
Rail transportation | -- | 1 | 0 |
Line-haul railroads | -- | 1 | 0 |
Truck transportation | 36 | 26 | 6 |
General freight trucking | 28 | 17 | 4 |
General freight trucking, long-distance | -- | 9 | 2 |
General freight trucking, long-distance, truckload | -- | 3 | 1 |
Transit and ground passenger transportation | -- | 11 | 2 |
Support activities for transportation | 12 | 10 | 2 |
Support activities for road transportation | -- | 5 | 1 |
Motor vehicle towing | -- | 5 | 1 |
Couriers and messengers | 3 | 4 | 1 |
Warehousing and storage | 3 | 4 | 1 |
Warehousing and storage | 3 | 4 | 1 |
General warehousing and storage | 3 | 3 | 1 |
Refrigerated warehousing and storage | -- | 1 | 0 |
Information | 7 | 6 | 1 |
Information | 7 | 6 | 1 |
Publishing industries (except internet) | 1 | 3 | 1 |
Telecommunications | -- | 3 | 1 |
Financial activities | 15 | 19 | 4 |
Finance and insurance | 3 | 1 | 0 |
Real estate and rental and leasing | 12 | 18 | 4 |
Professional and business services | 76 | 56 | 12 |
Professional, scientific, and technical services | 10 | 9 | 2 |
Professional, scientific, and technical services | 10 | 9 | 2 |
Architectural, engineering, and related services | -- | 4 | 1 |
Testing laboratories | -- | 1 | 0 |
Administrative and support and waste management and remediation services | 66 | 47 | 10 |
Administrative and support services | 57 | 46 | 10 |
Employment services | -- | 3 | 1 |
Investigation and security services | 12 | 9 | 2 |
Investigation, guard, and armored car services | -- | 9 | 2 |
Security guards and patrol services | -- | 9 | 2 |
Services to buildings and dwellings | 39 | 31 | 7 |
Exterminating and pest control services | -- | 3 | 1 |
Janitorial services | 6 | 4 | 1 |
Landscaping services | 28 | 22 | 5 |
Waste management and remediation services | 9 | 1 | 0 |
Remediation and other waste management services | 4 | 1 | 0 |
Remediation services | -- | 1 | 0 |
Educational and health services | 18 | -- | -- |
Health care and social assistance | 18 | 17 | 4 |
Ambulatory health care services | 9 | 10 | 2 |
Other ambulatory health care services | -- | 6 | 1 |
Nursing and residential care facilities | 5 | 4 | 1 |
Leisure and hospitality | 19 | 26 | 6 |
Arts, entertainment, and recreation | 5 | 5 | 1 |
Accommodation and food services | 14 | 21 | 5 |
Other services, except public administration | 18 | 21 | 5 |
Other services, except public administration | 18 | 21 | 5 |
Repair and maintenance | 13 | 14 | 3 |
Automotive repair and maintenance | 7 | 11 | 2 |
Automotive mechanical and electrical repair and maintenance | -- | 5 | 1 |
General automotive repair | -- | 3 | 1 |
Government (5) | -- | 54 | 12 |
Federal government | 25 | 12 | 3 |
State government | 7 | 3 | 1 |
Local government | 21 | 39 | 8 |
Footnotes: | |||
NOTE: Data for all years are final. Totals for major categories may include subcategories not shown separately. For complete information on how the data are coded and presented see our definitions page at https://www.bls.gov/iif/definitions/census-of-fatal-occupational-injuries-definitions.htm. Dashes indicate no data reported or data that do not meet publication criteria. CFOI fatal injury counts exclude illness-related deaths unless precipitated by an injury event. | |||
| Occupation (1) | 2020 | 2021 | |
|---|---|---|---|
| Number | Number | Percent | |
Total | 463 | 462 | 100 |
Management occupations | 19 | 16 | 3 |
Operations specialties managers | -- | 3 | 1 |
Other management occupations | 14 | 12 | 3 |
Farmers, ranchers, and other agricultural managers | 3 | 2 | 0 |
Farmers, ranchers, and other agricultural managers | 3 | 2 | 0 |
Property, real estate, and community association managers | -- | 7 | 2 |
Property, real estate, and community association managers | -- | 7 | 2 |
Community and social service occupations | -- | 4 | 1 |
Arts, design, entertainment, sports, and media occupations | 3 | 3 | 1 |
Entertainers and performers, sports and related workers | -- | 3 | 1 |
Athletes, coaches, umpires, and related workers | -- | -- | -- |
Athletes and sports competitors | -- | 1 | 0 |
Musicians, singers, and related workers | -- | 1 | 0 |
Musicians and singers | -- | 1 | 0 |
Healthcare practitioners and technical occupations | 6 | 10 | 2 |
Healthcare diagnosing or treating practitioners | -- | 7 | 2 |
Registered nurses | -- | 4 | 1 |
Registered nurses | -- | 4 | 1 |
Health technologists and technicians | -- | 3 | 1 |
Protective service occupations | 30 | 35 | 8 |
Food preparation and serving related occupations | 7 | 14 | 3 |
Supervisors of food preparation and serving workers | -- | 4 | 1 |
Supervisors of food preparation and serving workers | -- | 4 | 1 |
First-line supervisors of food preparation and serving workers | -- | 4 | 1 |
Food and beverage serving workers | -- | 5 | 1 |
Building and grounds cleaning and maintenance occupations | 44 | 38 | 8 |
Supervisors of building and grounds cleaning and maintenance workers | 3 | 6 | 1 |
First-line supervisors of building and grounds cleaning and maintenance workers | 3 | 6 | 1 |
Building cleaning and pest control workers | 12 | 13 | 3 |
Building cleaning workers | 12 | 10 | 2 |
Janitors and cleaners, except maids and housekeeping cleaners | 9 | 9 | 2 |
Pest control workers | -- | 3 | 1 |
Pest control workers | -- | 3 | 1 |
Grounds maintenance workers | 29 | 19 | 4 |
Grounds maintenance workers | 29 | 19 | 4 |
Landscaping and groundskeeping workers | 11 | 13 | 3 |
Tree trimmers and pruners | 17 | 6 | 1 |
Personal care and service occupations | 6 | 4 | 1 |
Sales and related occupations | 34 | 25 | 5 |
Supervisors of sales workers | 13 | 8 | 2 |
First-line supervisors of sales workers | 13 | 8 | 2 |
First-line supervisors of retail sales workers | -- | 8 | 2 |
Retail sales workers | 14 | 11 | 2 |
Cashiers | 9 | 5 | 1 |
Cashiers | 9 | 5 | 1 |
Retail salespersons | -- | 6 | 1 |
Retail salespersons | -- | 6 | 1 |
Office and administrative support occupations | 5 | 6 | 1 |
Farming, fishing, and forestry occupations | 25 | 29 | 6 |
Agricultural workers | 22 | 24 | 5 |
Forest, conservation, and logging workers | -- | -- | -- |
Logging workers | -- | 1 | 0 |
Fallers | -- | 1 | 0 |
Construction and extraction occupations | 90 | 81 | 18 |
Supervisors of construction and extraction workers | 5 | 10 | 2 |
First-line supervisors of construction trades and extraction workers | 5 | 10 | 2 |
First-line supervisors of construction trades and extraction workers | 5 | 10 | 2 |
Construction trades workers | 78 | 67 | 15 |
Carpenters | 4 | 6 | 1 |
Carpenters | 4 | 6 | 1 |
Cement masons, concrete finishers, and terrazzo workers | -- | 3 | 1 |
Cement masons and concrete finishers | -- | 3 | 1 |
Construction laborers | 34 | 24 | 5 |
Construction laborers | 34 | 24 | 5 |
Construction equipment operators | 5 | 6 | 1 |
Paving, surfacing, and tamping equipment operators | -- | 1 | 0 |
Operating engineers and other construction equipment operators | 5 | 5 | 1 |
Electricians | 5 | 5 | 1 |
Electricians | 5 | 5 | 1 |
Painters and paperhangers | 6 | 7 | 2 |
Painters, construction and maintenance | 6 | 7 | 2 |
Pipelayers, plumbers, pipefitters, and steamfitters | 4 | 5 | 1 |
Plumbers, pipefitters, and steamfitters | 4 | 5 | 1 |
Roofers | 9 | 6 | 1 |
Roofers | 9 | 6 | 1 |
Installation, maintenance, and repair occupations | 33 | 53 | 11 |
Supervisors of installation, maintenance, and repair workers | -- | 8 | 2 |
First-line supervisors of mechanics, installers, and repairers | -- | 8 | 2 |
First-line supervisors of mechanics, installers, and repairers | -- | 8 | 2 |
Vehicle and mobile equipment mechanics, installers, and repairers | 11 | 17 | 4 |
Automotive technicians and repairers | 3 | 5 | 1 |
Automotive service technicians and mechanics | 3 | 5 | 1 |
Heavy vehicle and mobile equipment service technicians and mechanics | -- | 7 | 2 |
Farm equipment mechanics and service technicians | -- | 4 | 1 |
Other installation, maintenance, and repair occupations | 17 | 28 | 6 |
Heating, air conditioning, and refrigeration mechanics and installers | -- | 3 | 1 |
Heating, air conditioning, and refrigeration mechanics and installers | -- | 3 | 1 |
Line installers and repairers | 7 | 7 | 2 |
Maintenance and repair workers, general | 6 | 15 | 3 |
Maintenance and repair workers, general | 6 | 15 | 3 |
Production occupations | 11 | 17 | 4 |
Supervisors of production workers | -- | 6 | 1 |
First-line supervisors of production and operating workers | -- | 6 | 1 |
First-line supervisors of production and operating workers | -- | 6 | 1 |
Other production occupations | -- | 6 | 1 |
Inspectors, testers, sorters, samplers, and weighers | -- | 3 | 1 |
Inspectors, testers, sorters, samplers, and weighers | -- | 3 | 1 |
Transportation and material moving occupations | 104 | 112 | 24 |
Supervisors of transportation and material moving workers | 3 | 3 | 1 |
First-line supervisors of transportation and material moving workers | 3 | 3 | 1 |
Air transportation workers | 5 | 7 | 2 |
Aircraft pilots and flight engineers | 5 | 7 | 2 |
Commercial pilots | -- | 6 | 1 |
Motor vehicle operators | 70 | 71 | 15 |
Driver/sales workers and truck drivers | 70 | 62 | 13 |
Driver/sales workers | 10 | 5 | 1 |
Heavy and tractor-trailer truck drivers | 56 | 48 | 10 |
Light truck drivers | 4 | 9 | 2 |
Passenger vehicle drivers | -- | 9 | 2 |
Material moving workers | 22 | 26 | 6 |
Laborers and material movers | 14 | 18 | 4 |
Laborers and freight, stock, and material movers, hand | 8 | 9 | 2 |
Packers and packagers, hand | -- | 3 | 1 |
Stockers and order fillers | -- | 5 | 1 |
Footnotes: | |||
NOTE: Data for all years are final. Totals for major categories may include subcategories not shown separately. For complete information on how the data are coded and presented see our definitions page at https://www.bls.gov/iif/definitions/census-of-fatal-occupational-injuries-definitions.htm. Dashes indicate no data reported or data that do not meet publication criteria. CFOI fatal injury counts exclude illness-related deaths unless precipitated by an injury event. | |||
| Worker characteristics | 2020 | 2021 | |
|---|---|---|---|
| Number | Number | Percent | |
Total | 463 | 462 | 100 |
Employee status | |||
Wage and salary workers (1) | 380 | 379 | 82 |
Self-employed (2) | 83 | 83 | 18 |
Gender | |||
Men | 428 | 424 | 92 |
Women | 35 | 38 | 8 |
Age (3) | |||
20 to 24 years | 27 | 28 | 6 |
25 to 34 years | 84 | 75 | 16 |
35 to 44 years | 71 | 82 | 18 |
45 to 54 years | 91 | 106 | 23 |
55 to 64 years | 108 | 106 | 23 |
65 years and over | 67 | 55 | 12 |
Race or ethnic origin (4) | |||
White, non-Hispanic | 180 | 142 | 31 |
Black or African-American, non-Hispanic | 28 | 33 | 7 |
Hispanic or Latino | 214 | 234 | 51 |
Asian, non-Hispanic | 31 | 41 | 9 |
Native Hawaiian or Pacific Islander, non-Hispanic | -- | 7 | 2 |
Footnotes: | |||
NOTE: Data for all years are final. Totals for major categories may include subcategories not shown separately. For complete information on how the data are coded and presented see our definitions page at https://www.bls.gov/iif/definitions/census-of-fatal-occupational-injuries-definitions.htm. Dashes indicate no data reported or data that do not meet publication criteria. CFOI fatal injury counts exclude illness-related deaths unless precipitated by an injury event. | |||
Last Modified Date: Thursday, April 20, 2023