An official website of the United States government
An official website of the United States government
The .gov means it's official.
Federal government websites often end in .gov or .mil. Before sharing sensitive information,
make sure you're on a federal government site.
The site is secure.
The
https:// ensures that you are connecting to the official website and that any
information you provide is encrypted and transmitted securely.
23-672-SAN
Thursday, April 13, 2023
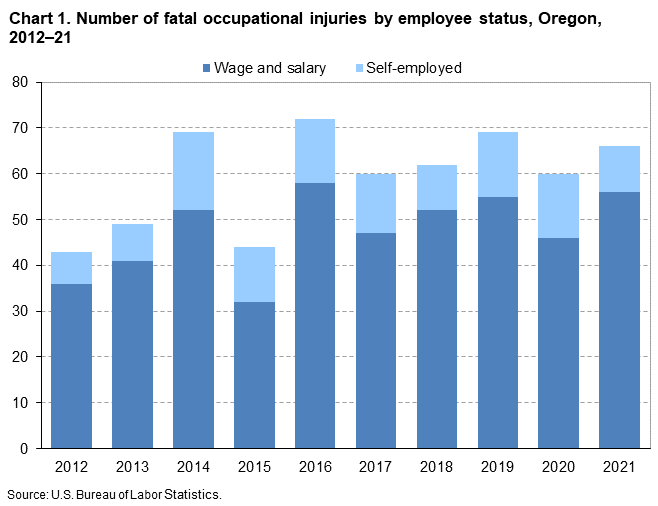
Fatal work injuries totaled 66 in 2021 for Oregon, the U.S. Bureau of Labor Statistics reported today. Regional Commissioner Chris Rosenlund noted that the number of work-related fatalities in Oregon was up from 60 the previous year. (See chart 1.) Fatal occupational injuries in the state have ranged from a high of 88 in 1992 to a low of 43 in 2012. Nationwide, a total of 5,190 fatal work injuries were recorded in 2021, a 9-percent increase from 4,764 in 2020, according to the results from the Census of Fatal Occupational Injuries (CFOI).
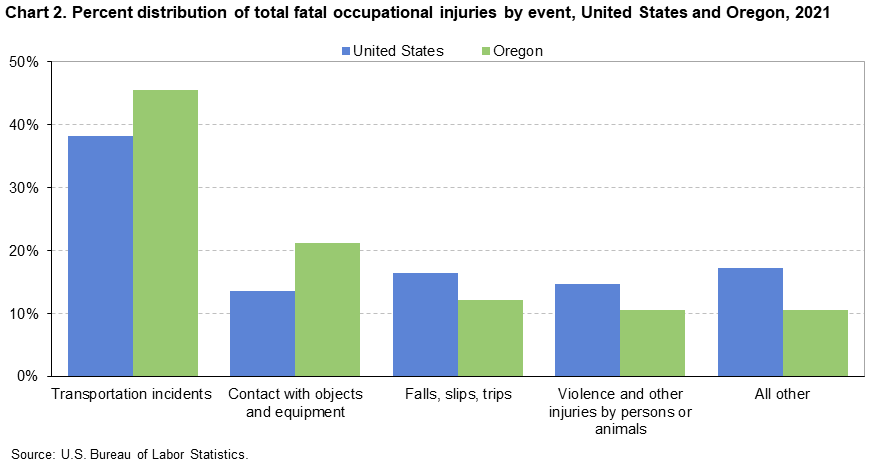
Fatal event or exposureIn Oregon, transportation incidents resulted in 30 fatal work injuries. Contact with objects and equipment accounted for 14 fatalities. These two major categories accounted for 67 percent of all fatal workplace injuries in the state. (See chart 2 and table 1.) Worker deaths from transportation incidents were up from 24 over the year and worker fatalities due to contact with objects and equipment were up from 10.
Nationally, transportation incidents were the most frequent fatal event in 2021, accounting for 38 percent of fatal work injuries. Falls, slips, and trips was the second-most common fatal event (16 percent), followed by both exposure to harmful substances or environments and violence and other injuries by persons or animals (15 percent each) and contact with objects and equipment (14 percent).
IndustryThe private transportation and warehousing industry sector had the highest number of fatalities in Oregon with 17, up from 12 in the previous year. (See table 2.) Transportation incidents resulted in 12 of the 17 fatalities in the industry. The truck transportation subsector accounted for 11 of the 17 fatal workplace injuries in the transportation and warehousing industry.
The private agriculture, forestry, fishing, and hunting industry sector had 12 fatal workplace injuries, up from 10 in the previous year. Contact with objects and equipment resulted in 6 of the 12 fatalities in the industry. The support activities for agriculture and forestry subsector accounted for five, or 42 percent, of the fatal injuries in this industry.
OccupationThe transportation and material moving occupational group had the highest number of fatal workplace injuries with 20. (See table 3.) Motor vehicle operators accounted for 17 of the 20 fatalities among transportation and material moving workers. The farming, fishing, and forestry occupational group had the second-highest number of fatal workplace injuries with 11, followed by construction and extraction occupations with 10.
Additional highlights:White non-Hispanics accounted for 76 percent of those who died from a workplace injury. Nationwide, this group accounted for 60 percent of work-related deaths.
Workers 25-54 years old accounted for 53 percent of the state’s work-related fatalities in 2021, compared to 57 percent of on-the-job fatalities nationally.
Of the 66 fatal work injuries in Oregon, 85 percent worked for wages and salaries; the remainder were self-employed. The most frequent fatal event for wage and salary workers was transportation incidents; the most frequent fatal event for self-employed workers was falls, slips, and trips.
Background of the program. The Census of Fatal Occupational Injuries (CFOI), part of the Bureau of Labor Statistics (BLS) Occupational Safety and Health Statistics (OSHS) program, is a count of all fatalities resulting from workplace injuries occurring in the U.S. during the calendar year. The CFOI uses a variety of state, federal, and independent data sources to identify, verify, and describe fatal work injuries. This ensures counts are as complete and accurate as possible. For the 2021 national data, over 23,900 unique source documents were reviewed as part of the data collection process. For technical information and definitions for the CFOI, see the BLS Handbook of Methods at www.bls.gov/opub/hom/cfoi/home.htm and the CFOI definitions at www.bls.gov/iif/definitions/occupational-safety-and-health-definitions.htm.
Federal/State agency coverage. The CFOI includes data for all fatal work injuries, some of which may be outside the scope of other agencies or regulatory coverage. Comparisons between CFOI counts and those released by other agencies should account for the different coverage requirements and definitions used by each agency. For more information on the scope of CFOI, see www.bls.gov/iif/overview/cfoi-scope.htm and www.bls.gov/opub/hom/cfoi/concepts.htm.
Latency Cases. Latent fatal occupational injury cases occur when the date of injury differs from the date of death. In some cases, the death occurs in a different year than the occupational injury and are known as cross-year latent cases. In 2021, there were 197 cases nationally where this occurred, and 174 of these latent cases occurred more than 30 days prior to the start of 2021. For more information on latent cases, see www.bls.gov/opub/btn/volume-10/latency-in-fatal-occupational-injuries.htm.
Coronavirus (COVID-19) Pandemic and the Census of Fatal Occupational Injuries. CFOI reports fatal workplace injuries only. These may include fatal workplace injuries complicated by an illness such as COVID-19. Fatal workplace illnesses not precipitated by an injury are not in scope for CFOI. CFOI does not report any illness related information, including COVID-19. Additional information is available at www.bls.gov/covid19/effects-of-covid-19-on-workplace-injuries-and-illnesses-compensation-and-occupational-requirements.htm.
Acknowledgments. BLS thanks the Oregon Department of Consumer and Business Services for their efforts in collecting accurate, comprehensive, and useful data on fatal work injuries. BLS also appreciates the efforts of all federal, state, local, and private sector entities that provided source documents used to identify fatal work injuries. Among these agencies are the Occupational Safety and Health Administration; the National Transportation Safety Board; the U.S. Coast Guard; the Mine Safety and Health Administration; the Office of Workers’ Compensation Programs (Federal Employees' Compensation and Longshore and Harbor Workers' Compensation divisions); the Federal Railroad Administration; the National Highway Traffic Safety Administration; state vital statistics registrars, coroners, and medical examiners; state departments of health, labor, and industrial relations and workers' compensation agencies; state and local police departments; and state farm bureaus.
Information in this release will be made available to individuals with sensory impairments upon request. Voice phone: (202) 691-5200; Telecommunications Relay Service: 7-1-1.
| Event or exposure (1) | 2020 | 2021 | |
|---|---|---|---|
| Number | Number | Percent | |
Total | 60 | 66 | 100 |
Violence and other injuries by persons or animals | -- | 7 | 11 |
Transportation incidents | 24 | 30 | 45 |
Pedestrian vehicular incident | 4 | 7 | 11 |
Pedestrian struck by vehicle in roadway | -- | 3 | 5 |
Pedestrian struck by vehicle in nonroadway area | -- | 3 | 5 |
Pedestrian struck by vehicle backing up in nonroadway area | -- | 3 | 5 |
Roadway incidents involving motorized land vehicle | 12 | 15 | 23 |
Roadway collision with other vehicle | -- | 3 | 5 |
Roadway collision with object other than vehicle | 5 | 3 | 5 |
Vehicle struck object or animal on side of roadway | 5 | 1 | 2 |
Roadway noncollision incident | -- | 9 | 14 |
Jack-knifed or overturned, roadway | -- | 5 | 8 |
Ran off roadway | -- | 4 | 6 |
Nonroadway incident involving motorized land vehicles | 5 | 4 | 6 |
Nonroadway noncollision incident | -- | 4 | 6 |
Falls, slips, trips | 10 | 8 | 12 |
Contact with objects and equipment | 10 | 14 | 21 |
Footnotes: | |||
NOTE: Data for all years are final. Totals for major categories may include subcategories not shown separately. For complete information on how the data are coded and presented see our definitions page at https://www.bls.gov/iif/definitions/census-of-fatal-occupational-injuries-definitions.htm. Dashes indicate no data reported or data that do not meet publication criteria. CFOI fatal injury counts exclude illness-related deaths unless precipitated by an injury event. | |||
| Industry (1) | 2020 | 2021 | |
|---|---|---|---|
| Number | Number | Percent | |
Total | 60 | 66 | 100 |
Private industry (2) | 56 | 63 | 95 |
Goods producing | -- | -- | -- |
Natural resources and mining | 11 | 12 | 18 |
Agriculture, forestry, fishing and hunting | 10 | 12 | 18 |
Fishing, hunting and trapping | -- | 2 | 3 |
Support activities for agriculture and forestry | -- | 5 | 8 |
Construction | 10 | 9 | 14 |
Construction | 10 | 9 | 14 |
Construction of buildings | -- | 5 | 8 |
Manufacturing | 5 | 5 | 8 |
Manufacturing | 5 | 5 | 8 |
Service providing (3) | -- | -- | -- |
Trade, transportation, and utilities | -- | -- | -- |
Wholesale trade | -- | 3 | 5 |
Transportation and warehousing | 12 | 17 | 26 |
Truck transportation | 7 | 11 | 17 |
General freight trucking | -- | 5 | 8 |
Specialized freight trucking | -- | 6 | 9 |
Specialized freight (except used goods) trucking, local | -- | 3 | 5 |
Specialized freight (except used goods) trucking, long-distance | -- | 3 | 5 |
Couriers and messengers | -- | 1 | 2 |
Local messengers and local delivery | -- | 1 | 2 |
Local messengers and local delivery | -- | 1 | 2 |
Professional and business services | 6 | -- | -- |
Administrative and support and waste management and remediation services | 6 | 4 | 6 |
Administrative and support services | -- | 4 | 6 |
Services to buildings and dwellings | -- | 3 | 5 |
Landscaping services | -- | 3 | 5 |
Other support services | -- | 1 | 2 |
Educational and health services | -- | 3 | 5 |
Health care and social assistance | -- | 3 | 5 |
Government (4) | -- | -- | -- |
State government | -- | 1 | 2 |
Footnotes: | |||
NOTE: Data for all years are final. Totals for major categories may include subcategories not shown separately. For complete information on how the data are coded and presented see our definitions page at https://www.bls.gov/iif/definitions/census-of-fatal-occupational-injuries-definitions.htm. Dashes indicate no data reported or data that do not meet publication criteria. CFOI fatal injury counts exclude illness-related deaths unless precipitated by an injury event. | |||
| Occupation (1) | 2020 | 2021 | |
|---|---|---|---|
| Number | Number | Percent | |
Total | 60 | 66 | 100 |
Management occupations | 4 | 6 | 9 |
Other management occupations | -- | 3 | 5 |
Protective service occupations | -- | 5 | 8 |
Building and grounds cleaning and maintenance occupations | 7 | 4 | 6 |
Grounds maintenance workers | 4 | 4 | 6 |
Grounds maintenance workers | 4 | 4 | 6 |
Sales and related occupations | -- | 3 | 5 |
Farming, fishing, and forestry occupations | 7 | 11 | 17 |
Supervisors of farming, fishing, and forestry workers | -- | 3 | 5 |
First-line supervisors of farming, fishing, and forestry workers | -- | 3 | 5 |
First-line supervisors of farming, fishing, and forestry workers | -- | 3 | 5 |
Agricultural workers | -- | 3 | 5 |
Miscellaneous agricultural workers | -- | 3 | 5 |
Fishing and hunting workers | -- | 2 | 3 |
Fishing and hunting workers | -- | 2 | 3 |
Fishing and hunting workers | -- | 2 | 3 |
Forest, conservation, and logging workers | 3 | 3 | 5 |
Construction and extraction occupations | 12 | 10 | 15 |
Construction trades workers | -- | 7 | 11 |
Carpenters | -- | 3 | 5 |
Carpenters | -- | 3 | 5 |
Installation, maintenance, and repair occupations | 3 | 3 | 5 |
Transportation and material moving occupations | 17 | 20 | 30 |
Motor vehicle operators | 7 | 17 | 26 |
Material moving workers | 7 | 3 | 5 |
Laborers and material movers | -- | 3 | 5 |
Footnotes: | |||
NOTE: Data for all years are final. Totals for major categories may include subcategories not shown separately. For complete information on how the data are coded and presented see our definitions page at https://www.bls.gov/iif/definitions/census-of-fatal-occupational-injuries-definitions.htm. Dashes indicate no data reported or data that do not meet publication criteria. CFOI fatal injury counts exclude illness-related deaths unless precipitated by an injury event. | |||
| Worker characteristics | 2020 | 2021 | |
|---|---|---|---|
| Number | Number | Percent | |
Total | 60 | 66 | 100 |
Employee status | |||
Wage and salary workers (1) | 46 | 56 | 85 |
Self-employed (2) | 14 | 10 | 15 |
Gender | |||
Men | 55 | 61 | 92 |
Women | 5 | 5 | 8 |
Age (3) | |||
20 to 24 years | 6 | 3 | 5 |
25 to 34 years | 11 | 8 | 12 |
35 to 44 years | 11 | 12 | 18 |
45 to 54 years | 10 | 15 | 23 |
55 to 64 years | 13 | 18 | 27 |
65 years and over | 9 | 8 | 12 |
Race or ethnic origin (4) | |||
White, non-Hispanic | 39 | 50 | 76 |
Black or African-American, non-Hispanic | -- | -- | -- |
Hispanic or Latino | 13 | 13 | 20 |
Footnotes: | |||
NOTE: Data for all years are final. Totals for major categories may include subcategories not shown separately. For complete information on how the data are coded and presented see our definitions page at https://www.bls.gov/iif/definitions/census-of-fatal-occupational-injuries-definitions.htm. Dashes indicate no data reported or data that do not meet publication criteria. CFOI fatal injury counts exclude illness-related deaths unless precipitated by an injury event. | |||
Last Modified Date: Thursday, April 13, 2023