An official website of the United States government
An official website of the United States government
The .gov means it's official.
Federal government websites often end in .gov or .mil. Before sharing sensitive information,
make sure you're on a federal government site.
The site is secure.
The
https:// ensures that you are connecting to the official website and that any
information you provide is encrypted and transmitted securely.
25-1291-SAN
Tuesday, August 12, 2025
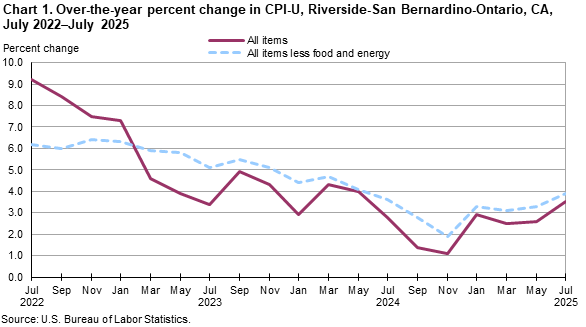
The Consumer Price Index for All Urban Consumers (CPI-U) for Riverside-San Bernardino-Ontario advanced 0.2 percent for the two months ending in July 2025, the U.S. Bureau of Labor Statistics reported today. Regional Commissioner Chris Rosenlund noted that the index for all items less food and energy advanced 0.8 percent during the two-month period. The food index decreased 0.1 percent, and the energy index declined 5.3 percent. (Data in this report are not seasonally adjusted. Accordingly, bi-monthly changes may reflect seasonal influences.)
The Riverside area all items CPI-U increased 3.5 percent for the 12 months ending in July. The index for all items less food and energy increased 3.9 percent over the year. The food index rose 3.5 percent, while energy index declined 1.8 percent.
FoodThe food index decreased 0.1 percent for the two months ending in July. The index for food at home (grocery store purchases) declined 0.2 percent. The food away from home index (restaurant, cafeteria, and vending purchases) was unchanged for the same period.
The food index increased 3.5 percent over the year. The food at home index rose 2.1 percent. The food away from home index advanced 5.4 percent.
EnergyThe energy index declined 5.3 percent for the two months ending in July. Gasoline prices decreased 5.5 percent.
The energy index decreased 1.8 percent over the year. Gasoline prices fell 5.2 percent.
All items less food and energyThe index for all items less food and energy advanced 0.8 percent during the two-month period. Among the index’s components, prices were higher for medical care (+5.4 percent) and shelter (+0.8 percent). In contrast, prices were lower for apparel (-5.1 percent) and education and communication (-1.2 percent).
The index for all items less food and energy increased 3.9 percent over the year, reflecting higher prices for medical care (+6.8 percent) and shelter (+3.4 percent). In contrast, prices were lower for education and communication (-2.8 percent).
| Month | 2021 | 2022 | 2023 | 2024 | 2025 | |||||
|---|---|---|---|---|---|---|---|---|---|---|
| 2-month | 12-month | 2-month | 12-month | 2-month | 12-month | 2-month | 12-month | 2-month | 12-month | |
|
January |
0.9 | 2.2 | 1.5 | 8.6 | 1.3 | 7.3 | 0.0 | 2.9 | 1.8 | 2.9 |
|
March |
1.3 | 3.6 | 2.7 | 10.0 | 0.0 | 4.6 | 1.4 | 4.3 | 1.0 | 2.5 |
|
May |
2.0 | 5.9 | 1.4 | 9.4 | 0.8 | 3.9 | 0.6 | 4.0 | 0.7 | 2.6 |
|
July |
1.3 | 6.5 | 1.1 | 9.2 | 0.6 | 3.4 | -0.6 | 2.8 | 0.2 | 3.5 |
|
September |
0.8 | 6.8 | 0.0 | 8.4 | 1.4 | 4.9 | 0.0 | 1.4 | ||
|
November |
1.4 | 7.9 | 0.6 | 7.5 | 0.0 | 4.3 | -0.2 | 1.1 | ||
The September 2025 Consumer Price Index for the Riverside area is scheduled to be released on October 15, 2025.
With this release, BLS has replaced survey data collected for the CPI’s wireless telephone services index with secondary source data and non-traditional index methods. Additional information is available on the CPI website, www.bls.gov/cpi/additional-resources/alternative-data-wireless-telephone.htm, and in a new factsheet “Measuring Price Change in the CPI: Wireless Telephone Services,” www.bls.gov/cpi/factsheets/wireless-telephone-service.htm.
With the release of October 2025 data on November 13, 2025, the Bureau of Labor Statistics (BLS) will remove long-term care (LTC) insurance from the health insurance index. Changes in the market for LTC insurance have made it out of scope and ineligible for pricing in the CPI market basket.
The Consumer Price Index (CPI) is a measure of the average change in prices over time in a fixed market basket of goods and services. The Consumer Price Index for Riverside is published bi-monthly. The set of components and sub-aggregates published for regional and metropolitan indexes is more limited than at the U.S. city average level; these indexes are byproducts of the national CPI program. Each local index has a much smaller sample size than the national or regional indexes and is, therefore, subject to substantially more sampling and other measurement error. As a result, local-area indexes are more volatile than the national or regional indexes. In addition, local indexes are not adjusted for seasonal influences. NOTE: Area indexes do not measure differences in the level of prices between cities; they only measure the average change in prices for each area since the base period.
Percent changes for all-items data previously found in Table A of this release can be accessed in Chart 1 for this release and its attendant data table. A full all-items data series history for the original index value and for 1-month, 2-month, 3-month, 6-month, and 12-month percent changes can be accessed via BLS data query tools. A direct link to the all-items series is provided in Table 1 of this release under historical data.
The Riverside-San Bernardino-Ontario, CA Core Based Statistical Area includes Riverside and San Bernardino Counties in California.
Refer to the national CPI news release technical note or the Handbook of Methods for more information.
Information in this release will be made available to individuals with sensory impairments upon request. Voice phone: (202) 691-5200; Telecommunications Relay Service: 7-1-1.
| Expenditure category |
Indexes | Percent change from - | |||||
|---|---|---|---|---|---|---|---|
| Historical data |
May 2025 |
Jun. 2025 |
Jul. 2025 |
Jul. 2024 |
May 2025 |
Jun. 2025 |
|
|
All Items |
|
137.456 | - | 137.708 | 3.5 | 0.2 | - |
|
Food and beverages |
|
140.683 | - | 140.564 | 3.7 | -0.1 | - |
|
Food |
|
142.044 | - | 141.858 | 3.5 | -0.1 | - |
|
Food at home |
|
134.528 | 134.224 | 134.206 | 2.1 | -0.2 | 0.0 |
|
Cereals and bakery products |
|
- | - | - | - | - | - |
|
Meats, poultry, fish, and eggs |
|
- | - | - | - | - | - |
|
Dairy and related products |
|
115.627 | 109.483 | 117.515 | 6.1 | 1.6 | 7.3 |
|
Fruits and vegetables |
|
123.626 | 124.110 | 117.345 | -11.3 | -5.1 | -5.5 |
|
Nonalcoholic beverages and beverage materials |
|
140.059 | 137.957 | 137.420 | 6.5 | -1.9 | -0.4 |
|
Other food at home |
|
126.098 | 128.420 | 128.011 | 2.2 | 1.5 | -0.3 |
|
Food away from home |
|
152.969 | - | 152.975 | 5.4 | 0.0 | - |
|
Alcoholic beverages |
|
- | - | - | - | - | - |
|
Housing |
|
144.329 | - | 145.271 | 3.5 | 0.7 | - |
|
Shelter |
|
144.649 | 146.474 | 145.852 | 3.4 | 0.8 | -0.4 |
|
Rent of primary residence |
|
152.100 | 152.552 | 152.330 | 5.1 | 0.2 | -0.1 |
|
Owners' equiv. rent of residences |
|
145.244 | 146.075 | 145.981 | 4.9 | 0.5 | -0.1 |
|
Owners' equiv. rent of primary residence |
|
145.244 | 146.075 | 145.981 | 4.9 | 0.5 | -0.1 |
|
Household furnishings and operations |
|
120.821 | - | 123.399 | 4.5 | 2.1 | - |
|
Apparel |
|
122.368 | - | 116.092 | 5.8 | -5.1 | - |
|
Transportation |
|
144.908 | - | 142.414 | 4.0 | -1.7 | - |
|
Private transportation |
|
148.230 | - | 146.122 | 4.1 | -1.4 | - |
|
New and used motor vehicles |
|
117.646 | - | 117.528 | 1.3 | -0.1 | - |
|
New vehicles |
|
115.477 | - | 114.418 | 0.5 | -0.9 | - |
|
Used cars and trucks |
|
135.659 | - | 138.262 | 5.4 | 1.9 | - |
|
Motor fuel |
|
152.661 | 148.129 | 144.532 | -5.0 | -5.3 | -2.4 |
|
Gasoline (all types) |
|
152.763 | 148.179 | 144.374 | -5.2 | -5.5 | -2.6 |
|
Unleaded regular(1) |
|
153.088 | 148.343 | 144.415 | -5.4 | -5.7 | -2.6 |
|
Unleaded midgrade(1) |
|
153.375 | 149.133 | 145.471 | -4.8 | -5.2 | -2.5 |
|
Unleaded premium(1) |
|
150.724 | 146.723 | 143.378 | -4.5 | -4.9 | -2.3 |
|
Medical Care |
|
130.911 | - | 138.039 | 6.8 | 5.4 | - |
|
Recreation |
|
112.350 | - | 114.655 | 2.2 | 2.1 | - |
|
Education and communication |
|
108.475 | - | 107.190 | -2.8 | -1.2 | - |
|
Tuition, other school fees, and child care |
|
132.985 | - | 133.905 | - | 0.7 | - |
|
Other goods and services |
|
- | - | - | - | - | - |
|
Footnotes |
|||||||
|
- Data not available. |
|||||||
| Special aggregate index |
Indexes | Percent change from - | |||||
|---|---|---|---|---|---|---|---|
| Historical data |
May 2025 |
Jun. 2025 |
Jul. 2025 |
Jul. 2024 |
May 2025 |
Jun. 2025 |
|
|
All items |
|
137.456 | - | 137.708 | 3.5 | 0.2 | - |
|
Food |
|
142.044 | - | 141.858 | 3.5 | -0.1 | - |
|
Energy |
|
162.034 | 155.244 | 153.388 | -1.8 | -5.3 | -1.2 |
|
All items less food and energy |
|
134.126 | - | 135.136 | 3.9 | 0.8 | - |
|
All items less energy |
|
135.202 | - | 136.032 | 3.9 | 0.6 | - |
|
All items less medical care |
|
137.937 | - | 137.704 | 3.2 | -0.2 | - |
|
All items less shelter |
|
133.740 | - | 133.500 | 3.5 | -0.2 | - |
|
Commodities |
|
128.815 | - | 127.721 | 1.8 | -0.8 | - |
|
Commodities less food |
|
121.989 | - | 120.436 | 0.7 | -1.3 | - |
|
Commodities less food & beverages |
|
122.258 | - | 120.601 | 0.5 | -1.4 | - |
|
Durables |
|
112.295 | - | 112.275 | 1.0 | 0.0 | - |
|
Nondurables |
|
136.661 | - | 135.016 | 2.2 | -1.2 | - |
|
Nondurables less food & beverages |
|
132.389 | - | 128.850 | 0.4 | -2.7 | - |
|
Nondurables less food |
|
131.306 | - | 128.140 | 0.7 | -2.4 | - |
|
Services |
|
143.476 | - | 144.701 | 4.4 | 0.9 | - |
|
Services less rent of shelter |
|
141.558 | - | 142.976 | 6.1 | 1.0 | - |
|
Services less medical care services |
|
144.696 | - | 145.154 | 4.2 | 0.3 | - |
|
- Data not available. |
|||||||
Last Modified Date: Tuesday, August 12, 2025