An official website of the United States government
An official website of the United States government
The .gov means it's official.
Federal government websites often end in .gov or .mil. Before sharing sensitive information,
make sure you're on a federal government site.
The site is secure.
The
https:// ensures that you are connecting to the official website and that any
information you provide is encrypted and transmitted securely.
25-1439-SAN
Tuesday, September 16, 2025
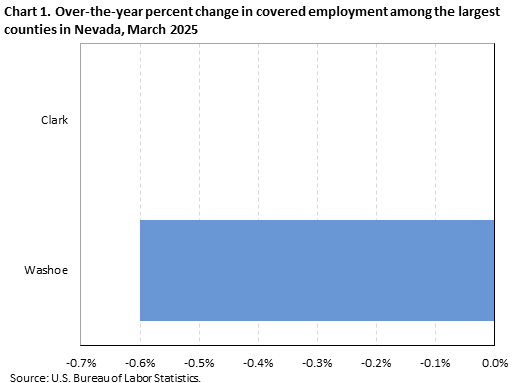
Employment decreased in 1 of the 2 largest counties in Nevada from March 2024 to March 2025, the U.S. Bureau of Labor Statistics reported today. Regional Commissioner Chris Rosenlund noted that employment in Washoe County fell 0.6 percent over the year, while employment in Clark County was unchanged. (See chart 1 and table 1.)
Among the two largest counties in Nevada, employment was highest in Clark (1,117,000) in March 2025. Together, the two largest counties accounted for 87.9 percent of total covered employment within the state. Nationwide, the 372 largest counties comprise 73.4 percent of total covered employment in the United States. (Large counties and county equivalents are those with annual average employment levels of 75,000 or more in 2024.)
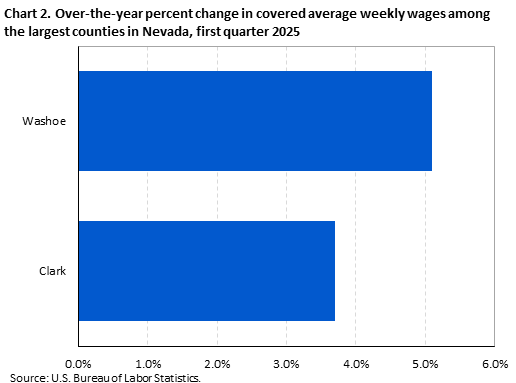
Large county average weekly wages in the first quarter 2025Both large Nevada counties reported average weekly wage increases over the year. (See chart 2.) Washoe had the larger increase (+5.1 percent), followed by Clark (+3.7 percent).
Weekly wages in Washoe ($1,382) and Clark ($1,322) were below the national average of $1,589.
Smaller county average weekly wages in the first quarter 2025Employment and wage levels (but not over-the-year changes) are also available for the 15 small counties in Nevada, defined as having employment below 75,000 in 2024. (See table 2.) Wage levels in 10 of the 15 smaller counties were below the national average. Eureka reported the highest average weekly wage ($2,769). Lincoln reported the lowest average weekly wage ($950) in the state.
Among all 17 Nevada counties, 5 reported average weekly wages of less than $1,300, 5 had wages from $1,300 to $1,449, 3 had wages from $1,450 to $1,599, and 4 had average weekly wages of $1,600 or higher. (See map 1 and table 2.)
QCEW data for states have been included in this release in table 3.
Nationwide coverage of the largest counties is published in the County Employment and Wages news release. Additional information about quarterly employment and wages data is available in the news release Technical Note and from the Quarterly Census of Employment and Wages website.
Information in this release will be made available to individuals with sensory impairments upon request. Voice phone: (202) 691-5200; Telecommunications Relay Service: 7-1-1.
The County Employment and Wages release for the second quarter 2025 is scheduled to be released on Wednesday, December 3, 2025.
Counties with annual average employment of 75,000 or more in 2024 are included in this release and will be included in future 2025 releases. Four counties have been added to the nationwide publication tables: Pinal, AZ; Henry, GA; Wood, OH; and Comal, TX. One county has been dropped from the publication tables: Gregg, TX.
| Area | Establishments, first quarter (thousands) | Employment | Average weekly wage (1) | |||||
|---|---|---|---|---|---|---|---|---|
| March 2025 (thousands) | Percent change, March 2024–25 (2) | National ranking by percent change (3) | First quarter 2025 ($) | National ranking by level (3) | Percent change, first quarter 2024–25 (2) | National ranking by percent change (3) | ||
United States (4) | 12,249.3 | 154,523.8 | 0.4 | -- | 1,589 | -- | 4.1 | -- |
Nevada | 106.1 | 1,541.2 | 0.2 | -- | 1,359 | 29 | 4.1 | 17 |
Clark | 64.6 | 1,117.0 | 0.0 | 222 | 1,322 | 198 | 3.7 | 138 |
Washoe | 16.8 | 237.1 | -0.6 | 301 | 1,382 | 166 | 5.1 | 53 |
Footnotes: | ||||||||
Note: Data are preliminary. Dashes indicate data not applicable or available. Covered employment and wages include workers covered by Unemployment Insurance (UI) and Unemployment Compensation for Federal Employees (UCFE) programs. | ||||||||
| Area | Establishments | Employment March 2025 | Average weekly wage ($) (1) |
|---|---|---|---|
United States (2) | 12,249,320 | 154,523,785 | 1,589 |
Nevada | 106,141 | 1,541,167 | 1,359 |
Churchill | 623 | 8,861 | 1,232 |
Clark | 64,550 | 1,117,044 | 1,322 |
Douglas | 2,012 | 20,541 | 1,482 |
Elko | 1,399 | 21,706 | 1,281 |
Esmeralda | 21 | 271 | 1,335 |
Eureka | 51 | 4,364 | 2,769 |
Humboldt | 479 | 7,619 | 1,516 |
Lander | 122 | 3,645 | 2,290 |
Lincoln | 126 | 1,350 | 950 |
Lyon | 1,090 | 13,435 | 1,099 |
Mineral | 87 | 1,122 | 1,010 |
Nye | 953 | 13,397 | 1,428 |
Pershing | 107 | 2,005 | 1,804 |
Storey | 258 | 20,396 | 1,589 |
Washoe | 16,754 | 237,130 | 1,382 |
White Pine | 262 | 4,277 | 1,634 |
Carson City | 2,074 | 32,058 | 1,355 |
Footnotes: | |||
Note: Data are preliminary. Dashes indicate data not applicable or available. Covered employment and wages include workers covered by Unemployment Insurance (UI) and Unemployment Compensation for Federal Employees (UCFE) programs. | |||
| State | Establishments, first quarter (thousands) | Employment | Average weekly wage (1) | ||||
|---|---|---|---|---|---|---|---|
| March 2025 (thousands) | Percent change, March 2024–25 | First quarter 2025 ($) | National ranking by level | Percent change, first quarter 2024–25 | National ranking by percent change | ||
United States (2) | 12,249.3 | 154,523.8 | 0.4 | 1,589 | -- | 4.1 | -- |
Alabama | 163.3 | 2,102.3 | 0.3 | 1,245 | 39 | 3.8 | 23 |
Alaska | 25.3 | 323.5 | 1.3 | 1,452 | 20 | 5.8 | 4 |
Arizona | 226.1 | 3,259.3 | 0.3 | 1,431 | 21 | 3.8 | 23 |
Arkansas | 107.6 | 1,304.4 | 0.7 | 1,236 | 40 | 5.6 | 6 |
California | 1,945.4 | 18,066.2 | 0.1 | 1,905 | 6 | 4.2 | 13 |
Colorado | 242.4 | 2,862.7 | 0.1 | 1,681 | 8 | 4.2 | 13 |
Connecticut | 148.5 | 1,671.7 | 0.5 | 1,980 | 4 | 3.8 | 23 |
Delaware | 45.4 | 474.3 | 0.8 | 1,535 | 15 | 3.4 | 30 |
District of Columbia | 51.5 | 748.9 | -1.4 | 2,606 | 1 | 7.2 | 1 |
Florida | 886.5 | 9,958.4 | 0.9 | 1,456 | 19 | 5.1 | 8 |
Georgia | 394.8 | 4,860.7 | 0.4 | 1,491 | 17 | 3.4 | 30 |
Hawaii | 60.3 | 644.8 | 0.6 | 1,363 | 27 | 6.7 | 2 |
Idaho | 102.7 | 848.2 | 1.2 | 1,178 | 48 | 4.2 | 13 |
Illinois | 407.1 | 5,988.9 | 0.2 | 1,662 | 9 | 3.2 | 38 |
Indiana | 194.8 | 3,161.4 | 0.3 | 1,323 | 30 | 4.2 | 13 |
Iowa | 111.3 | 1,537.7 | -0.5 | 1,253 | 36 | 3.2 | 38 |
Kansas | 104.3 | 1,428.0 | 0.8 | 1,246 | 38 | 4.0 | 19 |
Kentucky | 159.6 | 1,986.3 | 0.0 | 1,213 | 44 | 2.4 | 51 |
Louisiana | 157.0 | 1,921.2 | 0.5 | 1,227 | 42 | 2.8 | 49 |
Maine | 66.6 | 629.6 | 0.1 | 1,283 | 34 | 2.7 | 50 |
Maryland | 197.7 | 2,739.0 | -0.2 | 1,634 | 10 | 3.2 | 38 |
Massachusetts | 289.8 | 3,575.8 | -0.7 | 2,107 | 3 | 4.6 | 11 |
Michigan | 307.3 | 4,337.3 | -0.3 | 1,391 | 24 | 2.9 | 48 |
Minnesota | 211.8 | 2,878.6 | -0.1 | 1,570 | 14 | 3.7 | 27 |
Mississippi | 91.3 | 1,160.4 | -0.4 | 1,018 | 51 | 4.1 | 17 |
Missouri | 252.4 | 2,886.9 | 0.1 | 1,310 | 31 | 3.2 | 38 |
Montana | 67.1 | 505.8 | 0.6 | 1,189 | 46 | 5.6 | 6 |
Nebraska | 78.6 | 1,008.4 | -0.1 | 1,231 | 41 | 3.1 | 42 |
Nevada | 106.1 | 1,541.2 | 0.2 | 1,359 | 29 | 4.1 | 17 |
New Hampshire | 66.3 | 681.0 | 0.1 | 1,606 | 11 | 4.8 | 9 |
New Jersey | 338.9 | 4,259.0 | 1.1 | 1,815 | 7 | 3.0 | 44 |
New Mexico | 66.8 | 868.2 | 0.3 | 1,203 | 45 | 3.9 | 22 |
New York | 716.1 | 9,757.0 | 1.4 | 2,213 | 2 | 6.2 | 3 |
North Carolina | 373.2 | 4,888.5 | 0.2 | 1,467 | 18 | 4.8 | 9 |
North Dakota | 36.4 | 422.8 | 0.6 | 1,302 | 33 | 3.3 | 34 |
Ohio | 344.2 | 5,466.8 | 0.2 | 1,361 | 28 | 3.5 | 28 |
Oklahoma | 130.9 | 1,700.2 | 0.5 | 1,186 | 47 | 3.0 | 44 |
Oregon | 186.2 | 1,965.7 | -0.8 | 1,420 | 23 | 3.3 | 34 |
Pennsylvania | 394.5 | 6,003.5 | 0.6 | 1,500 | 16 | 3.5 | 28 |
Rhode Island | 49.0 | 489.3 | 1.0 | 1,429 | 22 | 3.0 | 44 |
South Carolina | 198.7 | 2,304.9 | 1.7 | 1,247 | 37 | 4.4 | 12 |
South Dakota | 40.5 | 450.5 | 0.2 | 1,163 | 49 | 3.0 | 44 |
Tennessee | 221.0 | 3,251.5 | -0.4 | 1,364 | 26 | 4.0 | 19 |
Texas | 847.6 | 14,015.9 | 1.2 | 1,587 | 13 | 3.1 | 42 |
Utah | 138.1 | 1,720.5 | 1.1 | 1,365 | 25 | 4.0 | 19 |
Vermont | 33.5 | 306.8 | -0.4 | 1,280 | 35 | 3.8 | 23 |
Virginia | 321.9 | 4,108.8 | 0.8 | 1,605 | 12 | 3.4 | 30 |
Washington | 240.9 | 3,583.7 | 0.9 | 1,935 | 5 | 5.8 | 4 |
West Virginia | 61.9 | 694.6 | 0.0 | 1,149 | 50 | 3.3 | 34 |
Wisconsin | 208.9 | 2,898.4 | -0.2 | 1,305 | 32 | 3.4 | 30 |
Wyoming | 31.0 | 274.6 | 0.0 | 1,216 | 43 | 3.3 | 34 |
Puerto Rico | 52.0 | 946.1 | -0.7 | 699 | (3) | 3.2 | (3) |
Virgin Islands | 2.9 | 33.8 | -7.5 | 1,034 | (3) | 2.7 | (3) |
Footnotes: | |||||||
Note: Data are preliminary. Dashes indicate data not applicable or available. Covered employment and wages include workers covered by Unemployment Insurance (UI) and Unemployment Compensation for Federal Employees (UCFE) programs. | |||||||
Last Modified Date: Tuesday, September 16, 2025