An official website of the United States government
An official website of the United States government
The .gov means it's official.
Federal government websites often end in .gov or .mil. Before sharing sensitive information,
make sure you're on a federal government site.
The site is secure.
The
https:// ensures that you are connecting to the official website and that any
information you provide is encrypted and transmitted securely.

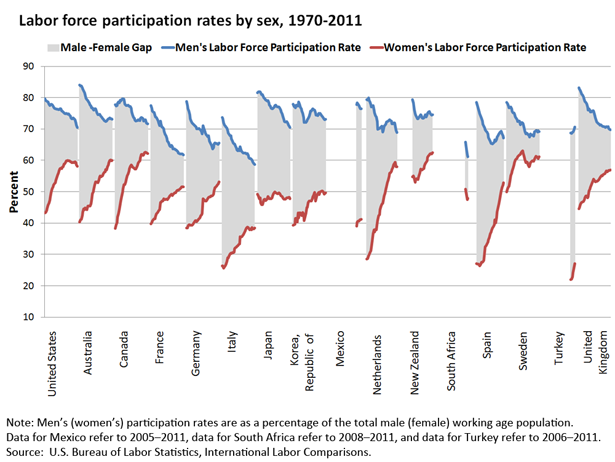
| Year | United States | Australia | Canada | France | Germany | Italy | Japan | Korea, Republic of | Mexico | Netherlands | New Zealand | South Africa | Spain | Sweden | Turkey | United Kingdom |
|---|---|---|---|---|---|---|---|---|---|---|---|---|---|---|---|---|
1970 | 79.7 | 84.1 | 77.8 | 77.5 | 78.8 | 73.7 | 81.5 | 77.9 | NA | NA | NA | NA | NA | 78.5 | NA | NA |
1971 | 79.1 | 83.8 | 77.3 | 76.6 | 77.5 | 73.4 | 81.9 | 77.2 | NA | NA | NA | NA | NA | 78.0 | NA | 83.1 |
1972 | 78.9 | 83.7 | 77.5 | 75.8 | 76.4 | 72.0 | 81.8 | 77.5 | NA | NA | NA | NA | NA | 77.3 | NA | 82.8 |
1973 | 78.8 | 83.2 | 78.2 | 75.5 | 75.8 | 71.2 | 81.8 | 76.8 | NA | 79.4 | NA | NA | NA | 76.8 | NA | 82.3 |
1974 | 78.7 | 82.7 | 78.7 | 75.3 | 74.6 | 71.0 | 81.6 | 77.7 | NA | 79.3 | NA | NA | NA | 76.8 | NA | 81.5 |
1975 | 77.9 | 82.2 | 78.4 | 74.3 | 73.3 | 70.6 | 81.0 | 77.4 | NA | 80.0 | NA | NA | NA | 77.0 | NA | 81.2 |
1976 | 77.5 | 81.5 | 79.2 | 73.9 | 72.5 | 70.4 | 81.0 | 77.4 | NA | 79.2 | NA | NA | NA | 76.5 | NA | 80.9 |
1977 | 77.7 | 81.0 | 79.0 | 73.7 | 71.9 | 69.5 | 80.3 | 78.7 | NA | 78.7 | NA | NA | 78.5 | 75.6 | NA | 80.2 |
1978 | 77.9 | 79.8 | 79.4 | 73.1 | 71.6 | 68.7 | 80.0 | 77.9 | NA | 77.8 | NA | NA | 77.5 | 75.1 | NA | 79.3 |
1979 | 77.8 | 79.4 | 79.6 | 72.6 | 71.5 | 68.3 | 79.7 | 76.9 | NA | 77.0 | NA | NA | 76.5 | 75.1 | NA | 78.8 |
1980 | 77.4 | 79.1 | 79.5 | 71.9 | 71.2 | 67.9 | 79.3 | 76.4 | NA | 77.4 | NA | NA | 75.5 | 74.9 | NA | 78.5 |
1981 | 77.0 | 78.8 | 79.5 | 71.1 | 70.9 | 67.8 | 79.3 | 75.8 | NA | 77.5 | NA | NA | 74.9 | 73.8 | NA | 78.1 |
1982 | 76.6 | 78.4 | 77.9 | 72.5 | 70.6 | 66.9 | 79.0 | 75.0 | NA | 76.1 | NA | NA | 74.2 | 73.4 | NA | 77.0 |
1983 | 76.4 | 77.6 | 77.7 | 71.7 | 70.1 | 66.2 | 79.1 | 73.7 | NA | 75.2 | NA | NA | 73.4 | 72.9 | NA | 76.1 |
1984 | 76.4 | 77.3 | 77.5 | 70.7 | 70.0 | 65.6 | 78.4 | 72.1 | NA | 74.3 | NA | NA | 72.6 | 72.4 | NA | 76.4 |
1985 | 76.3 | 76.7 | 77.5 | 70.5 | 70.1 | 65.3 | 77.6 | 72.3 | NA | 73.8 | NA | NA | 71.5 | 72.5 | NA | 76.1 |
1986 | 76.3 | 76.7 | 77.6 | 70.0 | 70.2 | 65.2 | 77.3 | 72.1 | NA | 72.4 | 79.4 | NA | 71.0 | 72.5 | NA | 75.5 |
1987 | 76.2 | 76.2 | 77.4 | 69.2 | 69.9 | 64.5 | 76.6 | 72.5 | NA | 69.9 | 78.4 | NA | 70.4 | 71.3 | NA | 75.4 |
1988 | 76.2 | 76.0 | 77.2 | 68.3 | 69.6 | 63.9 | 76.5 | 72.9 | NA | 70.1 | 76.2 | NA | 69.8 | 71.7 | NA | 75.7 |
1989 | 76.4 | 76.4 | 77.2 | 67.8 | 69.1 | 63.4 | 76.4 | 73.4 | NA | 70.2 | 74.9 | NA | 69.3 | 72.1 | NA | 75.9 |
1990 | 76.4 | 76.5 | 76.6 | 67.0 | 68.5 | 63.0 | 76.7 | 74.0 | NA | 70.4 | 74.4 | NA | 69.0 | 72.0 | NA | 75.7 |
1991 | 75.8 | 75.6 | 75.5 | 66.1 | 71.1 | 63.7 | 77.1 | 75.0 | NA | 70.7 | 73.9 | NA | 68.5 | 71.7 | NA | 74.7 |
1992 | 75.8 | 75.1 | 74.4 | 65.9 | 70.1 | 63.1 | 77.5 | 75.7 | NA | 71.0 | 73.2 | NA | 67.3 | 70.5 | NA | 73.5 |
1993 | 75.4 | 74.5 | 73.7 | 65.1 | 69.3 | 64.3 | 77.6 | 75.7 | NA | 69.1 | 73.2 | NA | 66.7 | 69.2 | NA | 72.7 |
1994 | 75.1 | 74.5 | 73.4 | 64.7 | 68.8 | 63.4 | 77.2 | 76.3 | NA | 69.4 | 73.7 | NA | 66.1 | 68.5 | NA | 72.3 |
1995 | 75.0 | 74.7 | 72.8 | 64.4 | 68.1 | 62.8 | 77.0 | 76.4 | NA | 70.9 | 74.2 | NA | 65.4 | 68.8 | NA | 72.0 |
1996 | 74.9 | 74.4 | 72.5 | 64.8 | 67.8 | 62.5 | 77.1 | 76.2 | NA | 71.2 | 74.5 | NA | 65.4 | 68.6 | NA | 71.7 |
1997 | 75.0 | 74.0 | 72.7 | 64.3 | 67.6 | 62.3 | 77.1 | 76.1 | NA | 71.7 | 74.4 | NA | 65.3 | 68.1 | NA | 71.5 |
1998 | 74.9 | 73.7 | 72.7 | 63.7 | 67.9 | 62.4 | 76.6 | 75.1 | NA | 72.3 | 73.6 | NA | 65.6 | 68.0 | NA | 71.2 |
1999 | 74.7 | 73.4 | 72.9 | 63.7 | 66.1 | 62.3 | 76.1 | 74.4 | NA | 72.4 | 73.4 | NA | 65.9 | 67.5 | NA | 71.4 |
2000 | 74.8 | 73.1 | 72.8 | 63.7 | 65.6 | 62.3 | 75.5 | 74.4 | NA | 72.6 | 73.6 | NA | 66.5 | 68.5 | NA | 71.1 |
2001 | 74.4 | 72.7 | 72.7 | 63.3 | 65.3 | 62.0 | 74.8 | 74.3 | NA | 72.8 | 73.9 | NA | 66.1 | 68.0 | NA | 70.9 |
2002 | 74.1 | 72.5 | 73.4 | 63.4 | 64.6 | 62.2 | 73.8 | 75.0 | NA | 73.0 | 74.6 | NA | 66.7 | 68.1 | NA | 70.8 |
2003 | 73.5 | 72.4 | 73.7 | 63.1 | 63.7 | 61.6 | 73.0 | 74.7 | NA | 72.7 | 73.8 | NA | 67.4 | 68.0 | NA | 70.8 |
2004 | 73.3 | 72.6 | 73.5 | 62.7 | 64.1 | 60.9 | 72.4 | 75.0 | NA | 72.5 | 74.6 | NA | 67.8 | 67.7 | NA | 70.6 |
2005 | 73.3 | 73.0 | 73.2 | 62.4 | 65.2 | 60.6 | 72.3 | 74.6 | 77.8 | 71.7 | 75.0 | NA | 68.5 | 69.2 | NA | 70.5 |
2006 | 73.5 | 73.2 | 72.6 | 62.2 | 65.5 | 60.6 | 72.2 | 74.1 | 78.3 | 71.6 | 75.5 | NA | 68.9 | 69.2 | 68.7 | 70.8 |
2007 | 73.2 | 73.3 | 72.8 | 62.0 | 65.4 | 60.3 | 72.4 | 74.0 | 77.9 | 71.9 | 75.6 | NA | 69.0 | 69.5 | 68.6 | 70.7 |
2008 | 73.0 | 73.6 | 73.0 | 62.0 | 65.4 | 60.2 | 71.9 | 73.5 | 77.5 | 71.9 | 75.2 | 65.8 | 69.3 | 69.5 | 69.0 | 70.8 |
2009 | 72.0 | 73.3 | 72.0 | 62.1 | 65.3 | 59.4 | 71.2 | 73.1 | 76.7 | 71.2 | 74.7 | 63.7 | 68.4 | 69.0 | 69.1 | 70.2 |
2010 | 71.2 | 73.3 | 71.8 | 62.0 | 65.1 | 59.0 | 70.8 | 73.0 | 76.5 | 69.6 | 74.4 | 61.8 | 67.8 | 69.4 | 69.6 | 69.9 |
2011 | 70.5 | 73.1 | 71.7 | 61.7 | 65.5 | 58.7 | 70.5 | 73.1 | 76.4 | 68.9 | 74.6 | 61.2 | 67.2 | 69.2 | 70.6 | 69.7 |
Note: Men's (women's) participation rates are as a percentage of the total male (female) working age population. Data for Mexico refer to 2005–2011, data for South Africa refer to 2008–2011, and data for Turkey refer to 2006–2011. | ||||||||||||||||
| Year | United States | Australia | Canada | France | Germany | Italy | Japan | Korea, Republic of | Mexico | Netherlands | New Zealand | South Africa | Spain | Sweden | Turkey | United Kingdom |
|---|---|---|---|---|---|---|---|---|---|---|---|---|---|---|---|---|
1970 | 43.3 | 40.4 | 38.3 | 39.8 | 38.4 | 26.4 | 49.2 | 39.3 | NA | NA | NA | NA | NA | 50.0 | NA | NA |
1971 | 43.4 | 41.0 | 39.4 | 40.2 | 38.5 | 26.3 | 48.6 | 39.5 | NA | NA | NA | NA | NA | 50.9 | NA | 44.6 |
1972 | 43.9 | 41.2 | 40.2 | 40.6 | 39.0 | 25.6 | 47.8 | 39.6 | NA | NA | NA | NA | NA | 51.5 | NA | 44.9 |
1973 | 44.7 | 42.4 | 41.9 | 41.1 | 39.5 | 26.1 | 48.0 | 41.5 | NA | 28.5 | NA | NA | NA | 51.7 | NA | 45.8 |
1974 | 45.7 | 43.5 | 43.0 | 41.4 | 39.4 | 26.5 | 46.5 | 41.5 | NA | 28.7 | NA | NA | NA | 53.3 | NA | 46.4 |
1975 | 46.3 | 44.5 | 44.4 | 41.3 | 39.3 | 26.8 | 45.8 | 40.4 | NA | 29.5 | NA | NA | NA | 55.2 | NA | 46.6 |
1976 | 47.3 | 44.3 | 46.2 | 42.1 | 39.3 | 27.6 | 45.9 | 43.2 | NA | 29.9 | NA | NA | NA | 55.9 | NA | 46.7 |
1977 | 48.4 | 44.8 | 47.1 | 42.9 | 39.3 | 28.9 | 46.9 | 41.7 | NA | 30.6 | NA | NA | 27.0 | 56.7 | NA | 46.9 |
1978 | 50.0 | 44.5 | 48.5 | 43.2 | 39.6 | 28.8 | 47.5 | 43.3 | NA | 31.1 | NA | NA | 26.9 | 57.5 | NA | 47.4 |
1979 | 50.9 | 44.3 | 49.8 | 43.7 | 39.9 | 29.5 | 47.6 | 43.3 | NA | 32.1 | NA | NA | 26.9 | 58.5 | NA | 48.0 |
1980 | 51.5 | 45.5 | 51.0 | 44.0 | 40.3 | 30.1 | 47.2 | 42.8 | NA | 34.3 | NA | NA | 26.7 | 59.3 | NA | 48.6 |
1981 | 52.1 | 45.5 | 52.3 | 44.3 | 40.7 | 30.4 | 47.3 | 42.3 | NA | 36.7 | NA | NA | 26.3 | 60.1 | NA | 48.6 |
1982 | 52.6 | 45.4 | 52.3 | 46.6 | 40.7 | 30.3 | 47.6 | 43.4 | NA | 37.9 | NA | NA | 26.8 | 60.5 | NA | 48.1 |
1983 | 52.9 | 45.5 | 53.1 | 46.6 | 40.5 | 30.5 | 48.5 | 42.8 | NA | 37.1 | NA | NA | 27.5 | 60.8 | NA | 48.4 |
1984 | 53.6 | 46.1 | 53.9 | 47.0 | 40.7 | 30.5 | 48.0 | 40.7 | NA | 38.0 | NA | NA | 27.5 | 61.1 | NA | 50.2 |
1985 | 54.5 | 47.1 | 55.0 | 47.1 | 41.2 | 30.7 | 47.8 | 41.9 | NA | 37.9 | NA | NA | 27.7 | 61.5 | NA | 50.8 |
1986 | 55.3 | 49.3 | 55.7 | 47.7 | 41.4 | 31.9 | 47.8 | 43.1 | NA | 40.2 | 54.7 | NA | 28.1 | 61.7 | NA | 51.4 |
1987 | 56.0 | 50.0 | 56.5 | 47.6 | 41.7 | 32.2 | 47.8 | 45.0 | NA | 41.0 | 55.0 | NA | 31.0 | 61.9 | NA | 52.1 |
1988 | 56.6 | 50.8 | 57.4 | 47.4 | 42.3 | 32.3 | 48.0 | 45.0 | NA | 42.4 | 54.2 | NA | 32.5 | 62.4 | NA | 52.9 |
1989 | 57.4 | 52.2 | 58.1 | 47.6 | 42.7 | 32.6 | 48.7 | 46.6 | NA | 42.6 | 53.0 | NA | 32.7 | 62.7 | NA | 53.6 |
1990 | 57.5 | 53.2 | 58.5 | 47.6 | 43.1 | 32.8 | 49.3 | 47.0 | NA | 44.2 | 53.9 | NA | 33.4 | 63.0 | NA | 54.0 |
1991 | 57.4 | 53.0 | 58.4 | 47.5 | 47.7 | 33.2 | 49.8 | 47.1 | NA | 45.3 | 54.2 | NA | 33.9 | 62.4 | NA | 53.6 |
1992 | 57.8 | 53.1 | 57.8 | 47.9 | 47.4 | 33.3 | 50.0 | 47.1 | NA | 46.0 | 54.0 | NA | 34.7 | 61.3 | NA | 53.1 |
1993 | 57.9 | 52.9 | 57.6 | 48.4 | 47.2 | 35.7 | 49.7 | 47.1 | NA | 46.3 | 53.9 | NA | 35.4 | 60.1 | NA | 53.3 |
1994 | 58.8 | 53.6 | 57.4 | 48.6 | 47.1 | 35.5 | 49.5 | 47.8 | NA | 47.1 | 55.1 | NA | 36.5 | 59.2 | NA | 53.3 |
1995 | 58.9 | 54.7 | 57.3 | 48.9 | 47.1 | 35.7 | 49.3 | 48.4 | NA | 48.7 | 55.9 | NA | 37.1 | 59.5 | NA | 53.5 |
1996 | 59.3 | 55.0 | 57.3 | 49.2 | 47.4 | 36.1 | 49.4 | 48.9 | NA | 49.5 | 57.2 | NA | 37.7 | 59.4 | NA | 53.8 |
1997 | 59.8 | 54.8 | 57.8 | 48.8 | 47.8 | 36.3 | 49.7 | 49.8 | NA | 50.9 | 57.1 | NA | 38.4 | 58.6 | NA | 54.2 |
1998 | 59.8 | 55.1 | 58.5 | 49.1 | 48.2 | 36.9 | 49.4 | 47.1 | NA | 51.6 | 57.0 | NA | 38.8 | 58.0 | NA | 54.4 |
1999 | 60.0 | 55.0 | 59.1 | 49.3 | 48.3 | 37.4 | 48.8 | 47.6 | NA | 52.9 | 57.3 | NA | 39.5 | 58.1 | NA | 54.9 |
2000 | 59.9 | 55.8 | 59.5 | 49.6 | 48.4 | 37.9 | 48.7 | 48.8 | NA | 53.8 | 57.4 | NA | 41.0 | 59.2 | NA | 55.2 |
2001 | 59.8 | 56.2 | 59.8 | 49.7 | 48.6 | 38.4 | 48.5 | 49.3 | NA | 54.9 | 58.3 | NA | 40.0 | 59.5 | NA | 55.1 |
2002 | 59.6 | 56.3 | 60.9 | 50.0 | 48.7 | 38.7 | 47.9 | 49.8 | NA | 55.9 | 59.0 | NA | 41.8 | 59.9 | NA | 55.5 |
2003 | 59.5 | 57.1 | 61.9 | 50.4 | 48.8 | 38.6 | 47.6 | 49.0 | NA | 56.1 | 59.4 | NA | 43.5 | 59.9 | NA | 55.6 |
2004 | 59.2 | 56.9 | 61.9 | 50.5 | 49.2 | 38.3 | 47.6 | 49.9 | NA | 56.5 | 59.9 | NA | 44.8 | 59.7 | NA | 55.8 |
2005 | 59.3 | 58.0 | 61.6 | 50.6 | 50.3 | 37.9 | 47.6 | 50.1 | 39.0 | 57.1 | 61.0 | NA | 46.1 | 60.5 | NA | 56.1 |
2006 | 59.4 | 58.6 | 61.8 | 50.7 | 51.2 | 38.1 | 47.9 | 50.3 | 40.3 | 57.6 | 61.4 | NA | 47.7 | 60.8 | 22.0 | 56.6 |
2007 | 59.3 | 59.3 | 62.5 | 51.0 | 51.6 | 37.9 | 48.1 | 50.2 | 40.6 | 58.7 | 61.8 | NA | 48.7 | 61.3 | 22.1 | 56.4 |
2008 | 59.5 | 60.0 | 62.6 | 51.2 | 51.8 | 38.6 | 48.0 | 50.0 | 40.6 | 59.1 | 62.1 | 50.8 | 50.3 | 61.2 | 22.8 | 56.7 |
2009 | 59.2 | 60.1 | 62.5 | 51.6 | 52.1 | 38.2 | 48.2 | 49.2 | 41.1 | 59.4 | 62.2 | 49.0 | 51.4 | 60.7 | 24.1 | 56.8 |
2010 | 58.6 | 59.8 | 62.4 | 51.6 | 52.4 | 38.2 | 48.2 | 49.4 | 41.0 | 58.0 | 62.1 | 47.4 | 52.1 | 60.6 | 25.6 | 56.8 |
2011 | 58.1 | 60.0 | 62.2 | 51.5 | 53.2 | 38.4 | 47.7 | 49.7 | 41.2 | 58.0 | 62.5 | 47.9 | 52.8 | 61.1 | 27.0 | 56.9 |
Note: Men's (women's) participation rates are as a percentage of the total male (female) working age population. Data for Mexico refer to 2005–2011, data for South Africa refer to 2008–2011, and data for Turkey refer to 2006–2011. | ||||||||||||||||
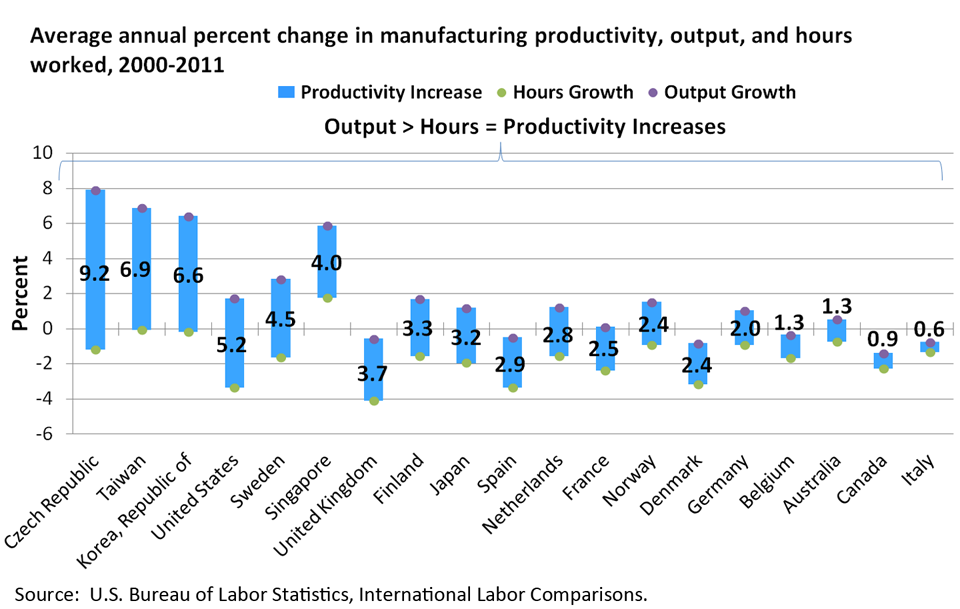
| Country | Productivity | Output Growth | Hours Growth |
|---|---|---|---|
Czech Republic | 9.2 | 7.9 | -1.2 |
Taiwan | 6.9 | 6.9 | -0.1 |
Korea, Republic of | 6.6 | 6.4 | -0.2 |
United States | 5.2 | 1.7 | -3.4 |
Sweden | 4.5 | 2.8 | -1.6 |
Singapore | 4.0 | 5.8 | 1.8 |
United Kingdom | 3.7 | -0.6 | -4.1 |
Finland | 3.3 | 1.7 | -1.6 |
Japan | 3.2 | 1.2 | -2.0 |
Spain | 2.9 | -0.5 | -3.4 |
Netherlands | 2.8 | 1.2 | -1.5 |
France | 2.5 | 0.1 | -2.4 |
Norway | 2.4 | 1.5 | -0.9 |
Denmark | 2.4 | -0.8 | -3.2 |
Germany | 2.0 | 1.0 | -0.9 |
Belgium | 1.3 | -0.4 | -1.7 |
Australia | 1.3 | 0.5 | -0.8 |
Canada | 0.9 | -1.4 | -2.3 |
Italy | 0.6 | -0.8 | -1.3 |
Source: U.S. Bureau of Labor Statistics, International Labor Comparisons. | |||
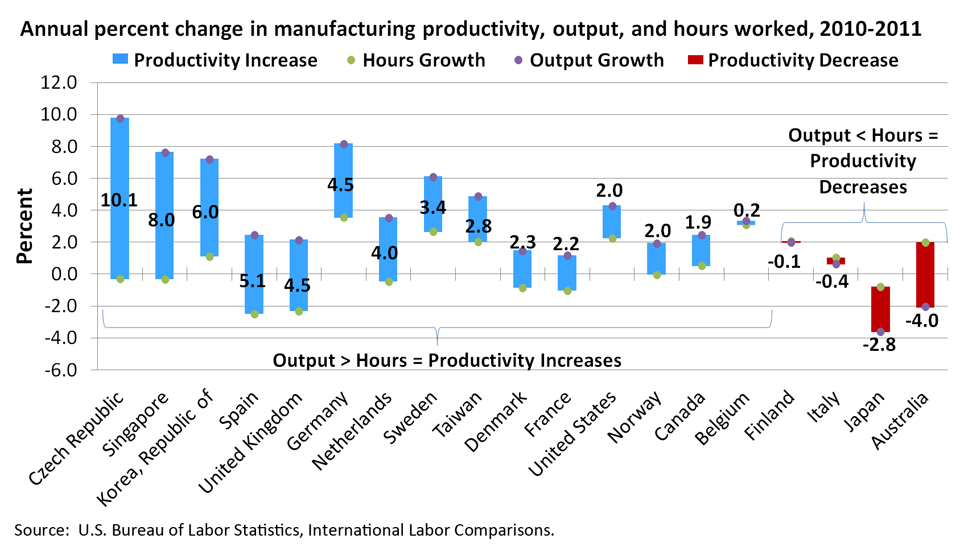
| Country | Productivity | Output Growth | Hours Growth |
|---|---|---|---|
Czech Republic | 10.1 | 9.8 | -0.3 |
Singapore | 8.0 | 7.6 | -0.3 |
Korea, Republic of | 6.0 | 7.2 | 1.1 |
Spain | 5.1 | 2.4 | -2.5 |
United Kingdom | 4.5 | 2.1 | -2.3 |
Germany | 4.5 | 8.1 | 3.5 |
Netherlands | 4.0 | 3.5 | -0.5 |
Sweden | 3.4 | 6.1 | 2.6 |
Taiwan | 2.8 | 4.9 | 2.0 |
Denmark | 2.3 | 1.5 | -0.9 |
France | 2.2 | 1.2 | -1.0 |
United States | 2.0 | 4.3 | 2.2 |
Norway | 2.0 | 1.9 | 0.0 |
Canada | 1.9 | 2.4 | 0.5 |
Belgium | 0.2 | 3.3 | 3.1 |
Finland | -0.1 | 2.0 | 2.1 |
Italy | -0.4 | 0.6 | 1.0 |
Japan | -2.8 | -3.6 | -0.8 |
Australia | -4.0 | -2.1 | 2.0 |
Source: U.S. Bureau of Labor Statistics, International Labor Comparisons. | |||