An official website of the United States government
An official website of the United States government
The .gov means it's official.
Federal government websites often end in .gov or .mil. Before sharing sensitive information,
make sure you're on a federal government site.
The site is secure.
The
https:// ensures that you are connecting to the official website and that any
information you provide is encrypted and transmitted securely.

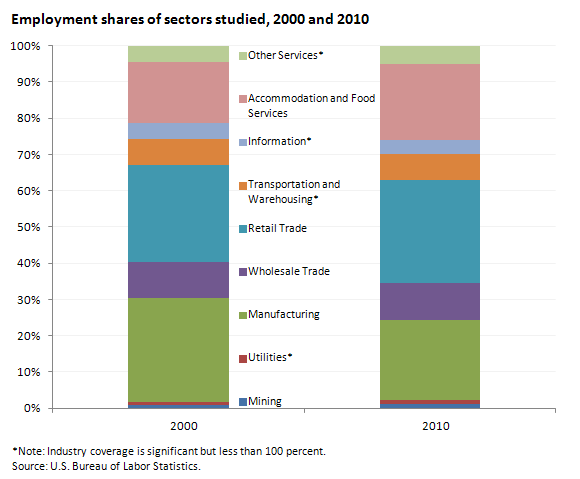
| Industry | 2000 | 2010 |
|---|---|---|
Mining | 0.9 | 1.3 |
Utilities(1) | 0.9 | 0.9 |
Manufacturing | 28.6 | 22.0 |
Wholesale trade | 10.0 | 10.4 |
Retail trade | 26.7 | 28.4 |
Transportation and warehousing(1) | 7.1 | 7.2 |
Information(1) | 4.4 | 3.7 |
Accommodation and food services | 16.9 | 21.1 |
Other services(1) | 4.5 | 5.0 |
Footnotes: | ||
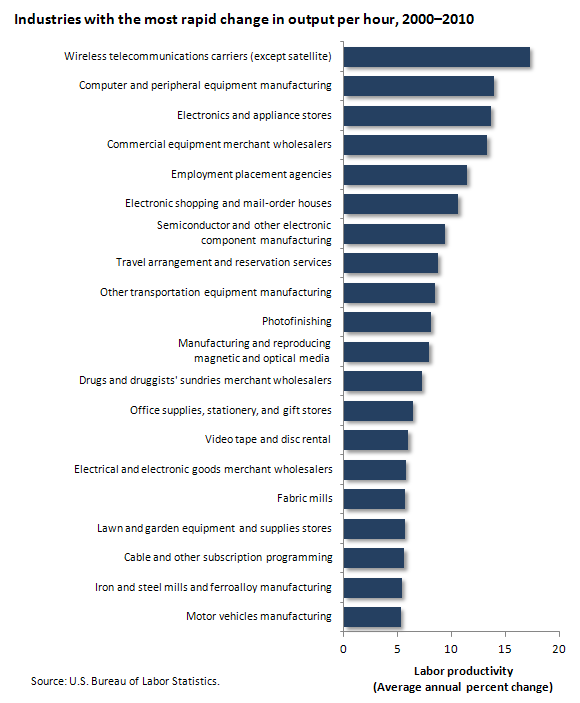
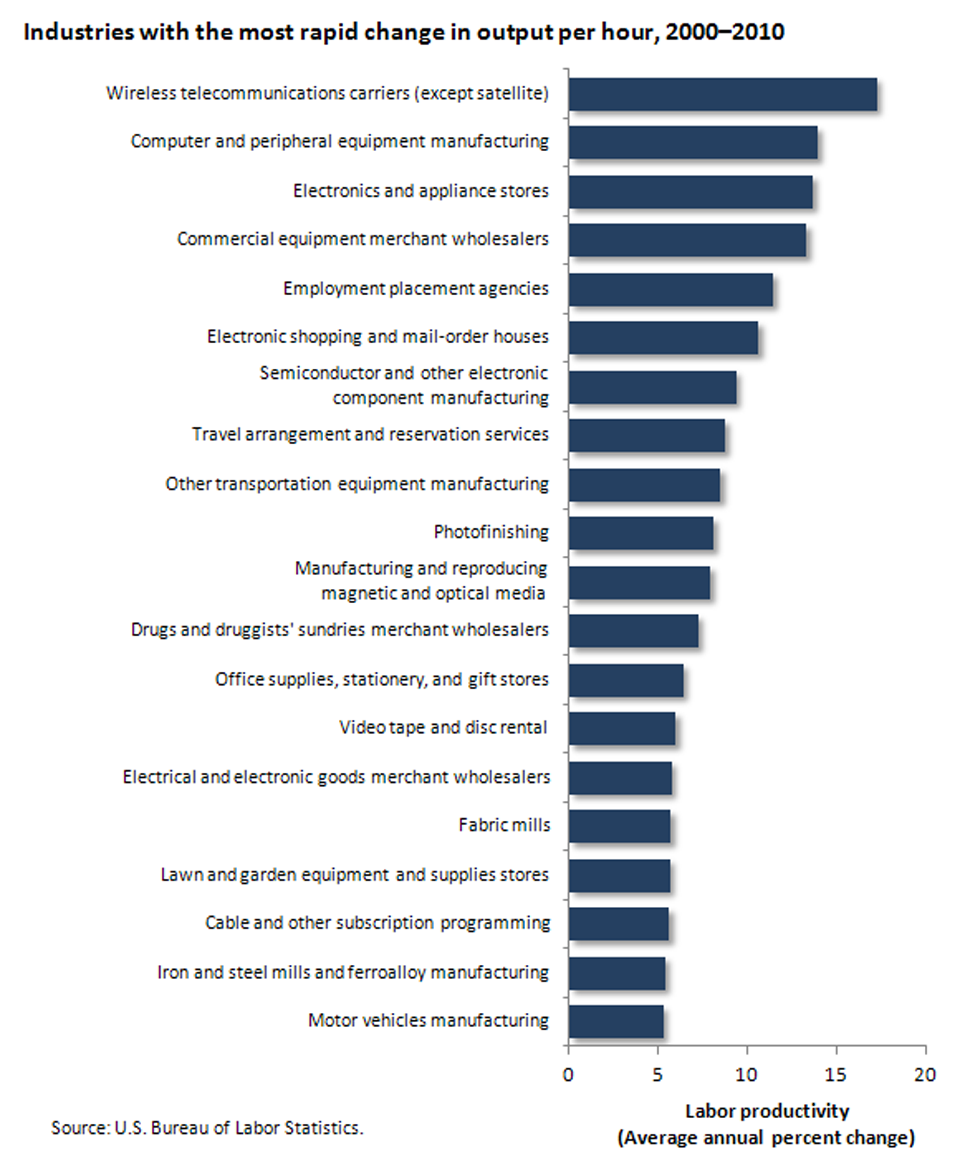
| Industry | Percent |
|---|---|
Wireless telecommunications carriers (except satellite) | 17.3 |
Computer and peripheral equipment manufacturing | 14.0 |
Electronics and appliance stores | 13.7 |
Commercial equipment merchant wholesalers | 13.3 |
Employment placement agencies | 11.4 |
Electronic shopping and mail-order houses | 10.6 |
Semiconductor and other electronic component manufacturing | 9.4 |
Travel arrangement and reservation services | 8.7 |
Other transportation equipment manufacturing | 8.5 |
Photofinishing | 8.1 |
Manufacturing and reproducing magnetic and optical media | 7.9 |
Drugs and druggists' sundries merchant wholesalers | 7.2 |
Office supplies, stationery, and gift stores | 6.4 |
Video tape and disc rental | 6.0 |
Electrical and electronic goods merchant wholesalers | 5.7 |
Fabric mills | 5.7 |
Lawn and garden equipment and supplies stores | 5.6 |
Cable and other subscription programming | 5.6 |
Iron and steel mills and ferroalloy manufacturing | 5.4 |
Motor vehicles manufacturing | 5.3 |
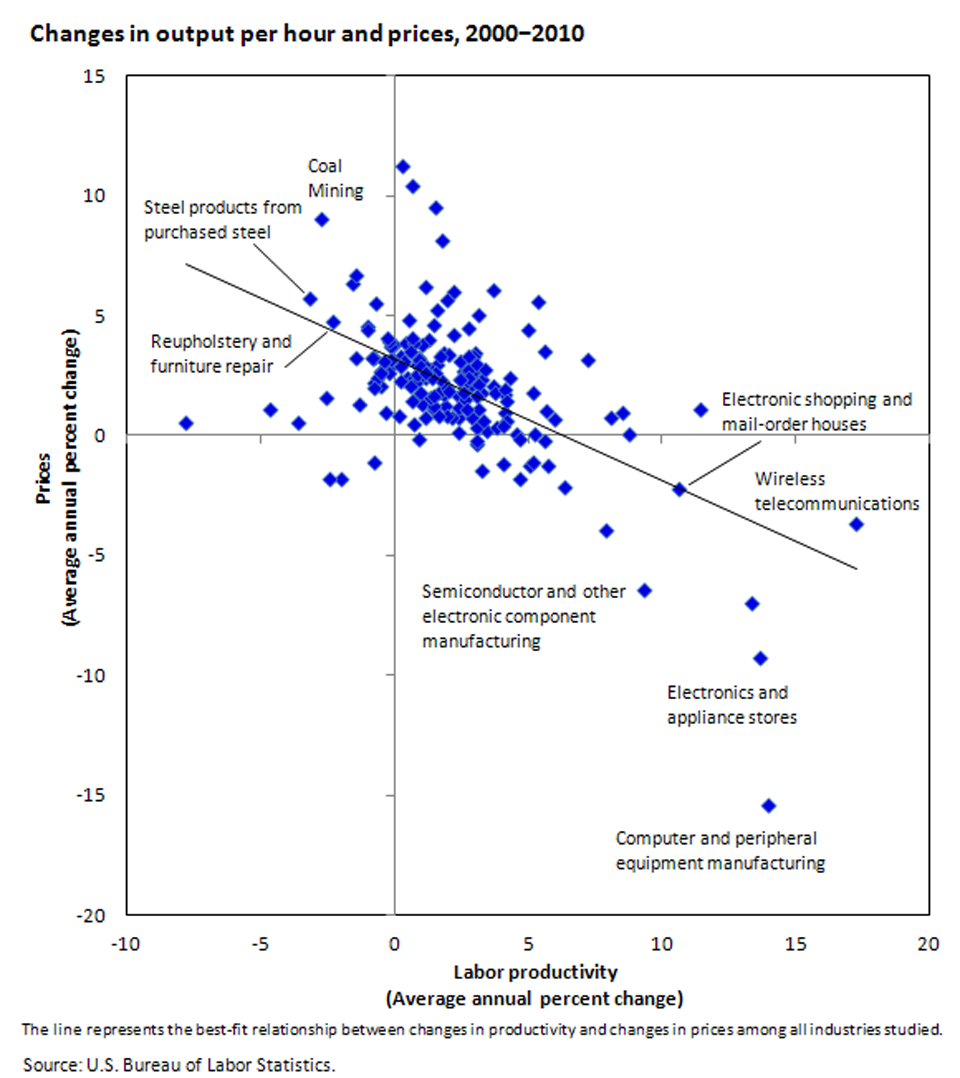
| NAICS code | Industry | Average annual percent change | |
|---|---|---|---|
| Productivity | Prices | ||
| 2000–2010 | 2000–2010 | ||
2111 | Oil and gas extraction | -1.6 | 6.3 |
2121 | Coal mining | -2.7 | 9.0 |
2122 | Metal ore mining | 0.3 | 11.2 |
2123 | Nonmetallic mineral mining and quarrying | 0.6 | 4.9 |
2131 | Support activities for mining | 2.2 | 6.0 |
2211 | Power generation and supply | 0.2 | 3.3 |
2212 | Natural gas distribution | 0.8 | 3.0 |
3111 | Animal food manufacturing | 3.2 | 5.0 |
3112 | Grain and oilseed milling | 1.6 | 5.2 |
3113 | Sugar and confectionery products | -0.0 | 3.8 |
3114 | Fruit and vegetable preserving and specialty food | 0.5 | 2.4 |
3115 | Dairy products | 2.6 | 2.7 |
3116 | Animal slaughtering and processing | 1.6 | 3.0 |
3117 | Seafood product preparation and packaging | 1.2 | 2.4 |
3118 | Bakeries and tortilla manufacturing | -0.1 | 3.2 |
3119 | Other food products | -0.2 | 2.9 |
3121 | Beverages | 3.1 | 2.3 |
3122 | Tobacco and tobacco products | 0.4 | 3.8 |
3131 | Fiber, yarn, and thread mills | 3.3 | 1.8 |
3132 | Fabric mills | 5.7 | 1.0 |
3133 | Textile and fabric finishing and fabric coating mills | 1.9 | 1.2 |
3141 | Textile furnishings mills | -0.5 | 2.1 |
3149 | Other textile product mills | 0.9 | 1.6 |
3151 | Apparel knitting mills | -3.6 | 0.5 |
3152 | Cut and sew apparel | -7.8 | 0.5 |
3159 | Apparel accessories and other apparel manufacturing | -4.6 | 1.1 |
3161 | Leather and hide tanning and finishing | 3.7 | 2.0 |
3162 | Footwear manufacturing | 1.5 | 1.1 |
3169 | Other leather and allied product manufacturing | -1.3 | 1.3 |
3211 | Sawmills and wood preservation | 3.1 | -0.4 |
3212 | Veneer, plywood, and engineered wood product manufacturing | 2.4 | 0.8 |
3219 | Other wood products | 2.4 | 1.7 |
3221 | Pulp, paper, and paperboard mills | 3.2 | 2.4 |
3222 | Converted paper products | 1.8 | 2.2 |
3231 | Printing and related support activities | 2.2 | 0.8 |
3241 | Petroleum and coal products | 1.5 | 9.5 |
3251 | Basic chemicals | 3.7 | 6.0 |
3252 | Resin, synthetic rubber, and artificial synthetic fibers and filaments | 2.2 | 4.2 |
3253 | Pesticides, fertilizers, and other agricultural chemicals | 5.0 | 4.4 |
3254 | Pharmaceutical and medicine manufacturing | -1.0 | 4.5 |
3255 | Paint, coatings, and adhesives | 1.3 | 4.0 |
3256 | Soaps, cleaning compounds, and toilet preparations | 4.2 | 1.7 |
3259 | Other chemical products and preparations | 1.2 | 2.6 |
3261 | Plastics products | 1.4 | 2.8 |
3262 | Rubber products | 2.4 | 3.1 |
3271 | Clay products and refractories | -0.2 | 2.6 |
3272 | Glass and glass product manufacturing | 2.4 | 1.2 |
3273 | Cement and concrete products | -0.8 | 3.2 |
3274 | Lime and gypsum products | 1.1 | 1.3 |
3279 | Other nonmetallic mineral products | 2.8 | 2.1 |
3311 | Iron and steel mills and ferroalloy manufacturing | 5.4 | 5.6 |
3312 | Steel products from purchased steel | -3.1 | 5.7 |
3313 | Alumina and aluminum production and processing | 5.2 | 1.8 |
3314 | Nonferrous metal (except aluminum) production and processing | 1.8 | 8.1 |
3315 | Foundries | 3.0 | 3.5 |
3321 | Forging and stamping | 2.7 | 2.7 |
3322 | Cutlery and handtool manufacturing | 2.9 | 2.1 |
3323 | Architectural and structural metals | 0.3 | 3.1 |
3324 | Boilers, tanks, and shipping containers | 1.1 | 3.8 |
3325 | Hardware manufacturing | -0.5 | 2.7 |
3326 | Spring and wire product manufacturing | 2.9 | 3.3 |
3327 | Machine shops; turned products; and screws, nuts, and bolts | 0.8 | 2.4 |
3328 | Coating, engraving, heat treating, and allied activities | 2.9 | 2.5 |
3329 | Other fabricated metal products | 1.8 | 3.4 |
3331 | Agriculture, construction, and mining machinery | 3.1 | 2.8 |
3332 | Industrial machinery | 0.2 | 0.8 |
3333 | Commercial and service industry machinery manufacturing | 1.9 | 1.8 |
3334 | Ventilation, heating, air-conditioning, and commercial refrigeration equipment manufacturing | 2.7 | 2.3 |
3335 | Metalworking machinery manufacturing | 2.0 | 0.8 |
3336 | Engine, turbine, and power transmission equipment manufacturing | 0.2 | 2.3 |
3339 | Other general purpose machinery | 2.8 | 2.8 |
3341 | Computer and peripheral equipment manufacturing | 14.0 | -15.4 |
3342 | Communications equipment | -2.0 | -1.8 |
3343 | Audio and video equipment manufacturing | -2.4 | -1.8 |
3344 | Semiconductor and other electronic component manufacturing | 9.4 | -6.4 |
3345 | Navigational, measuring, electromedical, and control instruments manufacturing | 4.1 | 1.0 |
3346 | Manufacturing and reproducing magnetic and optical media | 7.9 | -3.9 |
3351 | Electric lighting equipment | 3.2 | 1.1 |
3352 | Household appliances | 2.9 | 0.8 |
3353 | Electrical equipment manufacturing | 0.9 | 3.3 |
3359 | Other electrical equipment and components | 0.7 | 3.9 |
3361 | Motor vehicles | 5.3 | 0.1 |
3362 | Motor vehicle body and trailer manufacturing | 0.9 | 2.4 |
3363 | Motor vehicle parts | 4.2 | 0.6 |
3364 | Aerospace product and parts manufacturing | 2.8 | 2.4 |
3365 | Railroad rolling stock manufacturing | 4.3 | 2.4 |
3366 | Ship and boat building | 3.1 | 2.9 |
3369 | Other transportation equipment manufacturing | 8.5 | 0.9 |
3371 | Household and institutional furniture and kitchen cabinets | 1.7 | 1.8 |
3372 | Office furniture (including fixtures) manufacturing | 0.8 | 2.2 |
3379 | Other furniture related products | 3.1 | 2.1 |
3391 | Medical equipment and supplies manufacturing | 3.8 | 1.8 |
3399 | Other miscellaneous manufacturing | 2.6 | 1.5 |
4231 | Motor vehicles and parts | 3.4 | 0.2 |
4232 | Furniture and furnishings | 0.6 | 2.1 |
4233 | Lumber and construction supplies | 3.1 | 1.7 |
4234 | Commercial equipment | 13.3 | -7.0 |
4235 | Metals and minerals | -1.4 | 6.7 |
4236 | Electrical and electronic goods | 5.7 | -1.2 |
4237 | Hardware and plumbing | 1.0 | 2.7 |
4238 | Machinery and supplies | 0.8 | 2.5 |
4239 | Miscellaneous durable goods | -0.1 | 3.7 |
4241 | Paper and paper products | 2.5 | 2.4 |
4242 | Drugs and druggists' sundries merchant wholesalers | 7.2 | 3.2 |
4243 | Apparel and piece goods | 3.8 | 0.3 |
4244 | Grocery and related products | 1.1 | 3.0 |
4245 | Farm product raw materials | 1.2 | 6.2 |
4246 | Chemicals | 1.5 | 4.6 |
4247 | Petroleum | 0.7 | 10.5 |
4248 | Alcoholic beverages | -0.7 | 2.2 |
4249 | Miscellaneous nondurable goods | -0.2 | 3.9 |
4251 | Wholesale electronic markets and agents and brokers | -2.5 | 1.6 |
4411 | Automobile dealers | 0.9 | -0.1 |
4412 | Other motor vehicle dealers | 0.7 | 0.5 |
4413 | Automotive parts, accessories, and tire stores | -0.8 | 3.3 |
4421 | Furniture stores | 3.3 | -1.4 |
4422 | Home furnishings stores | 5.1 | -1.3 |
4431 | Electronics and appliance stores | 13.7 | -9.3 |
4441 | Building material and supplies dealers | 1.2 | 0.7 |
4442 | Lawn and garden equipment and supplies stores | 5.6 | -0.2 |
4451 | Grocery stores | 1.5 | 2.6 |
4452 | Specialty food stores | 3.4 | 2.7 |
4453 | Beer, wine, and liquor stores | 4.1 | 1.9 |
4461 | Health and personal care stores | 2.5 | 2.3 |
4471 | Gasoline stations | 2.0 | 5.7 |
4481 | Clothing stores | 5.2 | -1.1 |
4482 | Shoe stores | 2.4 | 0.1 |
4483 | Jewelry, luggage, and leather goods stores | 1.6 | 0.8 |
4511 | Sporting goods, hobby, and musical instrument stores | 4.7 | -1.8 |
4512 | Book, periodical, and music stores | 2.7 | 1.1 |
4521 | Department stores | -0.7 | -1.1 |
4529 | Other general merchandise stores | 4.1 | 0.4 |
4531 | Florists | 3.1 | 0.4 |
4532 | Office supplies, stationery, and gift stores | 6.4 | -2.2 |
4533 | Used merchandise stores | 4.1 | -1.2 |
4539 | Other miscellaneous store retailers | -1.5 | 3.2 |
4541 | Electronic shopping and mail-order houses | 10.6 | -2.2 |
4542 | Vending machine operators | -0.6 | 2.4 |
4543 | Direct selling establishments | 0.9 | 3.2 |
481 | Air transportation | 4.6 | 0.0 |
482111 | Line-haul railroads | 2.8 | 4.5 |
4841 | General freight trucking | 1.3 | 2.5 |
48421 | Used household and office goods moving | -0.5 | 2.6 |
4911 | Postal service | 0.7 | 4.1 |
492 | Couriers and messengers | -0.7 | 5.5 |
4931 | Warehousing and storage | 1.5 | 1.3 |
5111 | Newspaper, periodical, book, and directory publishers | -0.2 | 3.2 |
5112 | Software publishers | 4.7 | -0.2 |
51213 | Motion picture and video exhibition | 1.7 | 3.3 |
5151 | Radio and television broadcasting | 3.1 | -0.2 |
5152 | Cable and other subscription programming | 5.6 | 3.5 |
5171 | Wired telecommunications carriers | 3.3 | 0.6 |
5172 | Wireless telecommunications carriers (except satellite) | 17.3 | -3.6 |
52211 | Commercial banking | 2.6 | 1.8 |
532111 | Passenger car rental | 2.8 | 3.3 |
53212 | Truck, utility trailer, and rv (recreational vehicle) rental and leasing | -0.8 | 2.0 |
53223 | Video tape and disc rental | 6.0 | 0.7 |
541213 | Tax preparation services | -1.0 | 4.4 |
54131 | Architectural services | 0.7 | 1.5 |
54133 | Engineering services | 1.2 | 2.7 |
54181 | Advertising agencies | 4.2 | 1.5 |
541921 | Photography studios, portrait | -0.3 | 1.0 |
561311 | Employment placement agencies | 11.4 | 1.1 |
56172 | Janitorial services | 1.5 | 1.6 |
6215 | Medical and diagnostic laboratories | 1.3 | 1.6 |
71311 | Amusement and theme parks | -0.4 | 3.1 |
71395 | Bowling centers | 2.1 | 1.8 |
7211 | Traveler accommodation | 1.0 | 1.8 |
7221 | Full-service restaurants | 0.3 | 2.9 |
7222 | Limited-service eating places | 1.0 | 2.9 |
7223 | Special food services | 0.6 | 3.5 |
7224 | Drinking places (alcoholic beverages) | 2.1 | 3.4 |
8111 | Automotive repair and maintenance | -0.8 | 3.2 |
81142 | Reupholstery and furniture repair | -2.3 | 4.8 |
8121 | Personal care services | 1.4 | 2.4 |
81221 | Funeral homes and funeral services | -0.2 | 4.1 |
8123 | Drycleaning and laundry services | 2.0 | 2.0 |
81292 | Photofinishing | 8.1 | 0.8 |
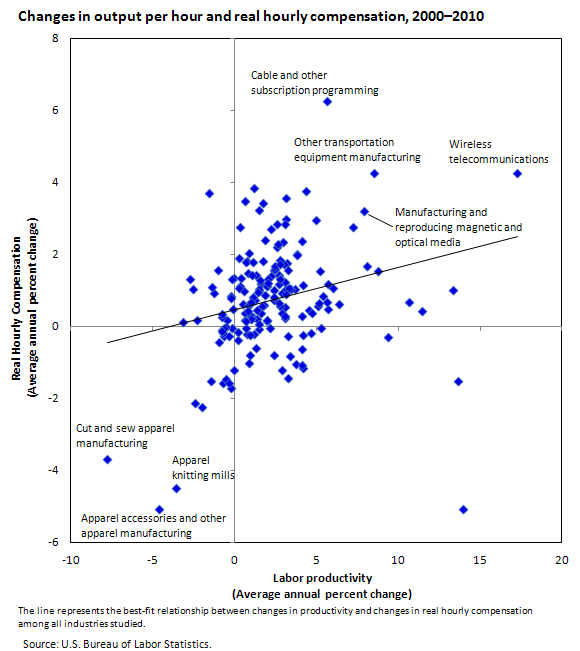
| NAICS code | Industry | Average annual percent change | |
|---|---|---|---|
| Productivity | Real hourly compensation | ||
2111 | Oil and gas extraction | -1.6 | 3.7 |
2121 | Coal mining | -2.7 | 1.3 |
2122 | Metal ore mining | 0.3 | 2.8 |
2123 | Nonmetallic mineral mining and quarrying | 0.6 | 1.0 |
2131 | Support activities for mining | 2.2 | 2.7 |
2211 | Power generation and supply | 0.2 | 1.9 |
2212 | Natural gas distribution | 0.8 | 1.5 |
3111 | Animal food manufacturing | 3.2 | 1.8 |
3112 | Grain and oilseed milling | 1.6 | 1.2 |
3113 | Sugar and confectionery products | -0.0 | 1.3 |
3114 | Fruit and vegetable preserving and specialty food | 0.5 | 0.6 |
3115 | Dairy products | 2.6 | 2.2 |
3116 | Animal slaughtering and processing | 1.6 | 1.2 |
3117 | Seafood product preparation and packaging | 1.2 | 0.3 |
3118 | Bakeries and tortilla manufacturing | -0.1 | -1.2 |
3119 | Other food products | -0.2 | -0.0 |
3121 | Beverages | 3.1 | 0.5 |
3122 | Tobacco and tobacco products | 0.4 | 1.3 |
3131 | Fiber, yarn, and thread mills | 3.3 | -0.3 |
3132 | Fabric mills | 5.7 | 1.2 |
3133 | Textile and fabric finishing and fabric coating mills | 1.9 | 1.1 |
3141 | Textile furnishings mills | -0.5 | 0.2 |
3149 | Other textile product mills | 0.9 | -1.0 |
3151 | Apparel knitting mills | -3.6 | -4.5 |
3152 | Cut and sew apparel | -7.8 | -3.7 |
3159 | Apparel accessories and other apparel manufacturing | -4.6 | -5.1 |
3161 | Leather and hide tanning and finishing | 3.7 | -1.1 |
3162 | Footwear manufacturing | 1.5 | 1.0 |
3169 | Other leather and allied product manufacturing | -1.3 | 0.9 |
3211 | Sawmills and wood preservation | 3.1 | 1.2 |
3212 | Veneer, plywood, and engineered wood product manufacturing | 2.4 | 1.0 |
3219 | Other wood products | 2.4 | 1.5 |
3221 | Pulp, paper, and paperboard mills | 3.2 | 1.5 |
3222 | Converted paper products | 1.8 | 0.6 |
3231 | Printing and related support activities | 2.2 | -0.0 |
3241 | Petroleum and coal products | 1.5 | 3.2 |
3251 | Basic chemicals | 3.7 | 1.0 |
3252 | Resin, synthetic rubber, and artificial synthetic fibers and filaments | 2.2 | 1.4 |
3253 | Pesticides, fertilizers, and other agricultural chemicals | 5.0 | 2.9 |
3254 | Pharmaceutical and medicine manufacturing | -1.0 | 1.6 |
3255 | Paint, coatings, and adhesives | 1.3 | 1.4 |
3256 | Soaps, cleaning compounds, and toilet preparations | 4.2 | 1.1 |
3259 | Other chemical products and preparations | 1.2 | 0.7 |
3261 | Plastics products | 1.4 | 0.2 |
3262 | Rubber products | 2.4 | 0.7 |
3271 | Clay products and refractories | -0.2 | -1.7 |
3272 | Glass and glass product manufacturing | 2.4 | 0.8 |
3273 | Cement and concrete products | -0.8 | -0.1 |
3274 | Lime and gypsum products | 1.1 | 0.2 |
3279 | Other nonmetallic mineral products | 2.8 | 0.5 |
3311 | Iron and steel mills and ferroalloy manufacturing | 5.4 | 0.8 |
3312 | Steel products from purchased steel | -3.1 | 0.1 |
3313 | Alumina and aluminum production and processing | 5.2 | 1.5 |
3314 | Nonferrous metal (except aluminum) production and processing | 1.8 | 3.4 |
3315 | Foundries | 3.0 | 1.7 |
3321 | Forging and stamping | 2.7 | 1.2 |
3322 | Cutlery and handtool manufacturing | 2.9 | 0.4 |
3323 | Architectural and structural metals | 0.3 | 1.1 |
3324 | Boilers, tanks, and shipping containers | 1.1 | 1.4 |
3325 | Hardware manufacturing | -0.5 | -0.0 |
3326 | Spring and wire product manufacturing | 2.9 | 2.3 |
3327 | Machine shops; turned products; and screws, nuts, and bolts | 0.8 | -0.2 |
3328 | Coating, engraving, heat treating, and allied activities | 2.9 | 0.9 |
3329 | Other fabricated metal products | 1.8 | 0.9 |
3331 | Agriculture, construction, and mining machinery | 3.1 | 0.2 |
3332 | Industrial machinery | 0.2 | -0.2 |
3333 | Commercial and service industry machinery manufacturing | 1.9 | 2.4 |
3334 | Ventilation, heating, air-conditioning, and commercial refrigeration equipment manufacturing | 2.7 | 1.4 |
3335 | Metalworking machinery manufacturing | 2.0 | 0.1 |
3336 | Engine, turbine, and power transmission equipment manufacturing | 0.2 | -0.4 |
3339 | Other general purpose machinery | 2.8 | 1.8 |
3341 | Computer and peripheral equipment manufacturing | 14.0 | -5.1 |
3342 | Communications equipment | -2.0 | -2.2 |
3343 | Audio and video equipment manufacturing | -2.4 | -2.1 |
3344 | Semiconductor and other electronic component manufacturing | 9.4 | -0.3 |
3345 | Navigational, measuring, electromedical, and control instruments manufacturing | 4.1 | 2.4 |
3346 | Manufacturing and reproducing magnetic and optical media | 7.9 | 3.2 |
3351 | Electric lighting equipment | 3.2 | 3.0 |
3352 | Household appliances | 2.9 | -1.2 |
3353 | Electrical equipment manufacturing | 0.9 | 0.3 |
3359 | Other electrical equipment and components | 0.7 | 1.8 |
3361 | Motor vehicles | 5.3 | -0.1 |
3362 | Motor vehicle body and trailer manufacturing | 0.9 | 2.0 |
3363 | Motor vehicle parts | 4.2 | -1.2 |
3364 | Aerospace product and parts manufacturing | 2.8 | 1.3 |
3365 | Railroad rolling stock manufacturing | 4.3 | 3.8 |
3366 | Ship and boat building | 3.1 | 3.6 |
3369 | Other transportation equipment manufacturing | 8.5 | 4.2 |
3371 | Household and institutional furniture and kitchen cabinets | 1.7 | 0.5 |
3372 | Office furniture (including fixtures) manufacturing | 0.8 | 0.6 |
3379 | Other furniture related products | 3.1 | 1.0 |
3391 | Medical equipment and supplies manufacturing | 3.8 | 2.0 |
3399 | Other miscellaneous manufacturing | 2.6 | 2.3 |
4231 | Motor vehicles and parts | 3.4 | 1.0 |
4232 | Furniture and furnishings | 0.6 | 0.4 |
4233 | Lumber and construction supplies | 3.1 | 0.9 |
4234 | Commercial equipment | 13.3 | 1.0 |
4235 | Metals and minerals | -1.4 | 1.1 |
4236 | Electrical and electronic goods | 5.7 | 0.5 |
4237 | Hardware and plumbing | 1.0 | 0.6 |
4238 | Machinery and supplies | 0.8 | 0.4 |
4239 | Miscellaneous durable goods | -0.1 | 0.5 |
4241 | Paper and paper products | 2.5 | 1.6 |
4242 | Drugs and druggists' sundries merchant wholesalers | 7.2 | 2.7 |
4243 | Apparel and piece goods | 3.8 | 2.0 |
4244 | Grocery and related products | 1.1 | 0.8 |
4245 | Farm product raw materials | 1.2 | 3.8 |
4246 | Chemicals | 1.5 | 1.0 |
4247 | Petroleum | 0.7 | 1.8 |
4248 | Alcoholic beverages | -0.7 | -0.2 |
4249 | Miscellaneous nondurable goods | -0.2 | 0.8 |
4251 | Wholesale electronic markets and agents and brokers | -2.5 | 1.0 |
4411 | Automobile dealers | 0.9 | -0.8 |
4412 | Other motor vehicle dealers | 0.7 | -0.0 |
4413 | Automotive parts, accessories, and tire stores | -0.8 | 0.2 |
4421 | Furniture stores | 3.3 | -1.4 |
4422 | Home furnishings stores | 5.1 | 0.6 |
4431 | Electronics and appliance stores | 13.7 | -1.5 |
4441 | Building material and supplies dealers | 1.2 | -0.2 |
4442 | Lawn and garden equipment and supplies stores | 5.6 | 0.7 |
4451 | Grocery stores | 1.5 | 1.3 |
4452 | Specialty food stores | 3.4 | -0.8 |
4453 | Beer, wine, and liquor stores | 4.1 | -0.6 |
4461 | Health and personal care stores | 2.5 | 1.7 |
4471 | Gasoline stations | 2.0 | 0.2 |
4481 | Clothing stores | 5.2 | 0.6 |
4482 | Shoe stores | 2.4 | -0.8 |
4483 | Jewelry, luggage, and leather goods stores | 1.6 | 0.4 |
4511 | Sporting goods, hobby, and musical instrument stores | 4.7 | 0.4 |
4512 | Book, periodical, and music stores | 2.7 | 0.6 |
4521 | Department stores | -0.7 | -1.6 |
4529 | Other general merchandise stores | 4.1 | 0.3 |
4531 | Florists | 3.1 | 2.8 |
4532 | Office supplies, stationery, and gift stores | 6.4 | 0.6 |
4533 | Used merchandise stores | 4.1 | -1.1 |
4539 | Other miscellaneous store retailers | -1.5 | -1.5 |
4541 | Electronic shopping and mail-order houses | 10.6 | 0.7 |
4542 | Vending machine operators | -0.6 | -0.1 |
4543 | Direct selling establishments | 0.9 | -0.2 |
481 | Air transportation | 4.6 | 0.4 |
482111 | Line-haul railroads | 2.8 | 1.3 |
4841 | General freight trucking | 1.3 | -0.6 |
48421 | Used household and office goods moving | -0.5 | -1.5 |
4911 | Postal service | 0.7 | 3.5 |
492 | Couriers and messengers | -0.7 | -0.3 |
4931 | Warehousing and storage | 1.5 | -0.1 |
5111 | Newspaper, periodical, book, and directory publishers | -0.2 | 1.3 |
5112 | Software publishers | 4.7 | -0.2 |
51213 | Motion picture and video exhibition | 1.7 | 1.8 |
5151 | Radio and television broadcasting | 3.1 | 0.3 |
5152 | Cable and other subscription programming | 5.6 | 6.3 |
5171 | Wired telecommunications carriers | 3.3 | 1.1 |
5172 | Wireless telecommunications carriers (except satellite) | 17.3 | 4.2 |
52211 | Commercial banking | 2.6 | 2.8 |
532111 | Passenger car rental | 2.8 | 1.7 |
53212 | Truck, utility trailer, and rv (recreational vehicle) rental and leasing | -0.8 | -0.1 |
53223 | Video tape and disc rental | 6.0 | 1.1 |
541213 | Tax preparation services | -1.0 | -0.4 |
54131 | Architectural services | 0.7 | 0.1 |
54133 | Engineering services | 1.2 | 1.8 |
54181 | Advertising agencies | 4.2 | -0.2 |
541921 | Photography studios, portrait | -0.3 | -1.6 |
561311 | Employment placement agencies | 11.4 | 0.4 |
5615 | Travel arrangement and reservation services | 8.7 | 1.5 |
56172 | Janitorial services | 1.5 | 0.1 |
6215 | Medical and diagnostic laboratories | 1.3 | 0.4 |
71311 | Amusement and theme parks | -0.4 | -0.3 |
71395 | Bowling centers | 2.1 | 1.2 |
7211 | Traveler accommodation | 1.0 | 0.2 |
7221 | Full-service restaurants | 0.3 | 1.1 |
7222 | Limited-service eating places | 1.0 | 0.7 |
7223 | Special food services | 0.6 | 0.2 |
7224 | Drinking places (alcoholic beverages) | 2.1 | 1.3 |
8111 | Automotive repair and maintenance | -0.8 | 0.3 |
81142 | Reupholstery and furniture repair | -2.3 | 0.2 |
8121 | Personal care services | 1.4 | 1.0 |
81221 | Funeral homes and funeral services | -0.2 | 0.8 |
8123 | Drycleaning and laundry services | 2.0 | 1.1 |
81292 | Photofinishing | 8.1 | 1.7 |
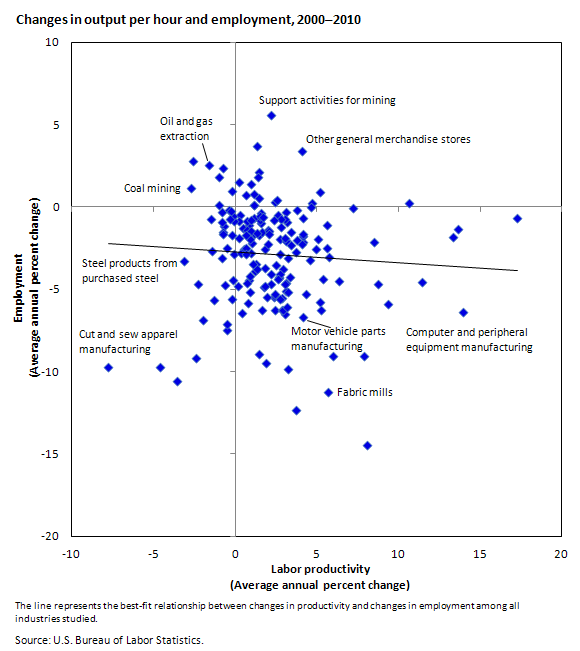
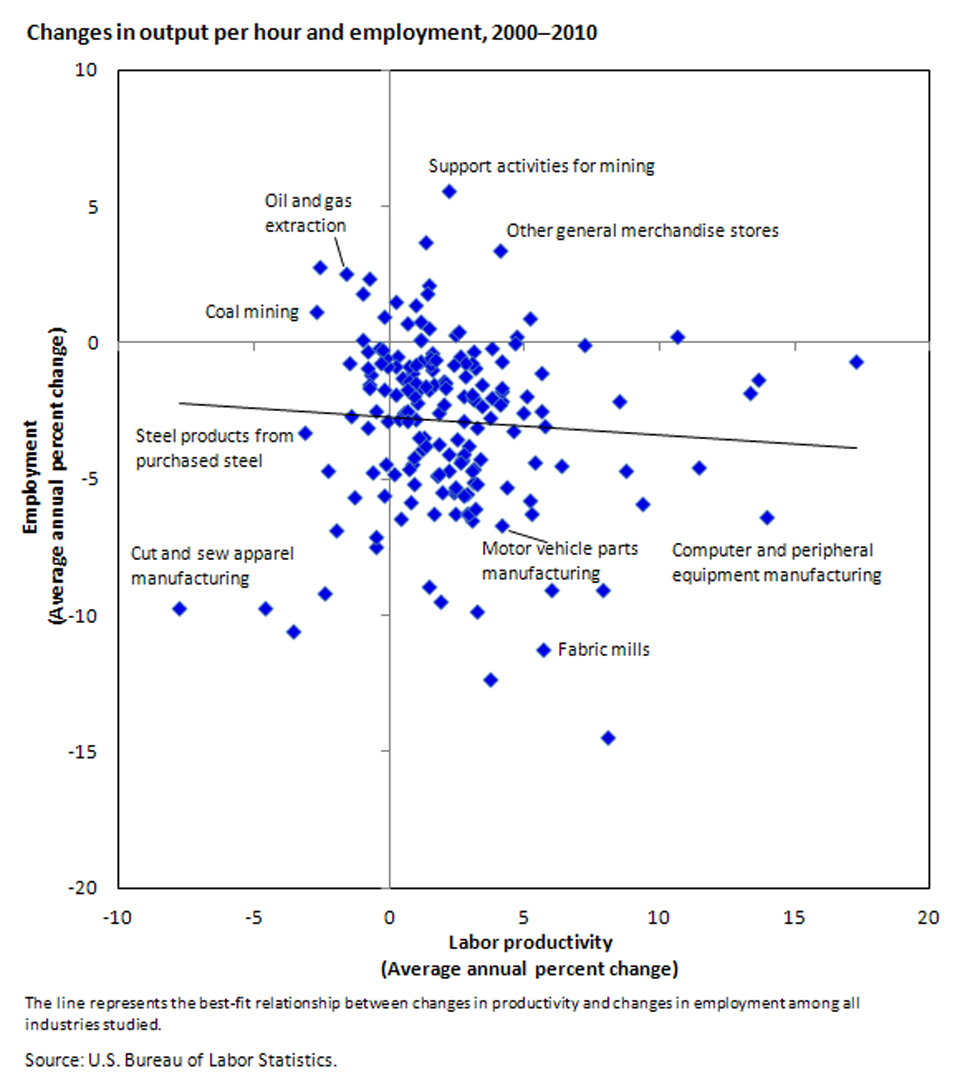
| NAICS code | Industry | Average annual percent change | |
|---|---|---|---|
| Productivity | Employment | ||
2111 | Oil and gas extraction | -1.6 | 2.5 |
2121 | Coal mining | -2.7 | 1.2 |
2122 | Metal ore mining | 0.3 | -0.5 |
2123 | Nonmetallic mineral mining and quarrying | 0.6 | -2.6 |
2131 | Support activities for mining | 2.2 | 5.5 |
2211 | Power generation and supply | 0.2 | -0.9 |
2212 | Natural gas distribution | 0.8 | -1.1 |
3111 | Animal food manufacturing | 3.2 | -0.9 |
3112 | Grain and oilseed milling | 1.6 | -1.0 |
3113 | Sugar and confectionery products | -0.0 | -2.9 |
3114 | Fruit and vegetable preserving and specialty food | 0.5 | -1.3 |
3115 | Dairy products | 2.6 | -0.5 |
3116 | Animal slaughtering and processing | 1.6 | -0.4 |
3117 | Seafood product preparation and packaging | 1.2 | -1.7 |
3118 | Bakeries and tortilla manufacturing | -0.1 | -0.9 |
3119 | Other food products | -0.2 | 0.9 |
3121 | Beverages | 3.1 | -0.3 |
3122 | Tobacco and tobacco products | 0.4 | -6.5 |
3131 | Fiber, yarn, and thread mills | 3.3 | -9.9 |
3132 | Fabric mills | 5.7 | -11.2 |
3133 | Textile and fabric finishing and fabric coating mills | 1.9 | -9.5 |
3141 | Textile furnishings mills | -0.5 | -7.5 |
3149 | Other textile product mills | 0.9 | -4.4 |
3151 | Apparel knitting mills | -3.6 | -10.6 |
3152 | Cut and sew apparel | -7.8 | -9.7 |
3159 | Apparel accessories and other apparel manufacturing | -4.6 | -9.7 |
3161 | Leather and hide tanning and finishing | 3.7 | -12.3 |
3162 | Footwear manufacturing | 1.5 | -8.9 |
3169 | Other leather and allied product manufacturing | -1.3 | -5.7 |
3211 | Sawmills and wood preservation | 3.1 | -5.1 |
3212 | Veneer, plywood, and engineered wood product manufacturing | 2.4 | -6.2 |
3219 | Other wood products | 2.4 | -5.5 |
3221 | Pulp, paper, and paperboard mills | 3.2 | -5.2 |
3222 | Converted paper products | 1.8 | -3.7 |
3231 | Printing and related support activities | 2.2 | -4.7 |
3241 | Petroleum and coal products | 1.5 | -0.8 |
3251 | Basic chemicals | 3.7 | -2.8 |
3252 | Resin, synthetic rubber, and artificial synthetic fibers and filaments | 2.2 | -4.0 |
3253 | Pesticides, fertilizers, and other agricultural chemicals | 5.0 | -2.6 |
3254 | Pharmaceutical and medicine manufacturing | -1.0 | 0.1 |
3255 | Paint, coatings, and adhesives | 1.3 | -3.5 |
3256 | Soaps, cleaning compounds, and toilet preparations | 4.2 | -2.1 |
3259 | Other chemical products and preparations | 1.2 | -3.9 |
3261 | Plastics products | 1.4 | -3.8 |
3262 | Rubber products | 2.4 | -5.4 |
3271 | Clay products and refractories | -0.2 | -5.6 |
3272 | Glass and glass product manufacturing | 2.4 | -5.3 |
3273 | Cement and concrete products | -0.8 | -3.1 |
3274 | Lime and gypsum products | 1.1 | -3.4 |
3279 | Other nonmetallic mineral products | 2.8 | -1.9 |
3311 | Iron and steel mills and ferroalloy manufacturing | 5.4 | -4.4 |
3312 | Steel products from purchased steel | -3.1 | -3.3 |
3313 | Alumina and aluminum production and processing | 5.2 | -5.8 |
3314 | Nonferrous metal (except aluminum) production and processing | 1.8 | -4.9 |
3315 | Foundries | 3.0 | -6.5 |
3321 | Forging and stamping | 2.7 | -4.2 |
3322 | Cutlery and handtool manufacturing | 2.9 | -6.2 |
3323 | Architectural and structural metals | 0.3 | -2.8 |
3324 | Boilers, tanks, and shipping containers | 1.1 | -2.2 |
3325 | Hardware manufacturing | -0.5 | -7.1 |
3326 | Spring and wire product manufacturing | 2.9 | -6.3 |
3327 | Machine shops; turned products; and screws, nuts, and bolts | 0.8 | -1.4 |
3328 | Coating, engraving, heat treating, and allied activities | 2.9 | -3.7 |
3329 | Other fabricated metal products | 1.8 | -2.6 |
3331 | Agriculture, construction, and mining machinery | 3.1 | -0.7 |
3332 | Industrial machinery | 0.2 | -4.8 |
3333 | Commercial and service industry machinery manufacturing | 1.9 | -4.8 |
3334 | Ventilation, heating, air-conditioning, and commercial refrigeration equipment manufacturing | 2.7 | -4.3 |
3335 | Metalworking machinery manufacturing | 2.0 | -5.5 |
3336 | Engine, turbine, and power transmission equipment manufacturing | 0.2 | -1.9 |
3339 | Other general purpose machinery | 2.8 | -4.1 |
3341 | Computer and peripheral equipment manufacturing | 14.0 | -6.4 |
3342 | Communications equipment | -2.0 | -6.9 |
3343 | Audio and video equipment manufacturing | -2.4 | -9.2 |
3344 | Semiconductor and other electronic component manufacturing | 9.4 | -5.9 |
3345 | Navigational, measuring, electromedical, and control instruments manufacturing | 4.1 | -1.8 |
3346 | Manufacturing and reproducing magnetic and optical media | 7.9 | -9.1 |
3351 | Electric lighting equipment | 3.2 | -6.1 |
3352 | Household appliances | 2.9 | -5.5 |
3353 | Electrical equipment manufacturing | 0.9 | -4.2 |
3359 | Other electrical equipment and components | 0.7 | -4.6 |
3361 | Motor vehicles | 5.3 | -6.3 |
3362 | Motor vehicle body and trailer manufacturing | 0.9 | -5.2 |
3363 | Motor vehicle parts | 4.2 | -6.7 |
3364 | Aerospace product and parts manufacturing | 2.8 | -0.7 |
3365 | Railroad rolling stock manufacturing | 4.3 | -5.3 |
3366 | Ship and boat building | 3.1 | -2.0 |
3369 | Other transportation equipment manufacturing | 8.5 | -2.1 |
3371 | Household and institutional furniture and kitchen cabinets | 1.7 | -6.3 |
3372 | Office furniture (including fixtures) manufacturing | 0.8 | -5.9 |
3379 | Other furniture related products | 3.1 | -4.6 |
3391 | Medical equipment and supplies manufacturing | 3.8 | -0.2 |
3399 | Other miscellaneous manufacturing | 2.6 | -4.4 |
4231 | Motor vehicles and parts | 3.4 | -1.6 |
4232 | Furniture and furnishings | 0.6 | -2.5 |
4233 | Lumber and construction supplies | 3.1 | -2.1 |
4234 | Commercial equipment | 13.3 | -1.8 |
4235 | Metals and minerals | -1.4 | -2.7 |
4236 | Electrical and electronic goods | 5.7 | -3.1 |
4237 | Hardware and plumbing | 1.0 | -1.4 |
4238 | Machinery and supplies | 0.8 | -1.8 |
4239 | Miscellaneous durable goods | -0.1 | -0.6 |
4241 | Paper and paper products | 2.5 | -3.5 |
4242 | Drugs and druggists' sundries merchant wholesalers | 7.2 | -0.1 |
4243 | Apparel and piece goods | 3.8 | -2.0 |
4244 | Grocery and related products | 1.1 | 0.1 |
4245 | Farm product raw materials | 1.2 | -0.7 |
4246 | Chemicals | 1.5 | -1.7 |
4247 | Petroleum | 0.7 | -2.5 |
4248 | Alcoholic beverages | -0.7 | 2.4 |
4249 | Miscellaneous nondurable goods | -0.2 | -1.7 |
4251 | Wholesale electronic markets and agents and brokers | -2.5 | 2.8 |
4411 | Automobile dealers | 0.9 | -1.9 |
4412 | Other motor vehicle dealers | 0.7 | -0.9 |
4413 | Automotive parts, accessories, and tire stores | -0.8 | -0.3 |
4421 | Furniture stores | 3.3 | -3.1 |
4422 | Home furnishings stores | 5.1 | -2.0 |
4431 | Electronics and appliance stores | 13.7 | -1.3 |
4441 | Building material and supplies dealers | 1.2 | 0.1 |
4442 | Lawn and garden equipment and supplies stores | 5.6 | -2.5 |
4451 | Grocery stores | 1.5 | -0.5 |
4452 | Specialty food stores | 3.4 | -2.3 |
4453 | Beer, wine, and liquor stores | 4.1 | -0.7 |
4461 | Health and personal care stores | 2.5 | 0.3 |
4471 | Gasoline stations | 2.0 | -1.4 |
4481 | Clothing stores | 5.2 | 0.9 |
4482 | Shoe stores | 2.4 | -0.8 |
4483 | Jewelry, luggage, and leather goods stores | 1.6 | -1.6 |
4511 | Sporting goods, hobby, and musical instrument stores | 4.7 | 0.3 |
4512 | Book, periodical, and music stores | 2.7 | -5.6 |
4521 | Department stores | -0.7 | -1.5 |
4529 | Other general merchandise stores | 4.1 | 3.4 |
4531 | Florists | 3.1 | -4.7 |
4532 | Office supplies, stationery, and gift stores | 6.4 | -4.5 |
4533 | Used merchandise stores | 4.1 | -2.3 |
4539 | Other miscellaneous store retailers | -1.5 | -0.7 |
4541 | Electronic shopping and mail-order houses | 10.6 | 0.2 |
4542 | Vending machine operators | -0.6 | -4.7 |
4543 | Direct selling establishments | 0.9 | -2.8 |
481 | Air transportation | 4.6 | -3.2 |
482111 | Line-haul railroads | 2.8 | -1.2 |
48421 | Used household and office goods moving | -0.5 | -2.5 |
4911 | Postal service | 0.7 | -2.9 |
492 | Couriers and messengers | -0.7 | -1.1 |
4931 | Warehousing and storage | 1.5 | 2.1 |
5111 | Newspaper, periodical, book, and directory publishers | -0.2 | -4.5 |
5112 | Software publishers | 4.7 | -0.0 |
51213 | Motion picture and video exhibition | 1.7 | -0.6 |
5152 | Cable and other subscription programming | 5.6 | -1.1 |
5171 | Wired telecommunications carriers | 3.3 | -4.3 |
5172 | Wireless telecommunications carriers (except satellite) | 17.3 | -0.6 |
52211 | Commercial banking | 2.6 | 0.4 |
532111 | Passenger car rental | 2.8 | -2.9 |
53223 | Video tape and disc rental | 6.0 | -9.0 |
541213 | Tax preparation services | -1.0 | 1.8 |
54133 | Engineering services | 1.2 | 0.8 |
54181 | Advertising agencies | 4.2 | -1.6 |
541921 | Photography studios, portrait | -0.3 | -0.7 |
561311 | Employment placement agencies | 11.4 | -4.6 |
71395 | Bowling centers | 2.1 | -1.6 |
7222 | Limited-service eating places | 1.0 | 1.4 |
7223 | Special food services | 0.6 | 0.7 |
7224 | Drinking places (alcoholic beverages) | 2.1 | -1.5 |
8111 | Automotive repair and maintenance | -0.8 | -0.9 |
81221 | Funeral homes and funeral services | -0.2 | -0.2 |
81292 | Photofinishing | 8.1 | -14.4 |
8123 | Drycleaning and laundry services | 2.0 | -2.3 |
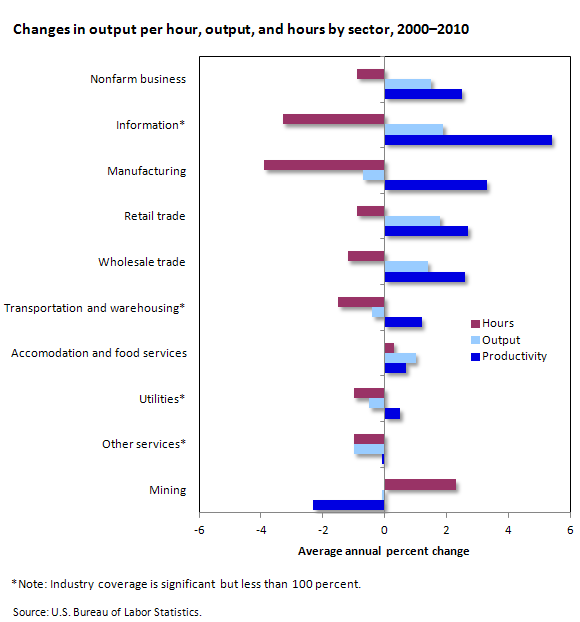
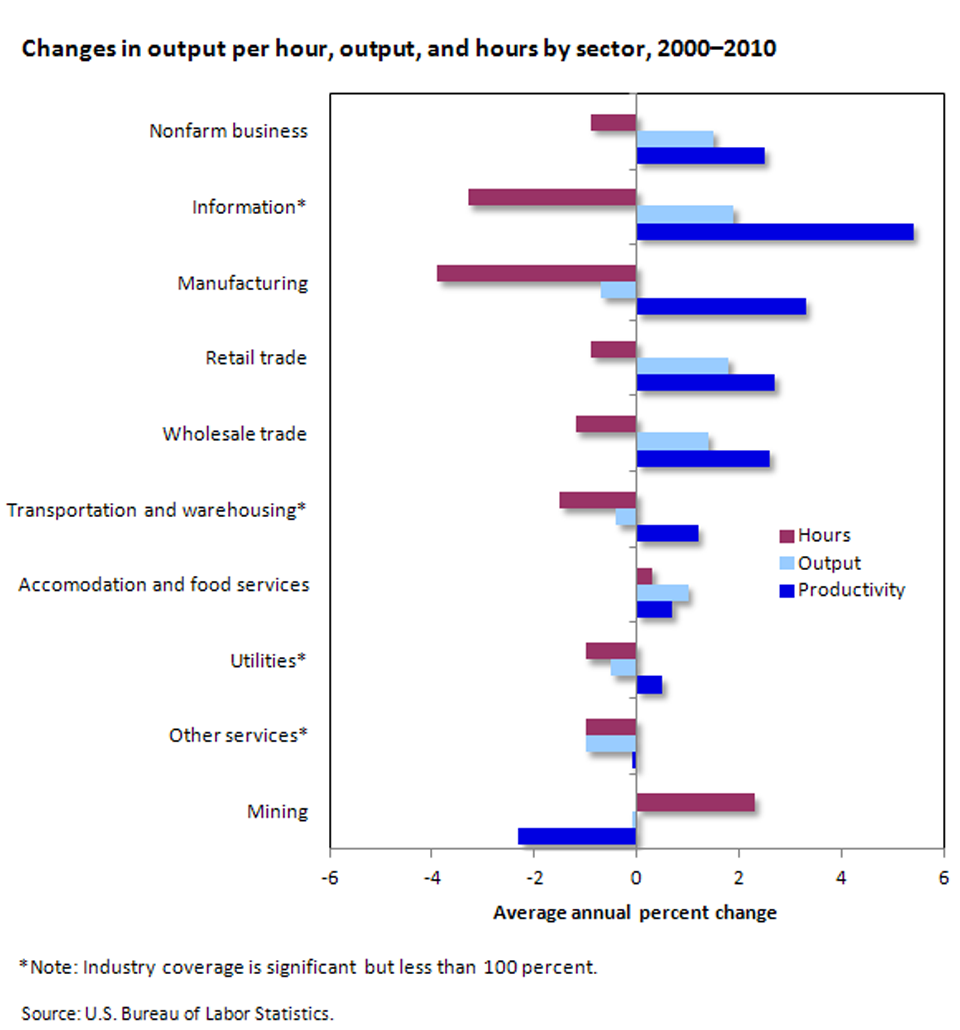
| Industry | Productivity | Ouput | Hours |
|---|---|---|---|
Information(1) | 5.4 | 1.9 | -3.3 |
Manufacturing | 3.3 | -0.7 | -3.9 |
Retail trade | 2.7 | 1.8 | -0.9 |
Wholesale trade | 2.6 | 1.4 | -1.2 |
Transportation and warehousing(1) | 1.2 | -0.4 | -1.5 |
Accomodation and food services | 0.7 | 1.0 | 0.3 |
Utilities(1) | 0.5 | -0.5 | -1.0 |
Other services(1) | -0.1 | -1.0 | -1.0 |
Mining | -2.3 | -0.1 | 2.3 |
Footnotes: | |||
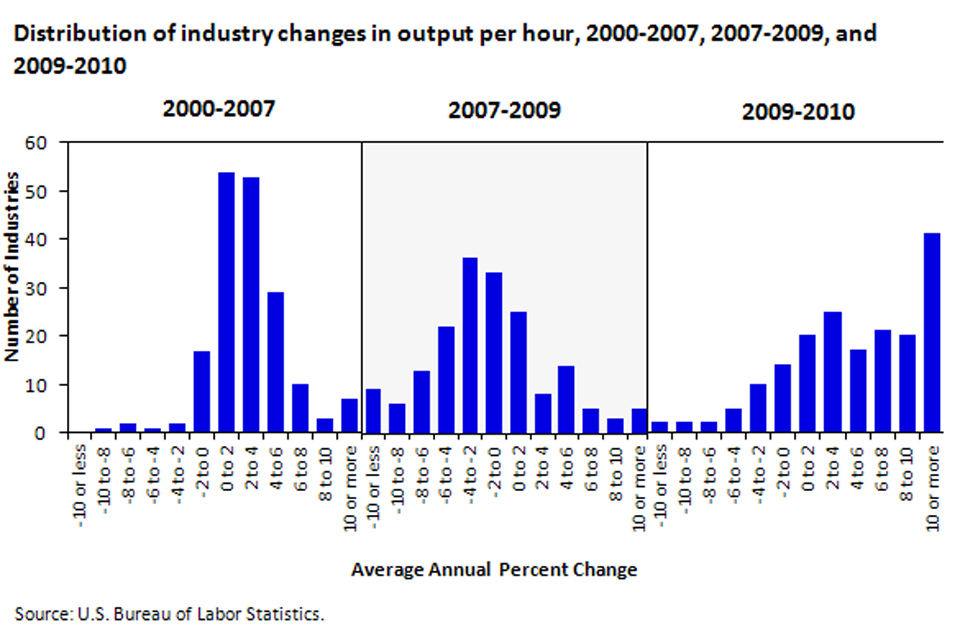
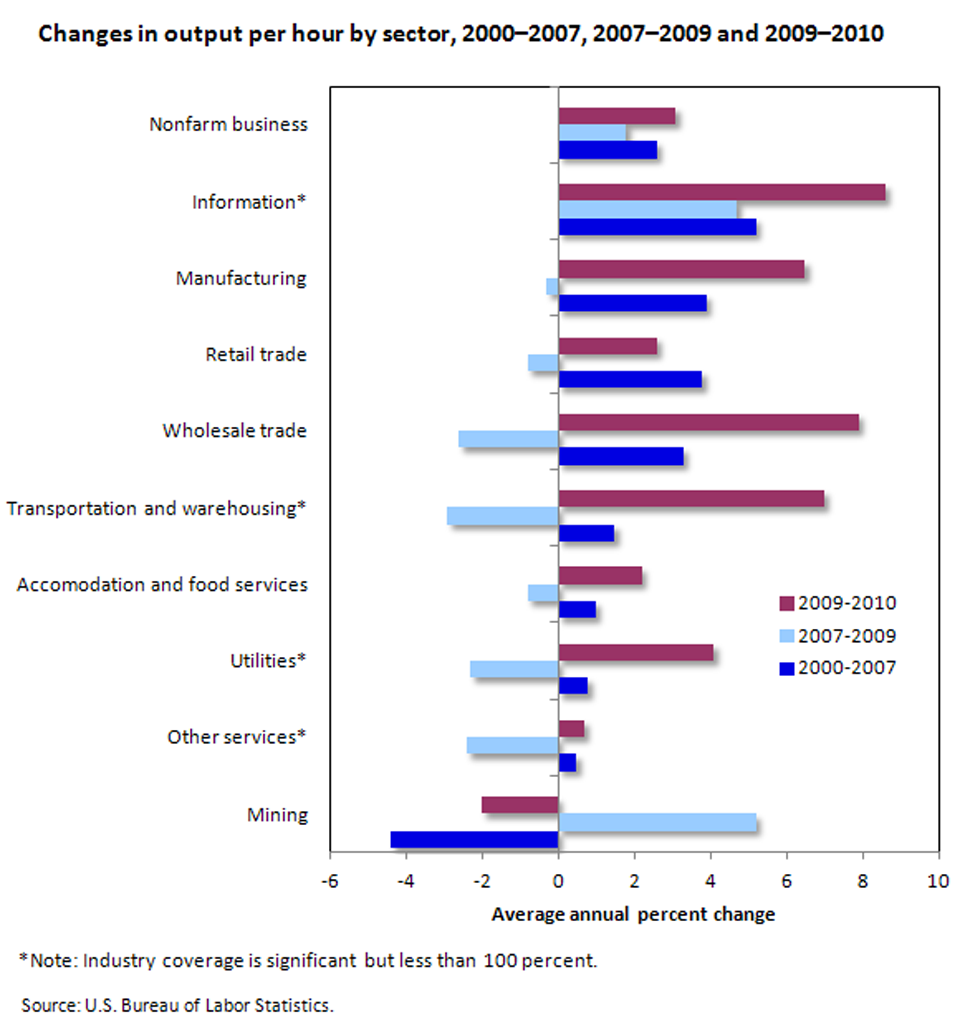
| Industry | 2000–2007 | 2007–2009 | 2009–2010 |
|---|---|---|---|
Nonfarm business | 2.6 | 1.8 | 3.1 |
Information(1) | 5.2 | 4.7 | 8.6 |
Manufacturing | 3.9 | -0.3 | 6.5 |
Retail trade | 3.8 | -0.8 | 2.6 |
Wholesale trade | 3.3 | -2.6 | 7.9 |
Transportation and warehousing(1) | 1.5 | -2.9 | 7.0 |
Accomodation and food services | 1.0 | -0.8 | 2.2 |
Utilities(1) | 0.8 | -2.3 | 4.1 |
Other services(1) | 0.5 | -2.4 | 0.7 |
Mining | -4.4 | 5.2 | -2.0 |
Footnotes: | |||