An official website of the United States government
An official website of the United States government
The .gov means it's official.
Federal government websites often end in .gov or .mil. Before sharing sensitive information,
make sure you're on a federal government site.
The site is secure.
The
https:// ensures that you are connecting to the official website and that any
information you provide is encrypted and transmitted securely.

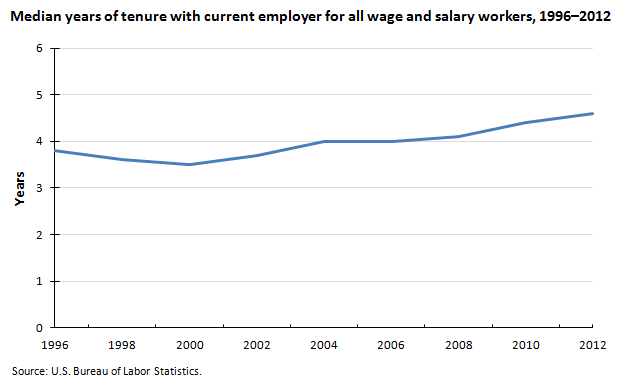
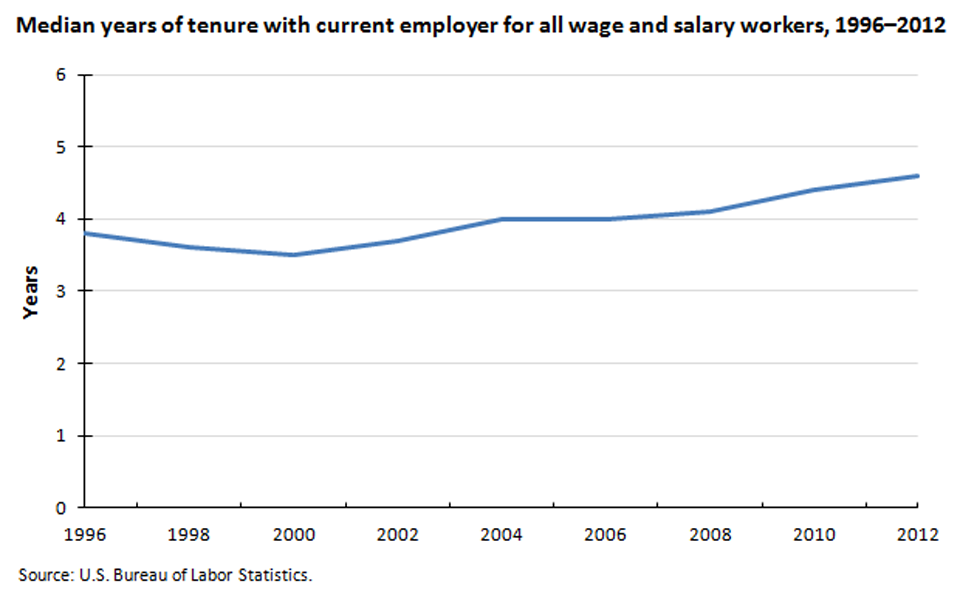
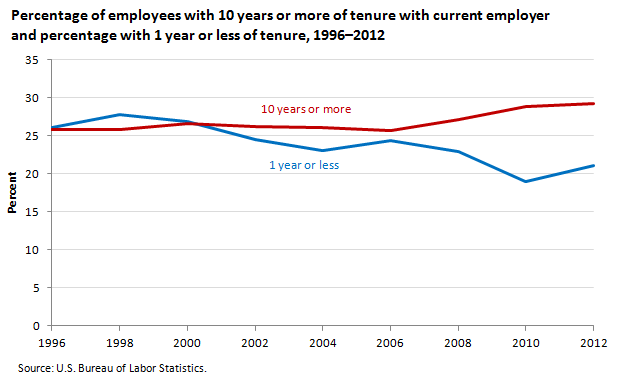
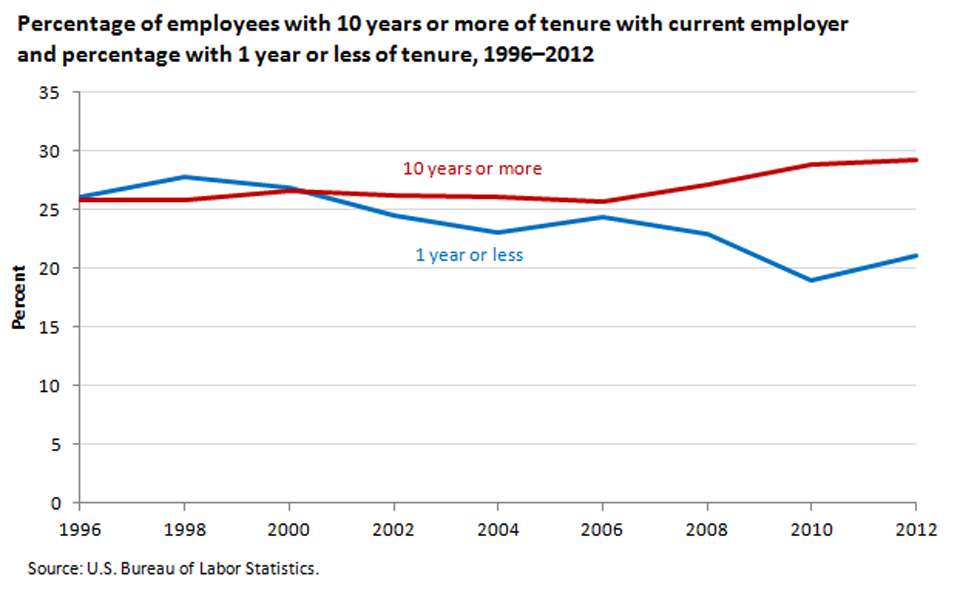
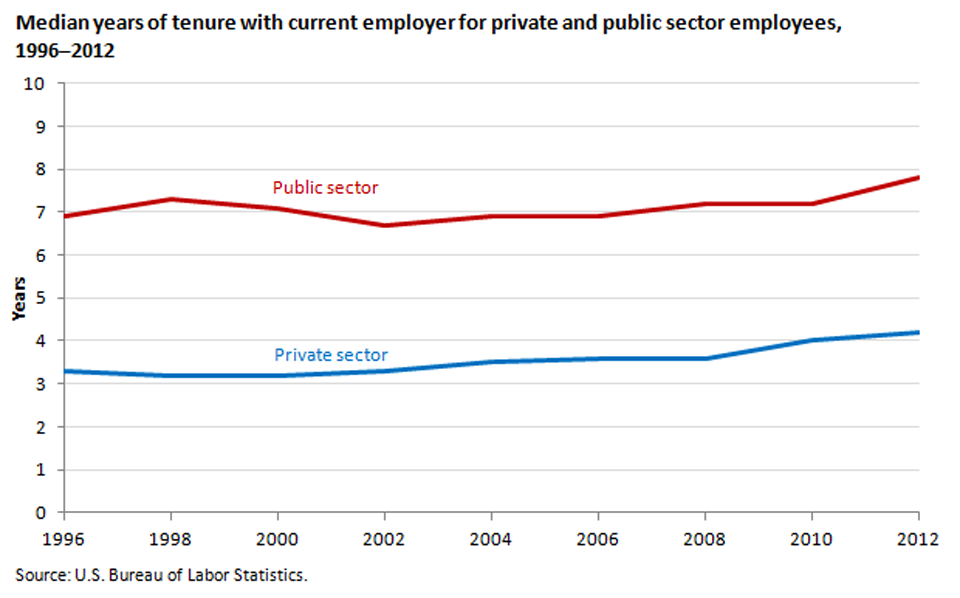
| Year | Percent with 1 year or less | Percent with 10 years or more |
|---|---|---|
1996 | 26.0 | 25.8 |
1998 | 27.8 | 25.8 |
2000 | 26.8 | 26.6 |
2002 | 24.5 | 26.2 |
2004 | 23.0 | 26.0 |
2006 | 24.4 | 25.6 |
2008 | 22.9 | 27.1 |
2010 | 19.0 | 28.8 |
2012 | 21.1 | 29.2 |
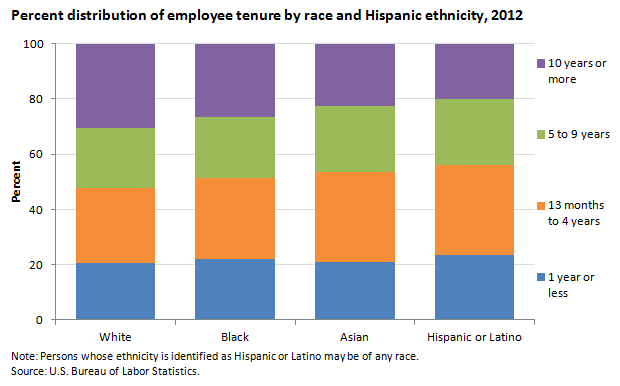
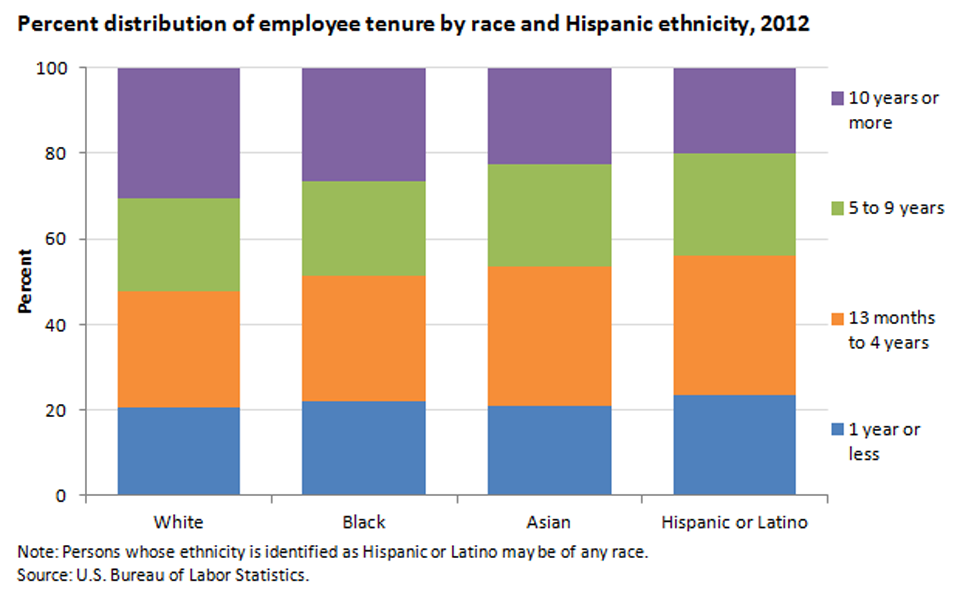
| Tenure with current employer | White | Black | Asian | Hispanic or Latino |
|---|---|---|---|---|
1 year or less | 20.7 | 22.2 | 21.1 | 23.6 |
13 months to 4 years | 27.2 | 29.3 | 32.4 | 32.6 |
5 to 9 years | 21.7 | 22.1 | 23.8 | 23.7 |
10 years or more | 30.5 | 26.4 | 22.7 | 20.2 |
Note: Persons whose ethnicity is identified as Hispanic or Latino may be of any race.
| ||||
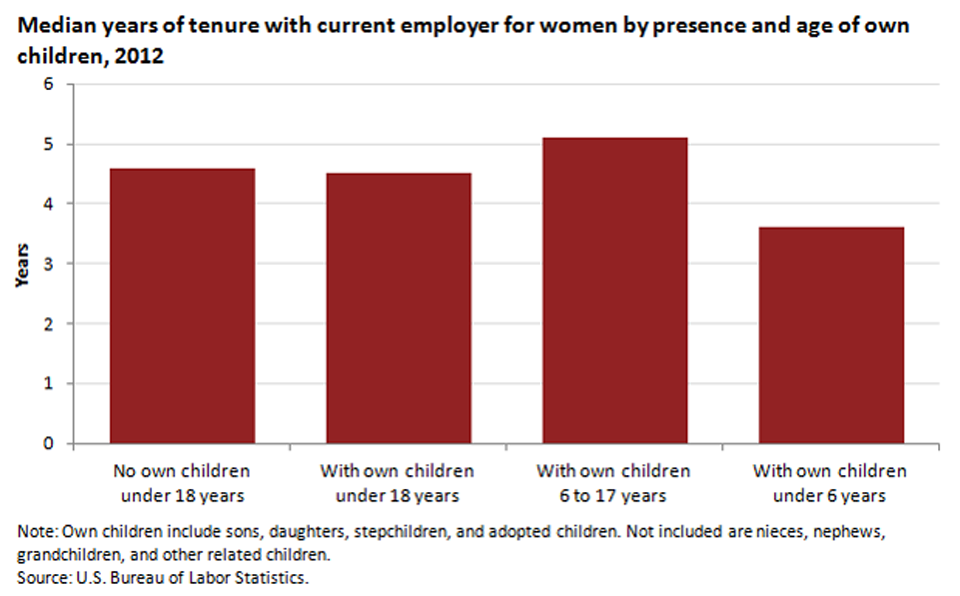
| Presence and age of children | Years of tenure |
|---|---|
No own children under 18 years | 4.6 |
With own children under 18 years | 4.5 |
With own children 6 to 17 years | 5.1 |
With own children under 6 years | 3.6 |
Note: Own children include sons, daughters, stepchildren, and adopted children. Not included are nieces, nephews, grandchildren, and other related children.
| |
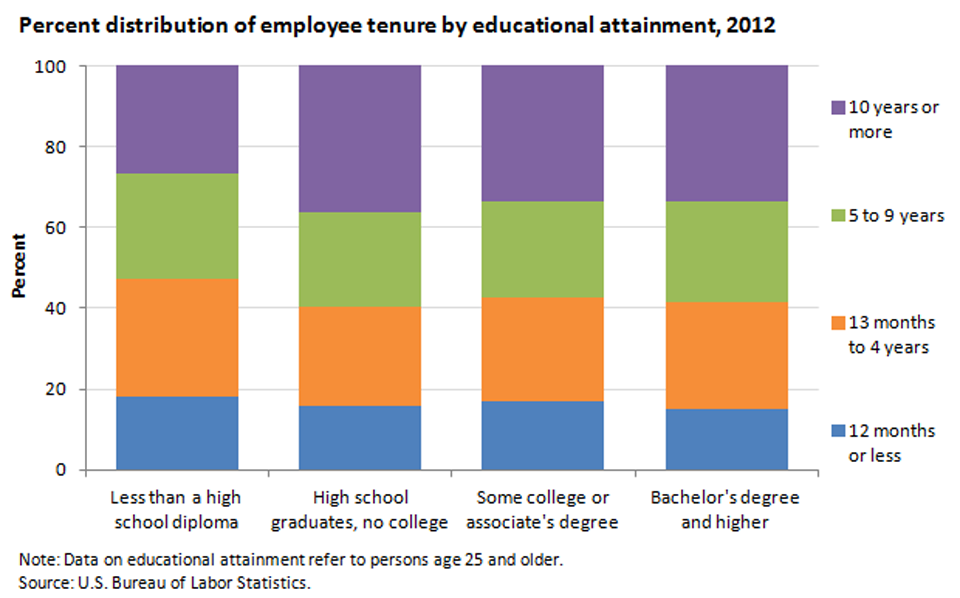
| Education level | Tenure with current employer | |||
|---|---|---|---|---|
| 12 months or less | 13 months to 4 years | 5 to 9 years | 10 years or more | |
Less than a high school diploma | 18.2 | 29.1 | 25.9 | 26.8 |
High school graduates, no college | 16.0 | 24.3 | 23.4 | 36.2 |
Some college or associate's degree | 16.9 | 25.9 | 23.7 | 33.6 |
Bachelor's degree and higher | 14.9 | 26.7 | 24.9 | 33.4 |
Note: Data on educational attainment refer to persons age 25 and older.
| ||||
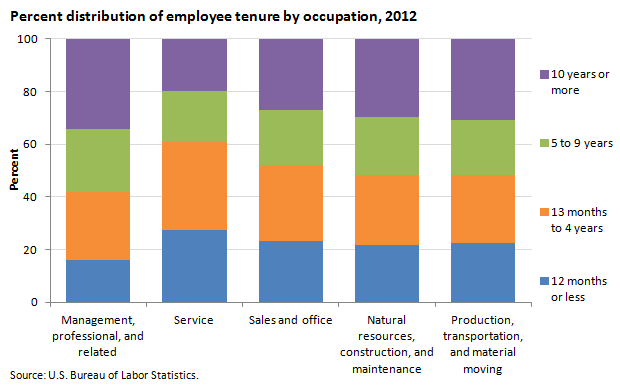
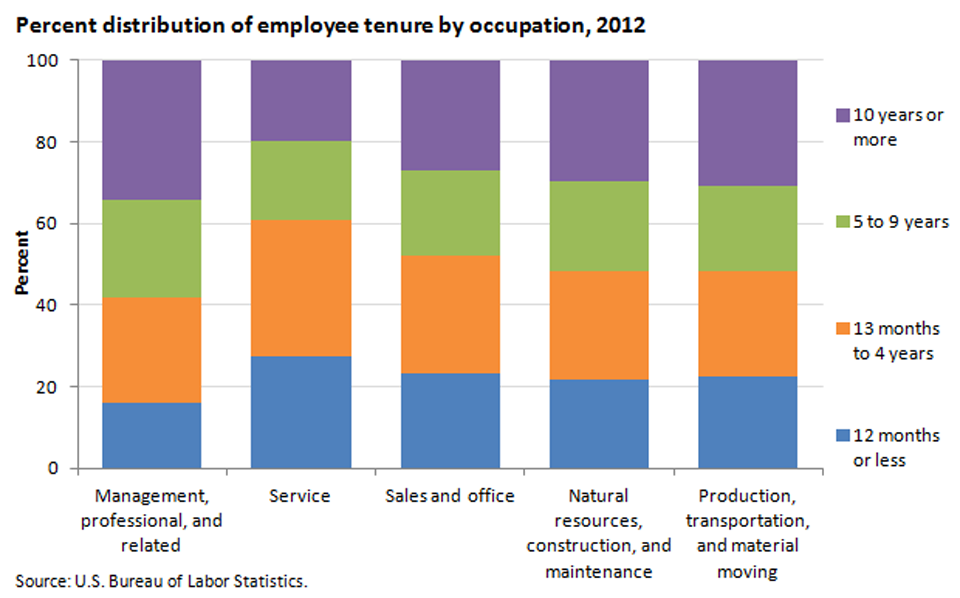
| Occupation | 12 months or less | 13 months to 4 years | 5 to 9 years | 10 years or more |
|---|---|---|---|---|
Management, professional, and related | 16.1 | 25.7 | 23.8 | 34.3 |
Service | 27.5 | 33.5 | 19.1 | 20.0 |
Sales and office | 23.4 | 28.6 | 20.9 | 27.1 |
Natural resources, construction, and maintenance | 21.7 | 26.7 | 21.9 | 29.5 |
Production, transportation, and material moving | 22.6 | 25.7 | 20.8 | 30.9 |