An official website of the United States government
 United States Department of Labor
The educational services industry group comprises the following industry groups: (1) Elementary and Secondary Schools: NAICS 6111; (2) Junior Colleges: NAICS 6112; (3) Colleges, Universities, and Professional Schools: NAICS 6113; (4) Business Schools and Computer and Management Training: NAICS 6114; (5) Technical and Trade Schools: NAICS 6115; (6) Other Schools and Instruction: NAICS 6116; and (7) Educational Support Services: NAICS 6117.
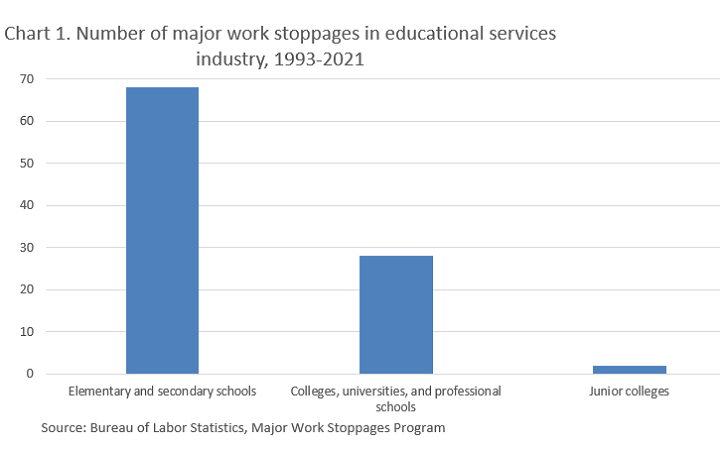
Between 1993 and 2021 there were 98 major work stoppages in educational services. The majority (69 percent) occurred in elementary and secondary schools. About 29 percent were in colleges, universities, and professional schools, and 2 percent in junior colleges. (See chart 1).
| Industry (NAICS) | Number of major work stoppages |
|---|---|
|
Elementary and Secondary Schools (6111) |
68 |
|
Colleges, Universities, and Professional Schools (6113) |
28 |
|
Junior Colleges (6112) |
2 |
|
Source: U.S. Bureau of Labor Statistics, Major Work Stoppages Program. |
|
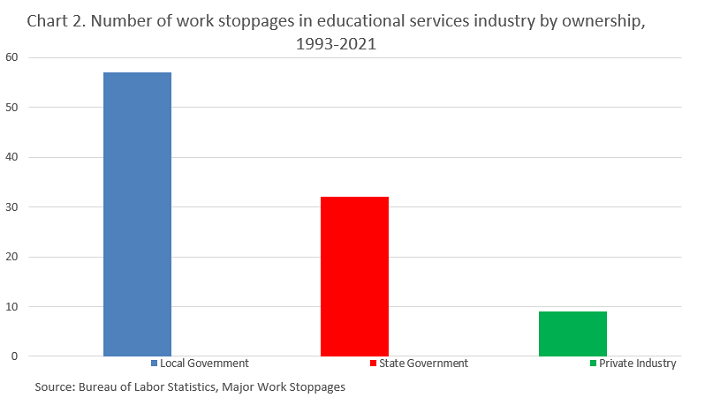
The majority (91 percent) of the major work stoppages in educational services occurred in state and local governments, and 9 percent in private industry. (See chart 2).
| Ownership group | Number of work stoppages |
|---|---|
|
Local Government |
57 |
|
State Government |
32 |
|
Private Industry |
9 |
|
Source: U.S. Bureau of Labor Statistics, Major Work Stoppages Program. |
|
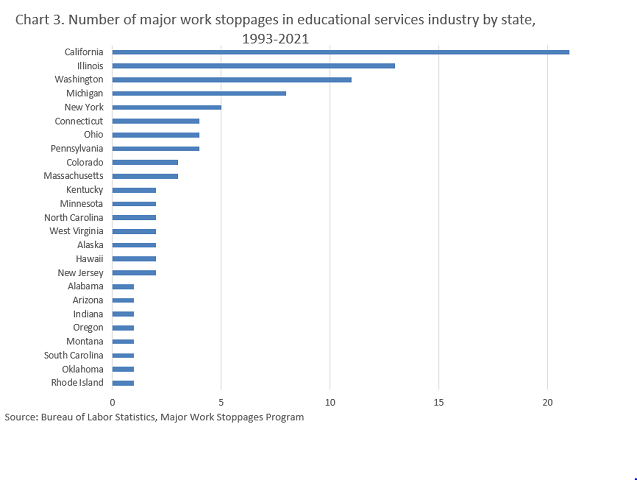
There were almost 3.7 million workers employed in educational services nationwide in December 2021. While New York state had the highest number of workers in educational services, around 500 thousand, there were only 5 major major work stoppages in this industry registered in the state since 1993. California employs the second highest number of educational services workers, 385 thousand, and had the highest number of major work stoppages (21).
| State | Number of major work stoppages |
|---|---|
|
California |
21 |
|
Illinois |
13 |
|
Washington |
11 |
|
Michigan |
8 |
|
New York |
5 |
|
Connecticut |
4 |
|
Ohio |
4 |
|
Pennsylvania |
4 |
|
Colorado |
3 |
|
Massachusetts |
3 |
|
Kentucky |
2 |
|
Minnesota |
2 |
|
North Carolina |
2 |
|
West Virginia |
2 |
|
Alaska |
2 |
|
Hawaii |
2 |
|
New Jersey |
2 |
|
Alabama |
1 |
|
Arizona |
1 |
|
Indiana |
1 |
|
Oregon |
1 |
|
Montana |
1 |
|
South Carolina |
1 |
|
Oklahoma |
1 |
|
Rhode Island |
1 |
|
Source: U.S. Bureau of Labor Statistics, Major Work Stoppages Program. |
|
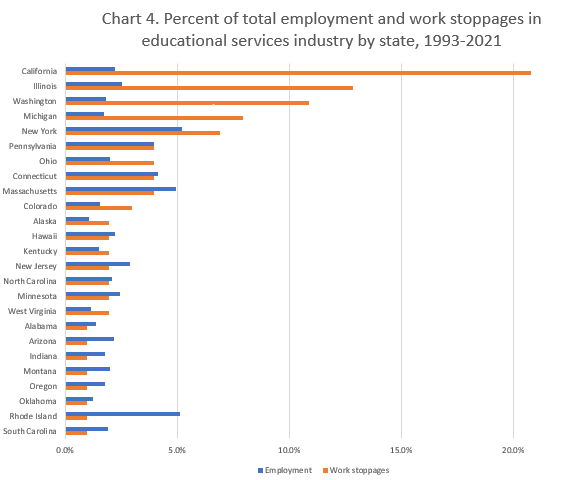
New York, with around 5 percent of all workers employed in educational services accounted for around 7 percent of all major work stoppages in educational services between 1993 and 2021. California, with 2.2 percent employed in educational services industry accounted for 21 percent.
| State | Employment | Work stoppages |
|---|---|---|
|
California |
2.2% | 20.8% |
|
Illinois |
2.6% | 12.9% |
|
Washington |
1.8% | 10.9% |
|
Michigan |
1.7% | 7.9% |
|
Pennsylvania |
4.0% | 4.0% |
|
Ohio |
2.0% | 4.0% |
|
Connecticut |
4.2% | 4.0% |
|
Colorado |
1.6% | 3.0% |
|
New York |
5.2% | 6.9% |
|
Massachusetts |
5.0% | 4.0% |
|
Alaska |
1.1% | 2.0% |
|
Hawaii |
2.2% | 2.0% |
|
Kentucky |
1.5% | 2.0% |
|
New Jersey |
2.9% | 2.0% |
|
North Carolina |
2.1% | 2.0% |
|
Minnesota |
2.4% | 2.0% |
|
West Virginia |
1.2% | 2.0% |
|
Alabama |
1.4% | 1.0% |
|
Arizona |
2.2% | 1.0% |
|
Indiana |
1.8% | 1.0% |
|
Montana |
2.0% | 1.0% |
|
Oregon |
1.8% | 1.0% |
|
Oklahoma |
1.2% | 1.0% |
|
Rhode Island |
5.1% | 1.0% |
|
South Carolina |
1.9% | 1.0% |
|
Source: U.S. Bureau of Labor Statistics, Major Work Stoppages Program. |
||
The longest work stoppage in 1993-2021 period in educational services occurred in 1996 in Oakland and lasted for 34 calendar days. There were 25 working days lost.
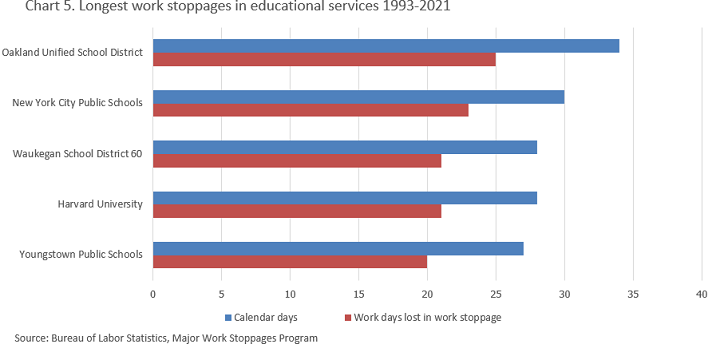
| Organization(s) involved | State(s) | Area(s) | Ownership | Union | Work stoppage beginning date | Work stoppage ending date | Number of workers | Calendar days | Work days lost in work stoppage |
|---|---|---|---|---|---|---|---|---|---|
|
Oakland Unified School District |
CA | Oakland | Local government | Oakland Education Association | 2/15/1996 | 3/20/1996 | 3,500 | 34 | 25 |
|
New York City Public Schools |
NY | New York | Local government | Amalgamated Transit Union | 1/16/2013 | 2/15/2013 | 8,000 | 30 | 23 |
|
Waukegan School District 60 |
IL | Waukegan | Local government | Lake County Federation of Teachers | 10/2/2014 | 10/30/2014 | 1,200 | 28 | 21 |
|
Harvard University |
MA | Statewide | Private industry | Harvard Graduate Students Union - United Automobile Workers | 12/3/2019 | 12/31/2019 | 2,400 | 28 | 21 |
|
Youngstown Public Schools |
OH | Youngstown | Local government | Youngstown Education Association | 9/8/1993 | 10/5/1993 | 1,000 | 27 | 20 |
|
Source: U.S. Bureau of Labor Statistics, Major Work Stoppages Program. |
|||||||||
Largest work stoppages in educational services in 1993-2021 by number of workers involved, all occurred during 2018 due to increased activity of the unions representing the teachers. The largest one was a single day walkout in North Carolina where 123,000 workers in 20 school districts participated.
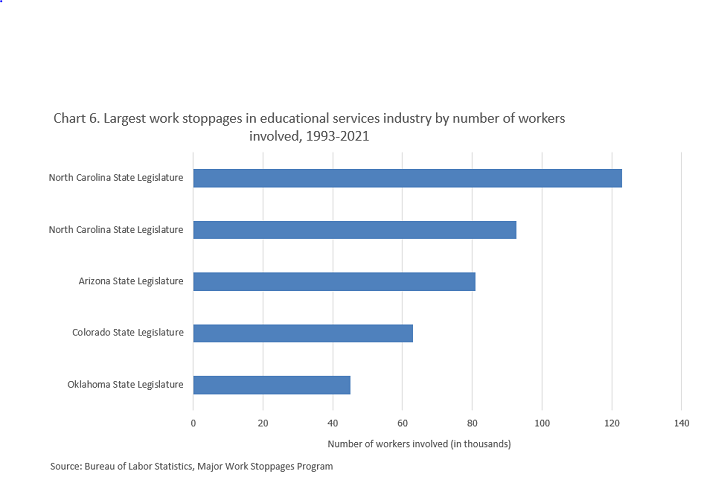
| Organization(s) involved | State(s) | Area(s) | Ownership | Union | Work stoppage beginning date | Work stoppage ending date | Number of workers | Days idle, cumulative for this work stoppage |
|---|---|---|---|---|---|---|---|---|
|
North Carolina State Legislature[1] |
NC | Statewide | State government | North Carolina Association of Educators | 5/16/2018 | 5/16/2018 | 123,000 | 123,000 |
|
North Carolina State Legislature[1] |
NC | Statewide | State government | North Carolina Association of Educators | 5/1/2019 | 5/1/2019 | 92,700 | 92,700 |
|
Arizona State Legislature[2] |
AZ | Statewide | State government | Arizona Education Association | 4/26/2018 | 5/3/2018 | 81,000 | 486,000 |
|
Colorado State Legislature[3] |
CO | Statewide | State government | Colorado Education Association | 4/26/2018 | 4/27/2018 | 63,000 | 126,000 |
|
Oklahoma State Legislature[4] |
OK | Statewide | State government | Oklahoma Education Association | 4/2/2018 | 4/12/2018 | 45,000 | 405,000 |
|
Footnotes: [1] Estimates based on identified school closings and employee data from North Carolina Board of Education reports. [2] Estimates based on identified school closings and employee data from Arizona Department of Education reports. [3] Estimates based on identified school closings and employee data from Colorado Department of Education reports. [4] Estimates based on identified school closings and employee data from Oklahoma Department of Education reports. Source: U.S. Bureau of Labor Statistics, Major Work Stoppages Program. |
||||||||
Six statewide major work stoppages captured media attention during 2018, which idled 373,000 workers. An increased activity among unions representing the teachers and supporting staff turned into entire school districts shut down for several days in those states. The largest work stoppage by days idle was between the Arizona State Legislature and Arizona Education Association and involved 81,000 teachers and staff totaling 486,000 days of idleness.
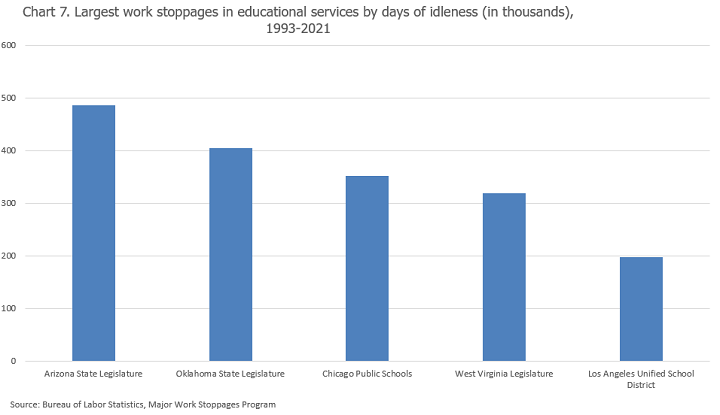
| Organization(s) involved | State(s) | Area(s) | Ownership | Union | Work stoppage beginning date | Work stoppage ending date | Number of workers | Days idle, cumulative for this work stoppage |
|---|---|---|---|---|---|---|---|---|
|
Arizona State Legislature[1] |
AZ | Statewide | State government | Arizona Education Association | 4/26/2018 | 5/3/2018 | 81,000 | 486,000 |
|
Oklahoma State Legislature[2] |
OK | Statewide | State government | Oklahoma Education Association | 4/2/2018 | 4/12/2018 | 45,000 | 405,000 |
|
Chicago Public Schools |
IL | Chicago | Local government | Chicago Teachers Union and Service Employees International Union | 10/17/2019 | 10/31/2019 | 32,000 | 352,000 |
|
West Virginia Legislature[[3] |
WV | Statewide | State government | West Virginia Education Association | 2/16/2018 | 3/6/2018 | 35,000 | 318,600 |
|
Los Angeles Unified School District |
CA | Los Angeles | Local government | United Teachers Los Angeles | 1/14/2019 | 1/22/2019 | 33,000 | 198,000 |
|
Footnotes: [1] Estimates based on identified school closings and employee data from Arizona Department of Education reports. [2] Estimates based on identified school closings and employee data from Oklahoma Department of Education reports. [3] On February 16th, West Virginia school personnel from five counties (Mason, Cabell, Wayne, Lincoln, and Clay) were involved in a one-day work stoppage and those figures were included in monthly and cumulative days idle calculations for the statewide work stoppage beginning on February 22nd. Source: U.S. Bureau of Labor Statistics, Major Work Stoppages Program. |
||||||||