
This column is called the Commissioner’s Corner, but I’m just keeping the seat warm until a new Commissioner is nominated by the President and confirmed by the Senate. More often than not I feel like I’m back in school, having to learn new concepts from scratch. Fortunately, I’m surrounded by incredibly knowledgeable and dedicated BLS employees who go out of their way to make sure things are done correctly and are very patient in helping me to learn new things. That certainly was the case with the September 2017 Employment Situation report, released on October 6.
The turnaround time from data collection to processing to publication of most BLS data series is very short. That’s the case with the monthly employment and unemployment information. I first saw the payroll employment information about 48 hours before we would release it, and my reaction isn’t suitable for a G-rated blog. What happened? The employment information looked so much different from the recent trend. Fortunately, some more information from that dedicated staff helped me to understand what was going on.
If you haven’t heard, it’s hurricane season. And several storms affected the United States in August and September. Evacuations, damaged businesses, and damaged homes have a lot of implications, including for the job market. Let me give you my description of what the data reveal, using (I hope) some nontechnical terms.
The monthly Employment Situation release contains information from two separate surveys—a survey of businesses (called the Current Employment Statistics program) and a survey of households (called the Current Population Survey). We get different information from each survey, but over time they typically tell a consistent story. For example, during the 2007–09 recession, the business survey showed a decline in jobs, while the household survey showed an increase in unemployment. A consistent story.
So what happened in September 2017?
The business survey asks how many workers were paid for any time during the payroll period that includes the 12th of September. An important fact to understand is that people who did not receive pay for the payroll period are not counted as employed. In September, the business survey showed that the number of jobs in “food service and drinking places” (let’s call them restaurants) declined by 105,000 from the previous month. That’s very different from the trend, which has shown consistent job gains. Workers in these jobs are typically paid on an hourly basis and don’t get paid if they don’t work. This large decline in restaurant jobs in turn affected the overall number of jobs, which declined by 33,000.
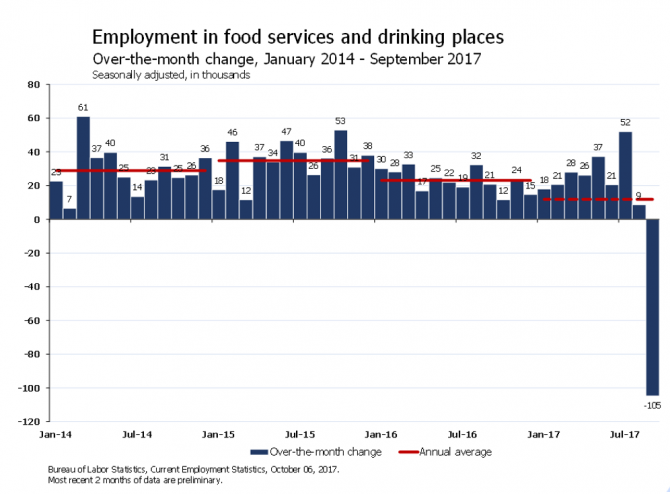
Editor’s note: Data for this chart are available in the table below.
In contrast, the household survey showed an increase in people who were employed and a decrease in the unemployment rate. Once again, it is important to understand definitions. In this survey, people are counted as employed if they had a job but did not work due to bad weather, whether or not they were paid. So those same restaurant workers who were not paid and therefore not counted in the business survey were counted as employed in the household survey.
And the household survey tells us more. In something we call the “bad weather” series, 1.5 million employed Americans were not at work due to bad weather during the week that included September 12. This is the highest number for that series in over 20 years. In contrast, in September 2016 there were only 24,000 people in this category. The number of “bad weather” workers was unusually high because Hurricane Irma happened to fall during the week that included September 12—the reference period for the survey. The figure was much lower for many other major weather events, including Hurricane Katrina in 2005, because those events fell outside the reference period for the survey.
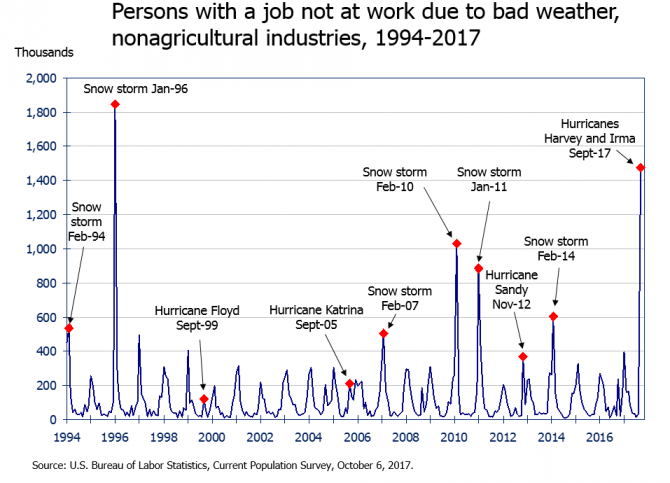
Editor’s note: Data for this chart are available at https://data.bls.gov/timeseries/LNU02036012
So what I thought would be a major story turned out to be easily explained by weather events and differing definitions. And it taught me something new about the wide variety of information available from BLS.
One last note. The national information included in the monthly Employment Situation news release does not include data for the U.S. territories, such as Puerto Rico and the U.S. Virgin Islands. Data for some territories are included with the State Employment and Unemployment news release, which typically is available a couple weeks after the national data. Want to know about how recent hurricanes have affected BLS data? See our page about Hurricanes Harvey, Irma, and Maria.
| Month | Change |
|---|---|
| Jan 2014 | 22,700 |
| Feb 2014 | 6,500 |
| Mar 2014 | 61,000 |
| Apr 2014 | 36,600 |
| May 2014 | 39,600 |
| Jun 2014 | 25,000 |
| Jul 2014 | 13,500 |
| Aug 2014 | 23,300 |
| Sep 2014 | 31,400 |
| Oct 2014 | 24,700 |
| Nov 2014 | 26,300 |
| Dec 2014 | 36,400 |
| Jan 2015 | 17,600 |
| Feb 2015 | 46,200 |
| Mar 2015 | 11,600 |
| Apr 2015 | 37,100 |
| May 2015 | 33,900 |
| Jun 2015 | 46,500 |
| Jul 2015 | 39,700 |
| Aug 2015 | 26,400 |
| Sep 2015 | 36,200 |
| Oct 2015 | 52,900 |
| Nov 2015 | 30,800 |
| Dec 2015 | 38,000 |
| Jan 2016 | 30,000 |
| Feb 2016 | 28,100 |
| Mar 2016 | 32,700 |
| Apr 2016 | 16,900 |
| May 2016 | 24,600 |
| Jun 2016 | 21,900 |
| Jul 2016 | 19,100 |
| Aug 2016 | 32,300 |
| Sep 2016 | 20,800 |
| Oct 2016 | 11,500 |
| Nov 2016 | 23,700 |
| Dec 2016 | 14,700 |
| Jan 2017 | 18,000 |
| Feb 2017 | 20,600 |
| Mar 2017 | 27,900 |
| Apr 2017 | 26,100 |
| May 2017 | 37,200 |
| Jun 2017 | 20,500 |
| Jul 2017 | 52,000 |
| Aug 2017(p) | 8,600 |
| Sep 2017(p) | -104,700 |
| Footnotes: (p) = preliminary | |