
Natural gas prices mirrored a rollercoaster during the last few months — lots of ups and downs. Let’s explore why. The U.S. Bureau of Labor Statistics publishes many indexes that measure changes in prices for natural gas. Producer Price Indexes and Import Price Indexes tell us about these and other price movements faced by U.S. businesses. Natural gas is critical to the U.S. economy, and changes in natural gas prices can have a large impact on our daily lives. You may use natural gas for cooking or heating your home, but did you know these facts about natural gas?
- Natural gas has surpassed coal as the largest source of electricity generation in the United States.
- The United States has become the world’s largest natural gas producer and consumer.
- Natural gas consumption in the United States reached historic highs in 2018.
According to the U.S. Energy Information Administration, natural gas production reached record levels in 2018, driven by improved drilling techniques (such as hydraulic fracturing or “fracking”), more wells, and increased crude oil production. Natural gas can be produced either through direct extraction or as a byproduct of crude oil drilling. With more production, we might expect prices to fall because more natural gas is available on the market. Natural gas prices increased sharply in the fourth quarter of 2018, however.
Let’s look at that rollercoaster of natural gas prices. In the early part of 2018, normal seasonal fluctuations and increased production pushed natural gas prices down. However, higher U.S. demand limited the decline in prices. Prices leveled off somewhat during the spring and summer months. Over the final 3 months of 2018, U.S. import prices for natural gas increased by 138.8 percent, the largest quarterly increase since the index began in 1982. Likewise, producer prices for natural gas increased by 90.2 percent over the same period.
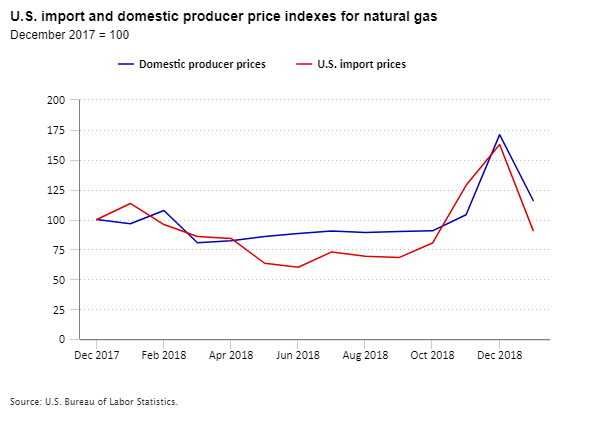
Editor’s note: Data for this chart are available in the table below.
There were many reasons prices rose sharply in the last 3 months of 2018. The industrial and electric power sectors are the biggest users of natural gas. The record-high natural gas consumption in the United States in 2018 was driven by record-high demand from the electric power sector. Despite record production in 2018, natural gas storage stocks hit a 16-year low by the end of the year. More domestic consumption and increased exports cut into the natural gas inventory. That pushed prices up starting in October, but there were other reasons prices rose.
An explosion of a major Canadian natural gas pipeline disrupted supply in mid-October. This explosion sharply limited U.S. imports of natural gas from Western Canada and reduced natural gas supply in the Northwest United States. Natural gas distributors asked customers to restrain usage, but import prices still rose. In November, imports from the pipeline grew to about half the amount before the explosion. Even though the natural gas supply from the pipeline moved toward full capacity in December, the demand for natural gas kept upward pressure on prices.
California also experienced natural gas pipeline capacity and storage issues later in the year. Those issues pushed prices up for the entire West Coast region during the fourth quarter of 2018.
Domestically, the increased demand for natural gas over the year resulted in the fourth lowest volume added into working stocks during the refill season since 2005. The refill season, typically April through October, is when natural gas supply typically outpaces demand, allowing working stocks to grow for the upcoming winter season. By November’s end, working gas stocks in the lower 48 states were below 3 trillion cubic feet for the first time since 2002 because of the depletion over the year. This lower supply, coupled with reduced imports, pushed domestic prices up as demand grew from electricity generation and heating needs from severe cold weather in most regions of the country.
Prices then fell in January 2019. Import prices for natural gas decreased by 44.2 percent in January, and producer prices fell 32.2 percent. Imported natural gas from Western Canada returned to more normal levels in the first half of January. As a result, natural gas supply caught up to demand, pushing prices lower. In addition, warmer-than-average temperatures during the beginning of January limited demand for natural gas, also placing downward pressure on prices.
Want to learn more?
- Check out the most recent Producer Price Indexes news release and the U.S. Import and Export Price Indexes news release.
- Contact the Import/Export Price Indexes information staff at (202) 691-7101 or email us.
- Contact the Producer Price Indexes information staff at (202) 691-7705 or email us.
| Month | Domestic producer prices | U.S. import prices |
|---|---|---|
| Dec 2017 | 100.0 | 100.0 |
| Jan 2018 | 96.5 | 113.4 |
| Feb 2018 | 107.5 | 95.8 |
| Mar 2018 | 80.6 | 85.8 |
| Apr 2018 | 82.3 | 84.2 |
| May 2018 | 85.8 | 63.4 |
| Jun 2018 | 88.3 | 60.0 |
| Jul 2018 | 90.3 | 72.9 |
| Aug 2018 | 89.1 | 69.3 |
| Sep 2018 | 89.9 | 68.1 |
| Oct 2018 | 90.5 | 80.3 |
| Nov 2018 | 104.0 | 128.6 |
| Dec 2018 | 171.0 | 162.7 |
| Jan 2019 | 115.9 | 90.7 |