
BLS has closely tracked the upheaval in the U.S. job market in recent months, most notably through the monthly “payroll jobs” data. These data, from the Current Employment Statistics survey, provide detail on the change in employment in each industry. We count jobs by asking thousands of employers every month the number of employees on their payroll for the pay period that includes the 12th of the month. For August, we reported that employers added 1.4 million jobs. Today I want to scratch beneath that surface and examine recent employment trends in several industries.
But before I go on, let me take a moment to thank all those businesses that respond voluntarily to our request for information every month. With so much going on, responding to a BLS survey may not be your highest priority. Yet, you continue to come through every month, and for that we extend our sincere thanks.
Using February 2020 as our starting point, let’s look at the job losses that occurred through April. From the nearly 152 million jobs recorded in February, we lost just over 22 million by the end of April. That’s a drop of 14.5 percent in total nonfarm employment. But that decline varied across industries. The leisure and hospitality industry, including restaurants, hotels, and amusements, saw the largest percentage decline, down 49.3 percent from February. Other industries saw percentage declines similar to the overall total, such as retail trade (decline of 15.2 percent) and construction (decline of 14.2 percent). And some industries experienced small declines, such as financial activities (decline of 3.2 percent). These differences stem from many factors, including stay-at-home orders, the need for workers in essential industries, the ability for some work to be done remotely, and on and on.
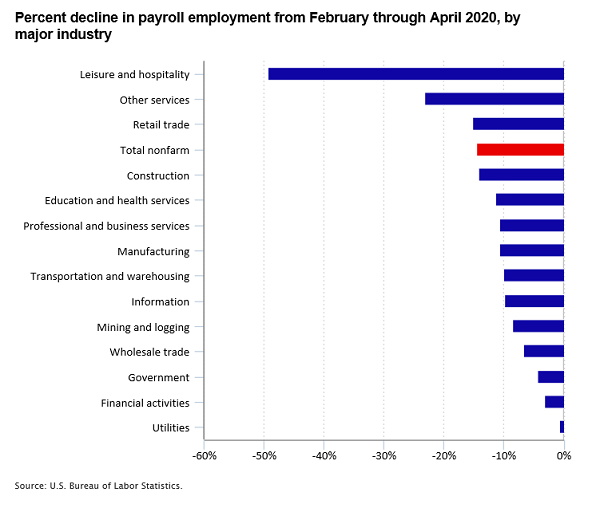
Editor’s note: Data for this chart are available in the table below.
Following large losses through April, many industries gained jobs over the next four months. By August, about 10.6 million jobs were added to employer payrolls. One way to look at these figures is to consider what share of the March/April job loss was “recovered” by the May/June/July/August job gain. Overall, 47.9 percent of the decline was recovered. The retail trade industry restored the greatest percentage of job losses, 72.5 percent, followed by other services (including barbers and salons, 61.2 percent) and construction (60.8 percent). Education and health services recovered 47.6 percent of lost jobs, nearly equal to the overall percentage of jobs recovered, as did manufacturing (47.2 percent). Utilities, mining and logging, and the information industry had fewer jobs in August than in April.
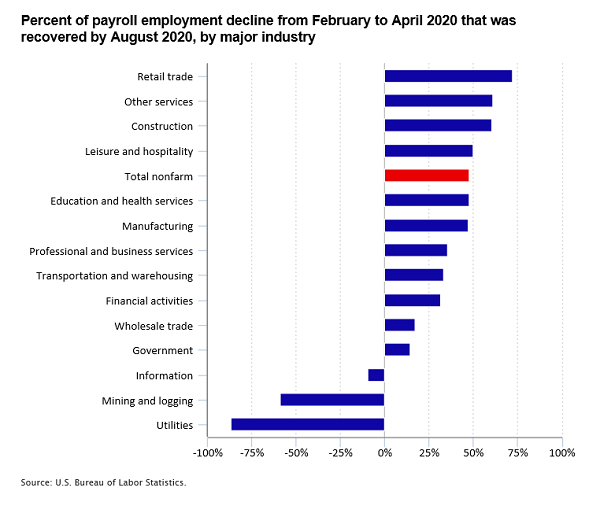
Editor’s note: Data for this chart are available in the table below.
While the percentages let you compare industries, digging a little deeper uncovers other interesting stories. For example, three sectors, professional and business services; manufacturing; and transportation and warehousing, each lost between 10 and 11 percent of jobs from February to April 2020. But those losses amounted to vastly different numbers of jobs: 2.3 million in professional and business services; 1.4 million in manufacturing; and 570,000 in transportation and warehousing.
Some detailed industries provide interesting contrasts. Within health care from February to April, hospital employment showed a slight decline while offices of physicians lost about 11 percent of jobs. In contrast, offices of dentists declined by 56 percent, losing more than half a million jobs. As of August, employment had rebounded in most health care industries, with the notable exception of nursing and residential care facilities, which has declined each month since February.
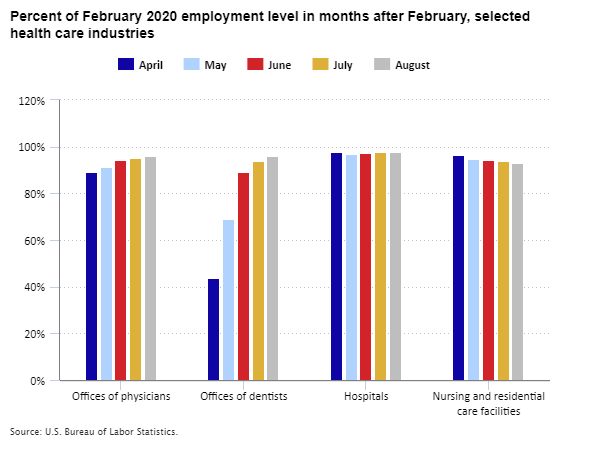
Editor’s note: Data for this chart are available in the table below.
Americans were encouraged to stay at home and only venture out for essential items, which is reflected in employment in various retail industries. For example, food and beverage stores showed little employment change from February to August. In contrast, clothing store employment declined by 62 percent through April, and only half of that loss had been recovered by August. Jobs in electronics and appliance stores declined through May and in August stood at about 90 percent of their February total.

Editor’s note: Data for this chart are available in the table below.
A reminder that Current Employment Statistics data are updated as new information becomes available. Thus, the July and August data shown here are preliminary and will be revised. Employment data by industry are also available for states and localities.
When looking for trends or comparing industries of different sizes, the comparisons shown here can be helpful. The detailed data are available for you to compare other industries, too. Get the data through the BLS data query system.
| Industry | Percent decline |
|---|---|
Leisure and hospitality | -49.3 |
Other services | -23.1 |
Retail trade | -15.2 |
Total nonfarm | -14.5 |
Construction | -14.2 |
Education and health services | -11.3 |
Professional and business services | -10.7 |
Manufacturing | -10.6 |
Transportation and warehousing | -10.0 |
Information | -9.8 |
Mining and logging | -8.5 |
Wholesale trade | -6.7 |
Government | -4.3 |
Financial activities | -3.2 |
Utilities | -0.7 |
| Industry | Percent recovered |
|---|---|
Retail trade | 72.5 |
Other services | 61.2 |
Construction | 60.8 |
Leisure and hospitality | 50.2 |
Total nonfarm | 47.9 |
Education and health services | 47.6 |
Manufacturing | 47.2 |
Professional and business services | 35.8 |
Transportation and warehousing | 33.2 |
Financial activities | 31.5 |
Wholesale trade | 17.4 |
Government | 14.2 |
Information | -9.5 |
Mining and logging | -59.0 |
Utilities | -86.8 |
| Industry | April | May | June | July | August |
|---|---|---|---|---|---|
Offices of physicians | 89.2 | 91.5 | 94.1 | 95.2 | 96.2 |
Offices of dentists | 43.8 | 69.2 | 89.0 | 93.9 | 96.1 |
Hospitals | 97.7 | 97.0 | 97.1 | 97.6 | 97.8 |
Nursing and residential care facilities | 96.4 | 94.9 | 94.3 | 93.7 | 93.2 |
| Industry | April | May | June | July | August |
|---|---|---|---|---|---|
Electronics and appliance stores | 89.8 | 74.7 | 80.2 | 86.2 | 90.5 |
Building material and garden supply stores | 97.3 | 101.8 | 104.3 | 105.1 | 106.1 |
Food and beverage stores | 98.6 | 100.4 | 101.7 | 101.0 | 101.2 |
Clothing and clothing accessories stores | 38.2 | 44.5 | 62.4 | 70.3 | 71.1 |
Department stores | 75.2 | 79.4 | 90.0 | 94.5 | 97.5 |
General merchandise stores, including warehouse stores | 104.6 | 106.2 | 109.0 | 105.8 | 110.1 |